
 Trade W

Late traders tend to miss the majority of trends because by the time the trend is obvious, much of the move has already happened. One of the few tools traders can use to identify a new trend before it fully establishes itself is the leading diagonal Elliott Wave pattern. However, this is only possible if you know what to look for.
In this guide, we explain everything you need to know about the leading diagonal Elliott Wave pattern, how it develops, why it forms where it does, how to trade it, and what mistakes to avoid when using it. The guide includes examples from forex, crypto, and contracts for difference (CFDs), with real-world examples provided at each stage of the process.
The key takeaway from this guide is that it is often possible to identify a leading diagonal Elliott Wave pattern early, which can give you an advantage over other traders. It is one of the few methods that can help identify a trend in its early stages and position you for some of the largest price moves that may follow over the coming weeks.
Leading Diagonal Elliott Wave
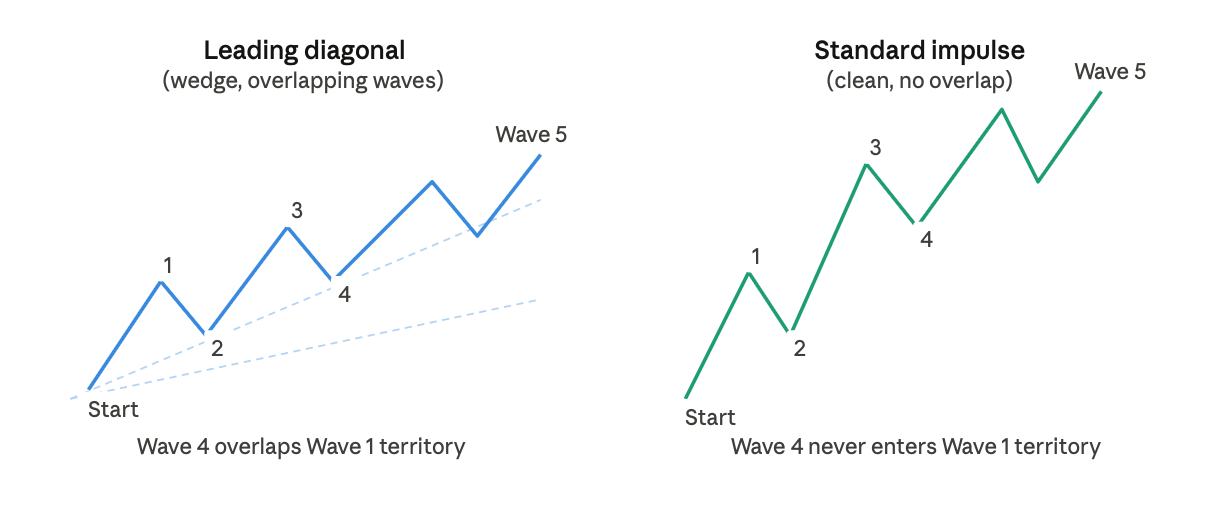
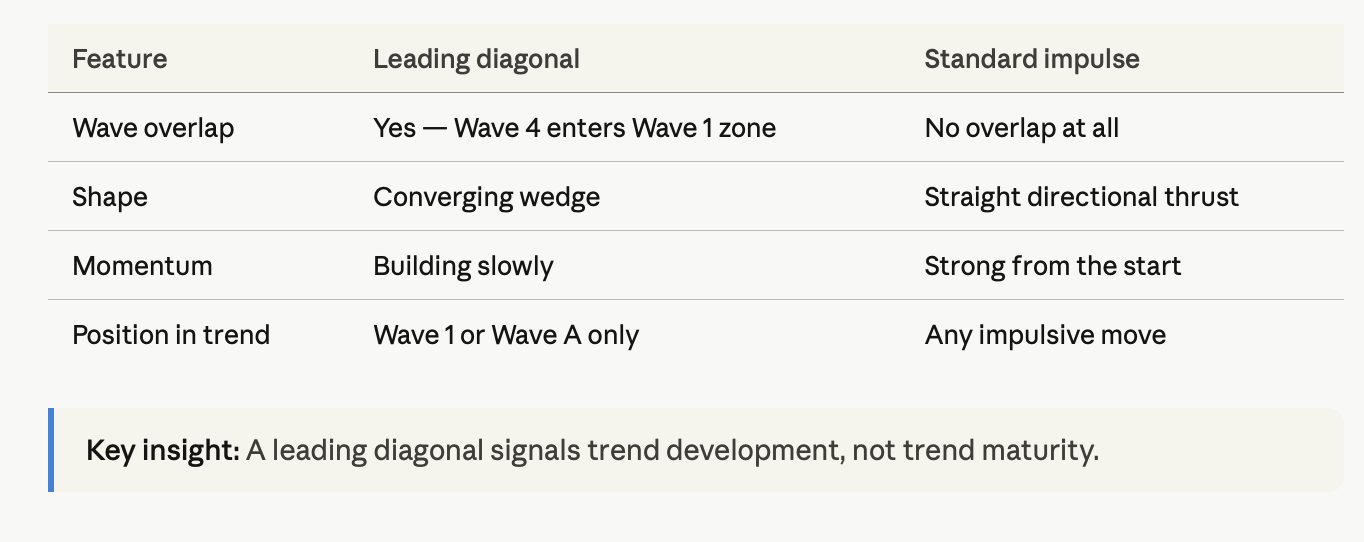
At the beginning of a new trend, price can form a five-wave pattern known as a leading diagonal. A leading diagonal often appears as a wedge, with higher highs and higher lows in a bullish trend, or lower highs and lower lows in a bearish trend. Unlike a traditional impulse wave, the waves within a leading diagonal often overlap with one another. It is this overlap that gives the pattern its distinct identity.
Most trends follow a five-wave structure. A traditional impulse wave moves strongly in one direction and typically shows little to no overlap between waves. A leading diagonal, by contrast, develops more slowly and compresses into a narrower channel. You can think of it as the market learning how to walk before it starts to run.
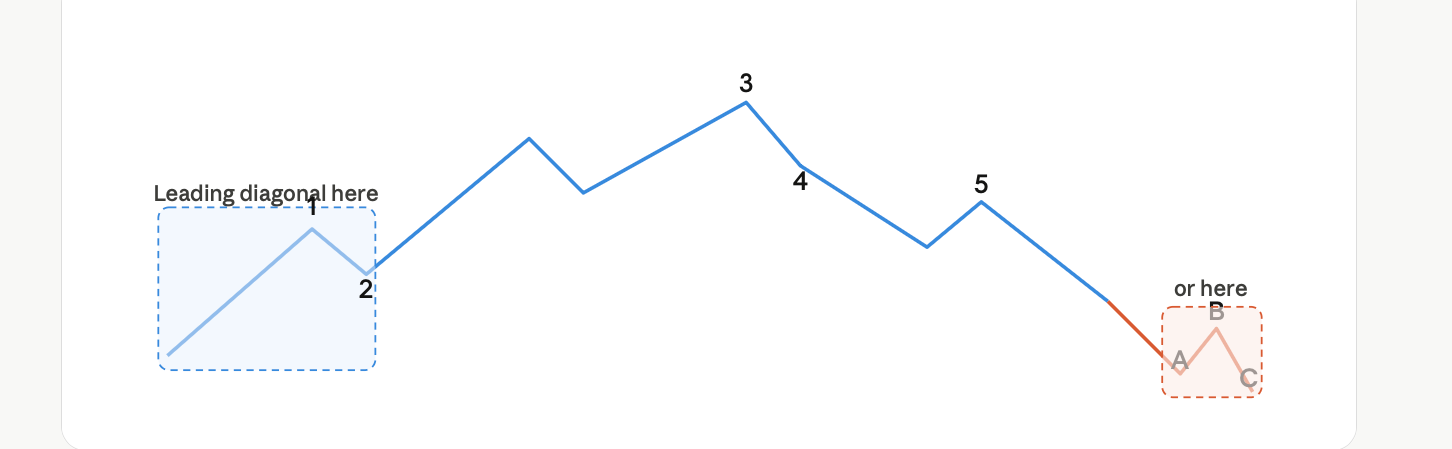
The leading diagonal appears at the beginning of a trend. It typically forms as Wave 1 of a larger impulsive trend or Wave A of a corrective trend. For traders, the timing of when a leading diagonal appears is especially important because it can signal that a new directional move is just beginning.
Understanding the 5-3-5-3-5 Pattern
What makes a leading diagonal different from other wedge patterns is that it follows a precise internal wave structure. Each of the five waves is made up of a specific sequence: five waves in Wave 1, three waves in Wave 2, five waves in Wave 3, three waves in Wave 4, and five waves in Wave 5. This creates the full 5-3-5-3-5 structure.
One way to think about it is like climbing a staircase while exhausted. You take five steps forward, pause to rest, take another five steps, pause again, and continue upward. The forward movement represents progress, while the pauses are part of the overall structure. Even with the pauses, the movement continues in the same direction.
As mentioned earlier, the corrective waves, Wave 2 and Wave 4, often overlap with the impulsive waves around them. This overlap is one of the defining characteristics of a leading diagonal and is what separates it from a traditional impulse wave count. It also reflects the fact that the trend is still developing and has not yet fully accelerated.
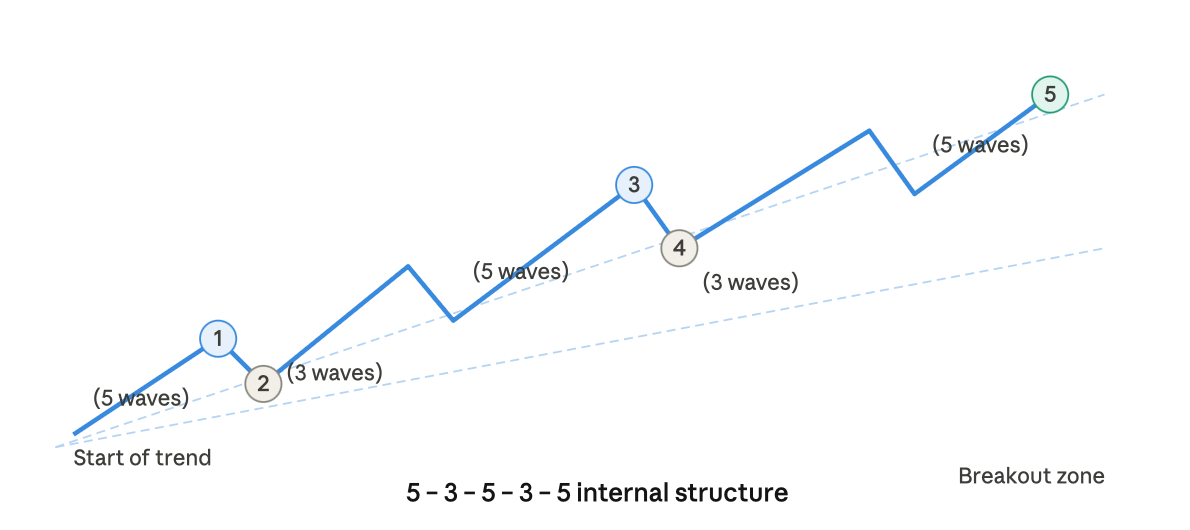
A key feature of the 5-3-5-3-5 structure is that it often signals a gradual build-up in momentum. With each push higher or lower, the market continues progressing in the trend direction while resistance begins to weaken, often setting the stage for a stronger move once the pattern is complete.
Why Leading Diagonals Form Only at the Beginning of a New Trend (Wave 1 or Wave A)
Leading diagonals form only at the beginning of a developing trend because the market psychology that creates them exists at that stage.
When a trend begins to reverse direction, most traders are still uncertain about the new direction, and many continue trading in line with the previous trend. In a new uptrend, for example, sellers from the previous downtrend are still active in the market. This creates hesitation among buyers and leads to slower, less decisive price movement. The result is the gradual, wedge-shaped structure typical of a leading diagonal.
Once the leading diagonal is complete, traders begin to gain confidence in the new direction. This often leads to a stronger and faster Wave 3, as uncertainty fades and momentum builds behind the trend.
The same idea applies to Wave A, the first wave of a correction. During Wave A, many traders are not yet convinced that the prior trend has ended. Some traders begin selling in anticipation of lower prices, while others continue buying in expectation of a continuation. This push and pull creates the overlapping structure of the leading diagonal. Once Wave A is complete, price often accelerates further during Wave C as the correction becomes more widely accepted by the market.
Key Point: Leading diagonals often reflect indecision before a new trend becomes established.
What are the possible reasons that lead to diagonals appearing in Wave 1 or Wave A?
There are two main reasons for this. First, leading diagonals are typically associated with the beginning of new trends. Second, the market psychology that creates leading diagonals is usually present only at the point of trend reversal.
When price begins moving from one trend into another, there are often lagging participants who continue trading in the direction of the previous trend. This means there may still be sellers holding short positions while buyers begin stepping in. At the same time, those buyers are often cautious and not yet fully committed to the new direction. The result is a gradual push higher or lower where progress is uneven and often overlapping. This creates the wedge-like structure of the leading diagonal.
Once the wedge has formed and the pattern is complete, the market often begins moving with more confidence. This is why Wave 3 often accelerates strongly after a leading diagonal, as much of the uncertainty created during the transition has disappeared.
The psychology at the start of corrective Wave A is very similar. Traders are often unsure whether the previous trend has actually ended. Early sellers begin testing lower prices, while buyers continue defending the prior trend. This creates a period of tension and overlapping price action. Once Wave A is complete and the correction becomes clearer, price often accelerates into Wave C.
Leading diagonals provide valuable insight because they often reveal uncertainty before there is strong confirmation that the trend has reversed.
Don’t Think That Leading and Ending Diagonals Are the Same
Although they may look similar on the chart, both forming wedge-shaped patterns with five waves, they serve very different purposes and should not be treated the same.
Ending diagonals are typically a sign that a trend is coming to an end. They often appear at the terminal stage of a trend, usually in Wave 5 of an impulse or Wave C of a correction. At this point, momentum is often fading, volume may begin declining, and once the ending diagonal is complete, a sharp reversal can follow.
Leading diagonals, on the other hand, suggest that a trend is just beginning. Rather than signalling exhaustion, they often reflect building momentum. Once a leading diagonal completes, price often accelerates in the same direction as the diagonal rather than reversing.
While the two patterns can look very similar, they can lead to opposite trade opportunities. A leading diagonal may suggest preparing to trade with the emerging trend. An ending diagonal may suggest preparing for a reversal against the existing trend.
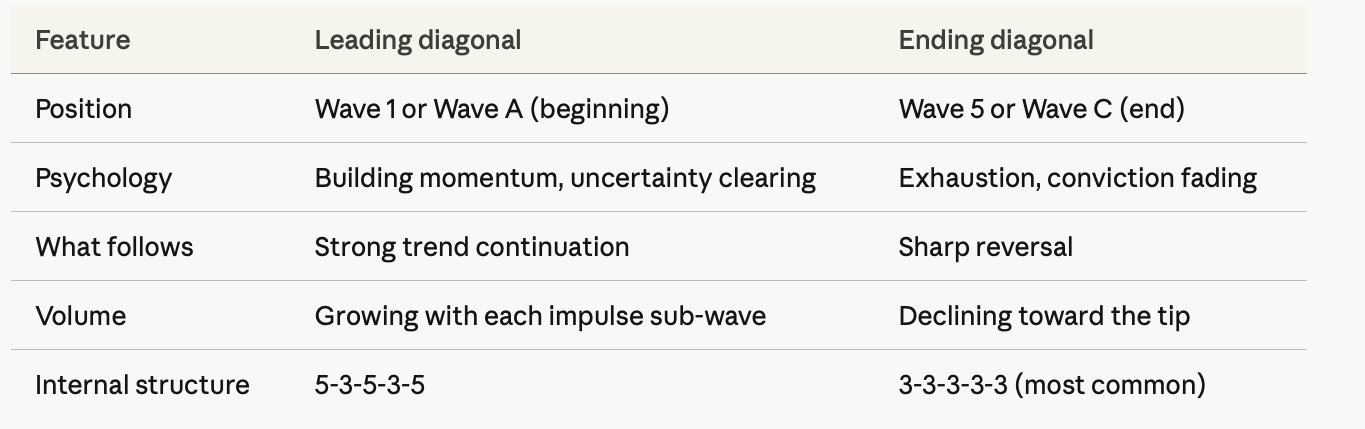
A simple rule is this: if the wedge forms after a long-running trend, it may be an ending diagonal. If it forms immediately after a trend reversal, it is worth considering whether it could be a leading diagonal.
In short, leading diagonals often begin trends, while ending diagonals often mark their completion. Knowing the difference is essential before placing a trade.
How to Identify One on a Real Chart
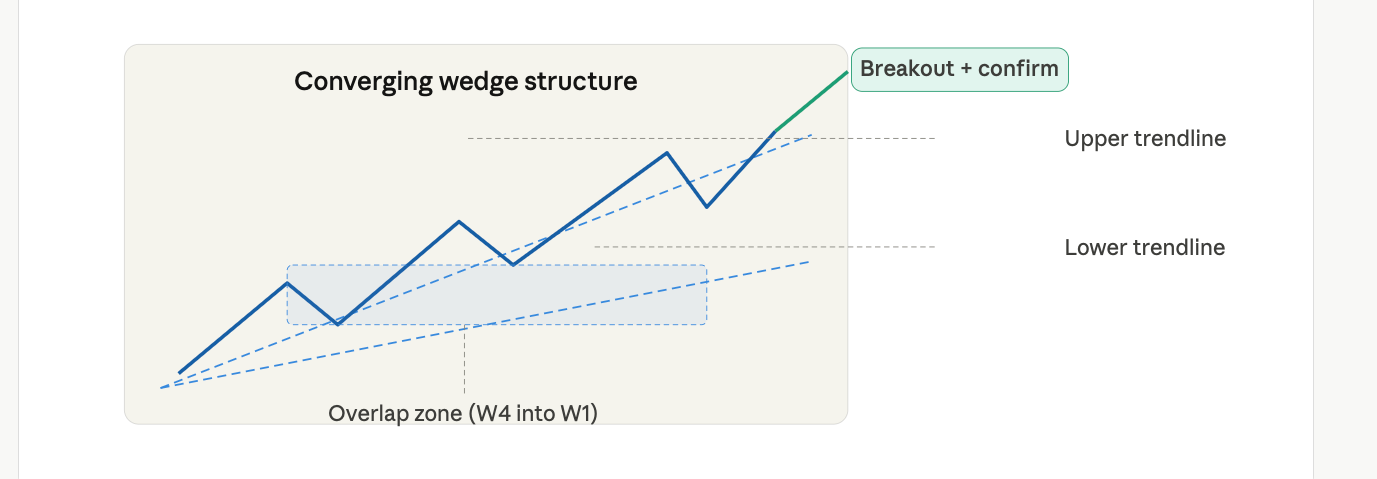
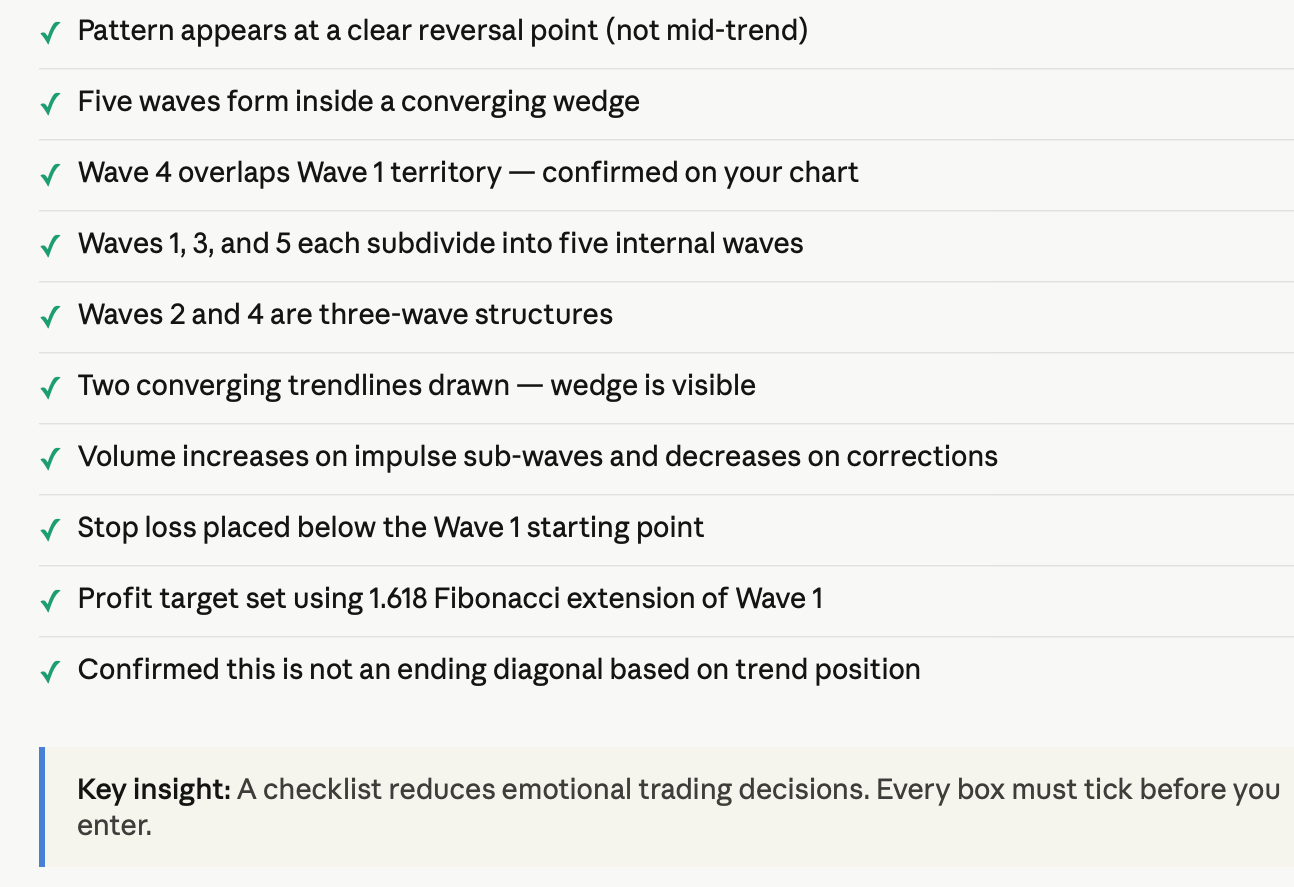
Five confirmations are commonly used to identify a leading diagonal. First, price forms a converging wedge, meaning the two trendlines drawn around the pattern move closer together as the structure develops. Second, Wave 4 overlaps into Wave 1, which is one of the defining characteristics of the pattern. Third, each push in the trend direction continues making progress, but within the narrowing wedge structure. Fourth, volume often increases during the impulsive waves and contracts during the corrective waves. Fifth, the pattern should appear at the beginning of a larger move, not in the middle of an already established trend.
If all five confirmations are present, the pattern may be treated as a leading diagonal. If there is no overlap between Wave 1 and Wave 4, it is more likely a standard impulse wave rather than a leading diagonal.
The Psychological Market Aspect Behind the Pattern
At major trend reversal points, most market participants are still positioned in the direction of the previous trend. When price begins moving in the opposite direction, many traders initially assume it is only a temporary pullback rather than the start of a new trend. This uncertainty is one reason why the leading diagonal contains overlapping corrective sub-waves.
As the diagonal continues developing, more traders gradually begin accepting the new direction with each additional move higher in a bullish pattern or lower in a bearish one. Institutional traders may begin quietly building positions, while many retail traders remain hesitant and wait for confirmation before committing. This hesitation and conflict between buyers and sellers create the overlapping price action and wedge-like structure that defines the leading diagonal.
Once the fifth wave of the leading diagonal is complete, many of the remaining traders who doubted the reversal have either exited their positions or shifted their bias. At that point, the market often transitions into a much stronger impulse move as conviction in the new trend begins to spread.
Conclusion: Leading diagonals often reflect market indecision before broader participation enters the trend. The wedge structure acts as a visual representation of the market struggling between the old trend and the emerging one.
Trading Strategy for Leading Diagonal Elliott Waves
There are three common strategies for trading leading diagonal Elliott Waves, each with a different level of risk and reward.
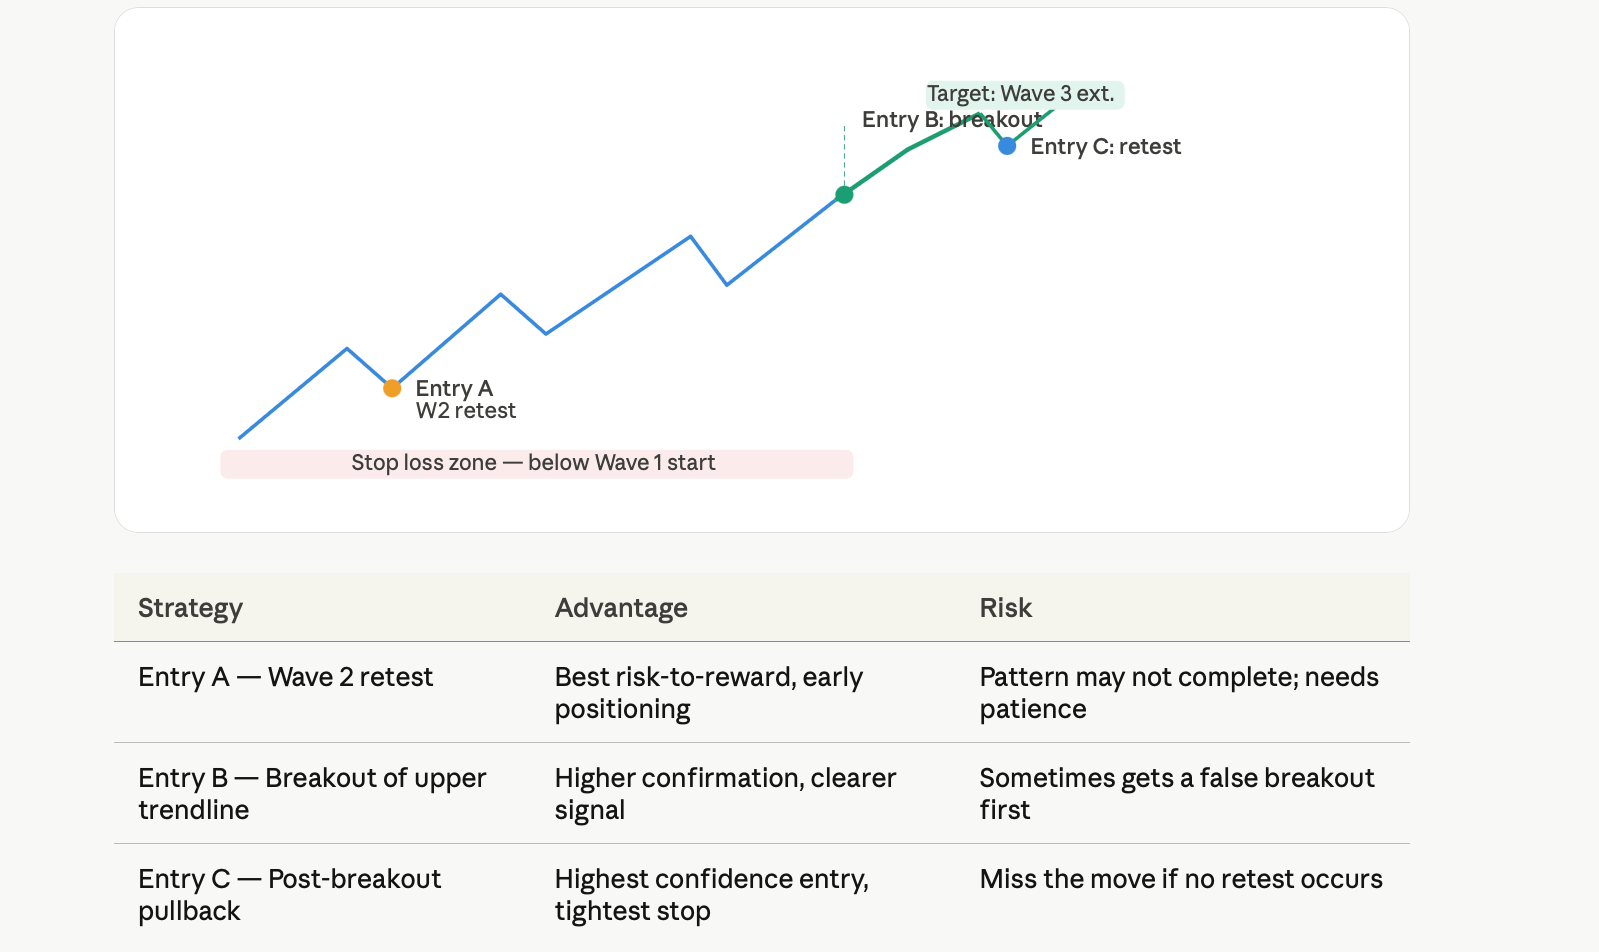
For all three approaches, stop-loss levels are often placed below the start of Wave 1, which acts as the invalidation point for the leading diagonal pattern. Profit targets are commonly measured using Fibonacci extensions of Wave 1 projected from the Wave 2 low, with the 1.618 extension often used as a first target for Wave 3.
The key lesson is that confirmation matters more than prediction. Rather than trying to anticipate the move too early, traders often wait for the structure to complete before risking capital.
Common Mistakes to Avoid
Traders often run into trouble with leading diagonals because the pattern can seem easy to spot, but is often misidentified in practice. One of the most common mistakes is forcing a wave count onto a chart that does not show clear overlap between the waves. Not every wedge is a leading diagonal. Wedge-shaped structures can also appear in pennants, flags, and ending diagonals, and each should be interpreted differently.
Another common mistake is entering before Wave 5 has completed. The pattern is generally not considered complete until Wave 5 finishes. Entering during Wave 4 can expose traders to unnecessary risk, especially if the structure is still developing and the price has not yet confirmed the pattern.
A third mistake is ignoring market context. A leading diagonal should typically form near the beginning of a possible reversal or at the early stage of a new trend, not in the middle of an already established move. Context matters just as much as the shape itself.
It is also important to pay attention to the internal wave count. The sub-waves within Waves 1 and 3 should show a five-wave structure. If those internal counts cannot be identified clearly, the overall leading diagonal interpretation becomes less reliable.
Leading Diagonal Patterns in Forex, Crypto, and CFD Markets
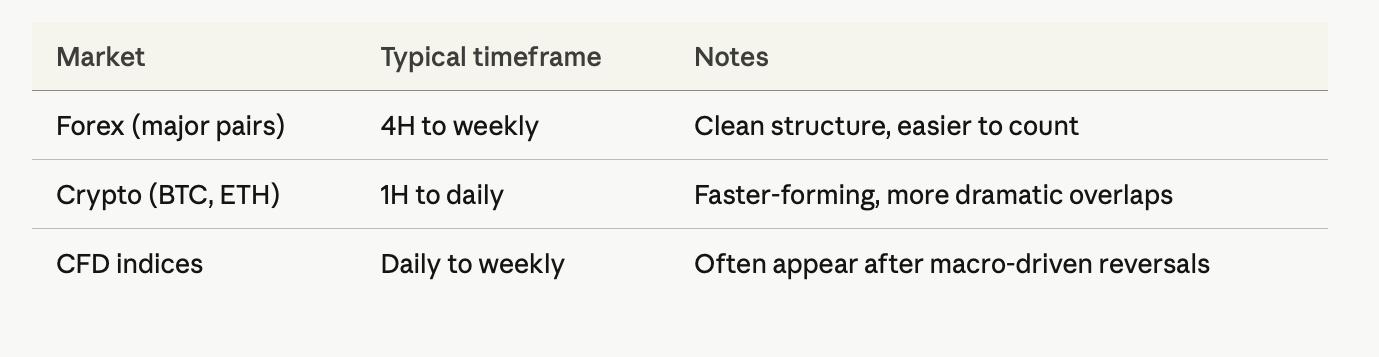
Leading diagonal patterns can appear across all liquid markets. Their formation reflects trader psychology rather than something unique to a specific asset class or instrument.
In forex, major currency pairs such as EUR/USD and GBP/USD can form leading diagonals around major reversal points. These patterns often develop over several days or even weeks on higher timeframes such as the daily chart. Traders often look for them at the early stage of a new trend, particularly before stronger directional moves begin.
Leading diagonals can also be seen in cryptocurrency markets, especially in assets like Bitcoin. They often appear more frequently on 4-hour and daily charts around cycle bottoms or major reversals. Crypto markets are generally more volatile than forex, which can make the wave structure appear more aggressive, but the underlying pattern remains the same.
CFD traders may also find leading diagonals in indices, commodities, and individual equities. These patterns tend to be most reliable in highly liquid instruments where price action is cleaner and easier to count. Markets affected by frequent gaps, thin volume, or irregular pricing can make wave interpretation more difficult and less reliable.
Across forex, crypto, and CFDs, the key idea remains consistent: the leading diagonal reflects uncertainty during the transition from one trend to another. The market changes, but the behaviour behind the pattern stays the same.
Your Pre-Trade Checklist
FAQ
What is a leading diagonal Elliott Wave?
A leading diagonal is a five-wave, wedge-shaped pattern that appears at the very beginning of a new trend, usually in Wave 1 or Wave A. Its internal structure follows a 5-3-5-3-5 count, with Wave 4 overlapping into Wave 1 territory. It often signals early trend development rather than mature trend momentum.
What does the 5-3-5-3-5 structure mean?
It means the impulsive waves, 1, 3, and 5, each subdivide into five smaller waves, while the corrective waves, 2 and 4, each subdivide into three smaller waves. This structure reflects a market gradually building momentum, pushing forward in five-wave advances and pulling back in three-wave corrections.
Why does a leading diagonal appear in Wave 1 or Wave A?
Because those positions mark the beginning of a new trend, at that stage, market participants are often still uncertain about the reversal, which creates the slow, overlapping price action typical of the pattern. Once the diagonal completes, uncertainty often fades, and the trend can accelerate.
How do you trade a leading diagonal?
There are several common approaches. Some traders enter during the Wave 2 retest for a stronger risk-to-reward setup. Others wait for a breakout of the upper trendline for confirmation. More conservative traders may wait for a pullback after the breakout before entering. Stop losses are commonly placed below the start of Wave 1. Profit targets are often based on Fibonacci extensions of Wave 1.
What’s the difference between a leading and an ending diagonal?
The main difference is where they appear and what they signal. Leading diagonals form at the beginning of a trend and often signal building momentum, with continuation expected afterwards. Ending diagonals form at the end of a trend and often signal exhaustion, with reversal often expected afterwards. Confusing the two can lead to trading in the wrong direction.
Visit Tradewill.com and practice spotting leading diagonals on live charts at TradeWill — where structured wave analysis meets real-time execution
Disclaimer: The content of the blog does not represent any position of Trade W, does not serve as any trading-related decision advice, and does not endorse any third-party.