

 Trade W

Introduction: Why Investors Must Pay Attention to Leverage Ratio
Central banks across the globe have been raising rates at an unprecedented rate for over three years. Therefore, one of the most critical indicators for investors today is the Leverage Ratio. Although you won't find Leverage Ratio listed on major publications' front pages, nor does it generally come up at family dinners, experts in the mutual fund industry monitor the Leverage Ratio the same way pilots monitor altitudes. When the Leverage Ratio moves in the wrong direction, the negative consequences can result in catastrophic losses and rapid declines.
Leverage refers to the practice of using borrowed funds to increase your potential returns. A company that has a large amount of outstanding debt is generally referred to as being "leveraged," which means that when a company performs well, it will have amplified positive effects on its profitability, but when it does not perform well, it will suffer from amplified negative effects.
An example for an investor: If you purchased a $500,000 home and paid $100,000 in cash, leaving a $400,000 mortgage, then you would have a leverage ratio of 4:1, which means you are at risk for the complete appreciation of $500,000 of real estate, even though you have only invested $100,000. If the home were to appreciate by 10%, your return on investment would be 50%. If it were to depreciate by 10%, you would lose half your principal. The same concept applies to companies, and therefore the impact could potentially be felt by tens of thousands of investors, employees and creditors.
Leverage Ratio increased to the top of the investor's checklist in 2026 due to the convergence of three major changes occurring simultaneously. First, rates remain elevated in most major economies and, therefore, are more costly to service debt than they were five years ago.
Inflation remained higher for a longer time period than originally anticipated; this caused significant pressure on margins and cash flows. Finally, increased volatility in the markets has made the performance and predictability of heavily indebted companies more difficult and increased the fragility of the business. Any one of these economic conditions is enough to warrant keeping an eye on the Leverage Ratio. But when all three factors are combined, they create a necessity for keeping an eye on it.
Essentially, every investor needs to know how much of a financial risk they can identify in any company's capital structure before they commit their own capital. The Leverage Ratio is a key indicator.
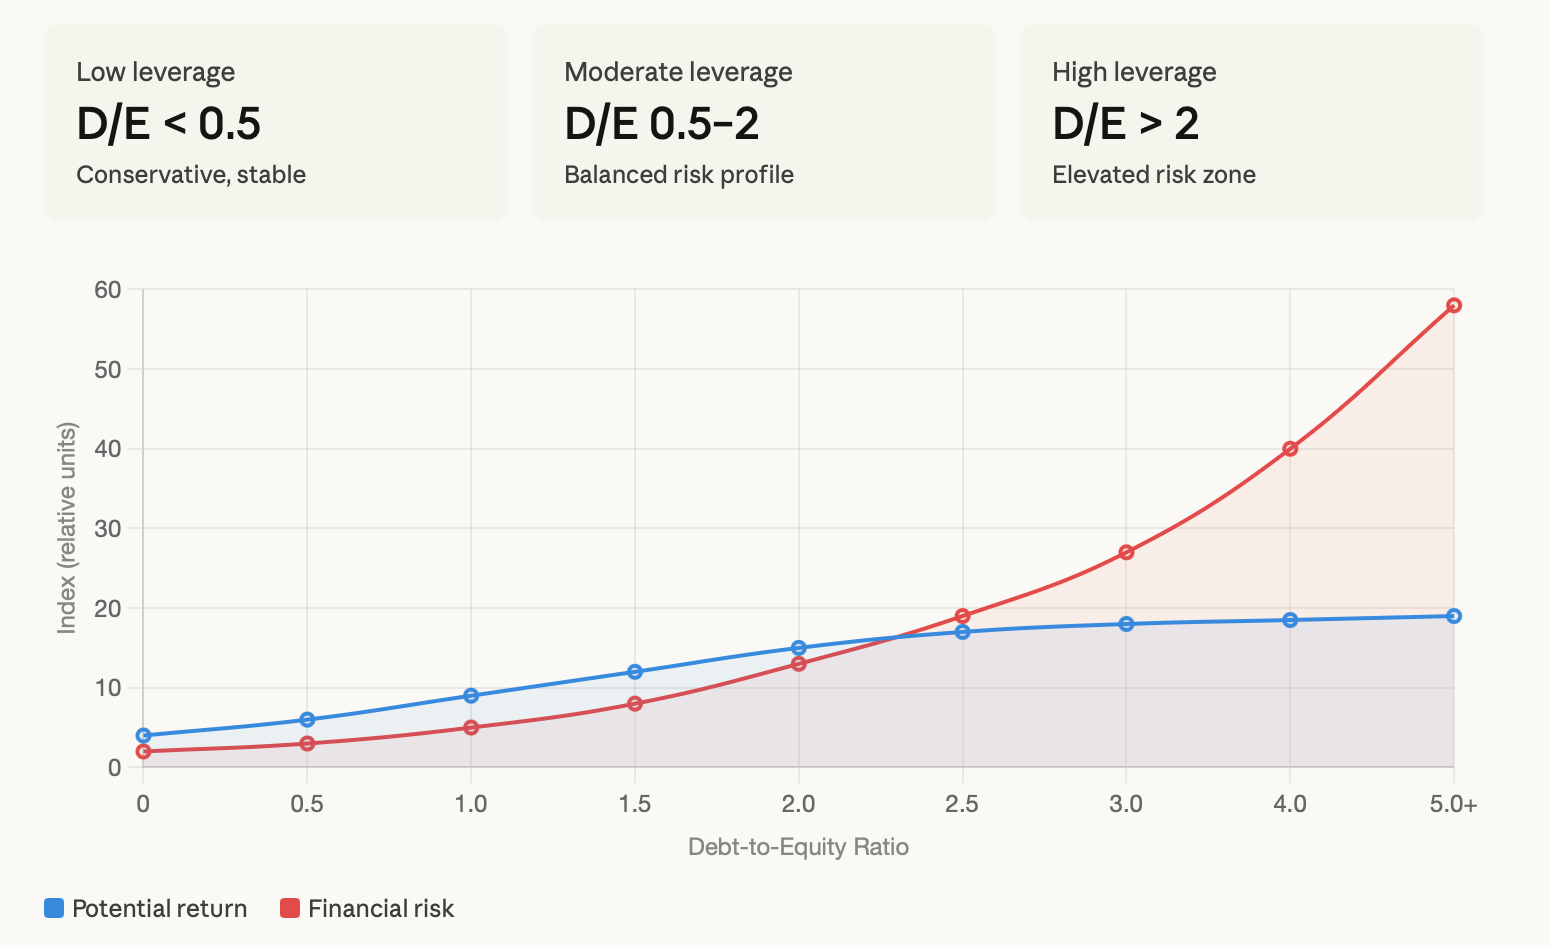
Notice how risk accelerates exponentially while potential returns plateau. That asymmetry is the whole argument for monitoring the leverage ratio closely before entering any position.
What is the Leverage Ratio?
A leverage ratio is used to measure how much of a company’s funding is provided through debt versus equity or total assets. The two most popular types of leverage ratios are calculated by dividing Debt by Equity and by Total Assets.
A higher number indicates that a company uses more borrowed funds relative to its ability to generate its own funds to finance the company’s operations and growth. In a nutshell, think about how much you’ve borrowed against your mortgage, if you’re at risk of losing your income and the increase in interest rates and/or property prices.
The same idea applies to companies, but at such large levels that the risk and reward associated with the business can create repercussions well beyond one single balance sheet.
Types of Leverage Ratios: Equity Multiplier, Debt-to-Equity, and More
The leverage ratios are not all created equal; therefore, the most typical mistake made by retail investors is treating all leverage ratios as though they measure the same thing. Each leverage ratio tells the user a different part of the company’s total debt position, and knowing which ratio to use will distinguish a “superficial” level of analysis from a “genuine” level of analysis regarding risk.
Debt-to-Equity (D/E) ratio: This ratio compares the company’s total liabilities to its total equity. In essence, the D/E ratio indicates how much of the company’s total operations are being funded by debt versus equity. For instance, if a company has a D/E ratio of 1.5, that means the company carries $1.50 of debt for every dollar of equity it has.
In capital-intensive industries such as utilities and telecommunications, D/E ratios tend to be high and often are not indicative of financial distress because these companies typically have predictable cash flows and generate recurring cash flows that will comfortably cover their interest costs. On the other hand, D/E ratios that are so high in cyclical industries such as retail and manufacturing would be major warning signs.
Equity Multiplier ratio: The Equity Multiplier ratio shows how much of the company’s total assets are being financed using debt relative to the company’s shareholder equity. It is calculated as Total Assets divided by Total Shareholders’ Equity. This ratio is included as one of the components in the DuPont Analysis framework, which quantifies return on equity by three drivers. A company will have a high equity multiplier ratio if the company has a large asset base compared to the amount of equity it has, indicating substantial amounts of debt financing.
For example, a company with an equity multiplier ratio reading of 3.0 would indicate the company is using three times as much of its asset base as it has in equity, with the other two-thirds of its total assets being financed by debt.
Debt-to-Assets (D/A) ratio: The D/A ratio allows the investor to see what portion of the total assets of the company would still exist if all of the company’s equity were to be eliminated. A D/A reading of 0.65 would indicate that 65% of the company’s total assets are being financed by debt, and 35% of the company’s total assets are being financed by equity.
Should the market value of these assets potentially decrease, it would provide a substantial cushion for lenders; as the value of the assets continues to decrease, lenders would have preference over equity investors in absorbing losses. Because of this, lenders and bond investors generally follow the D/A ratio closely.
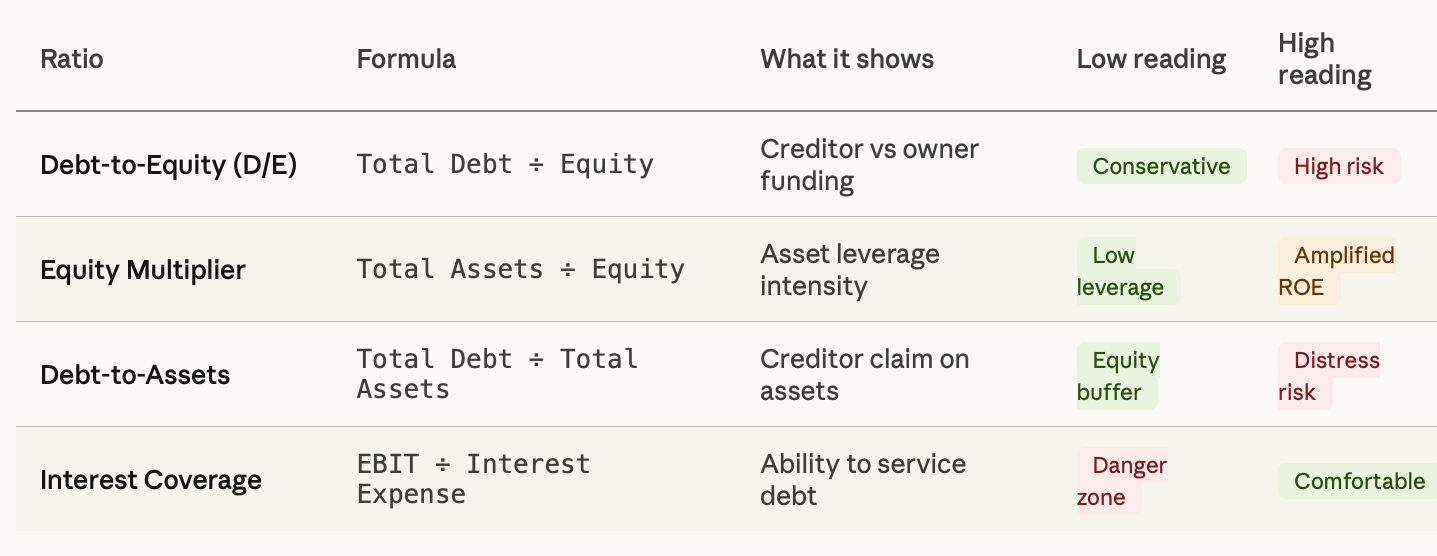
The interest coverage ratio deserves special mention because it captures something the other three don't: the company's ability to actually pay its debt obligations out of operating income. A company can have a manageable D/E ratio on paper but still face a crisis if its earnings are declining and interest payments are consuming an ever-growing slice of EBIT. When interest coverage falls below 2.0, analysts start getting uncomfortable. Below 1.0, the company is technically unable to cover its interest from operations, which is the first marker of a potential credit event.
How Interest Rates Affect Leverage Ratio in 2026
The relationship between interest rates and leverage is not abstract. It plays out directly on every company's income statement, balance sheet, and ultimately its stock price. Understanding this mechanism in 2026, when rates remain higher than they were throughout the 2010s, is critical for any investor who wants to position intelligently.
When rates rise, the cost of new debt increases. Companies with floating-rate debt see their interest expense climb in real time. Companies with fixed-rate debt are initially shielded, but when they need to refinance maturing obligations, they face the new rate environment with no protection. Either way, the effect on profitability is negative, and that compression flows directly into the leverage picture because lower earnings mean weaker capacity to service existing debt.
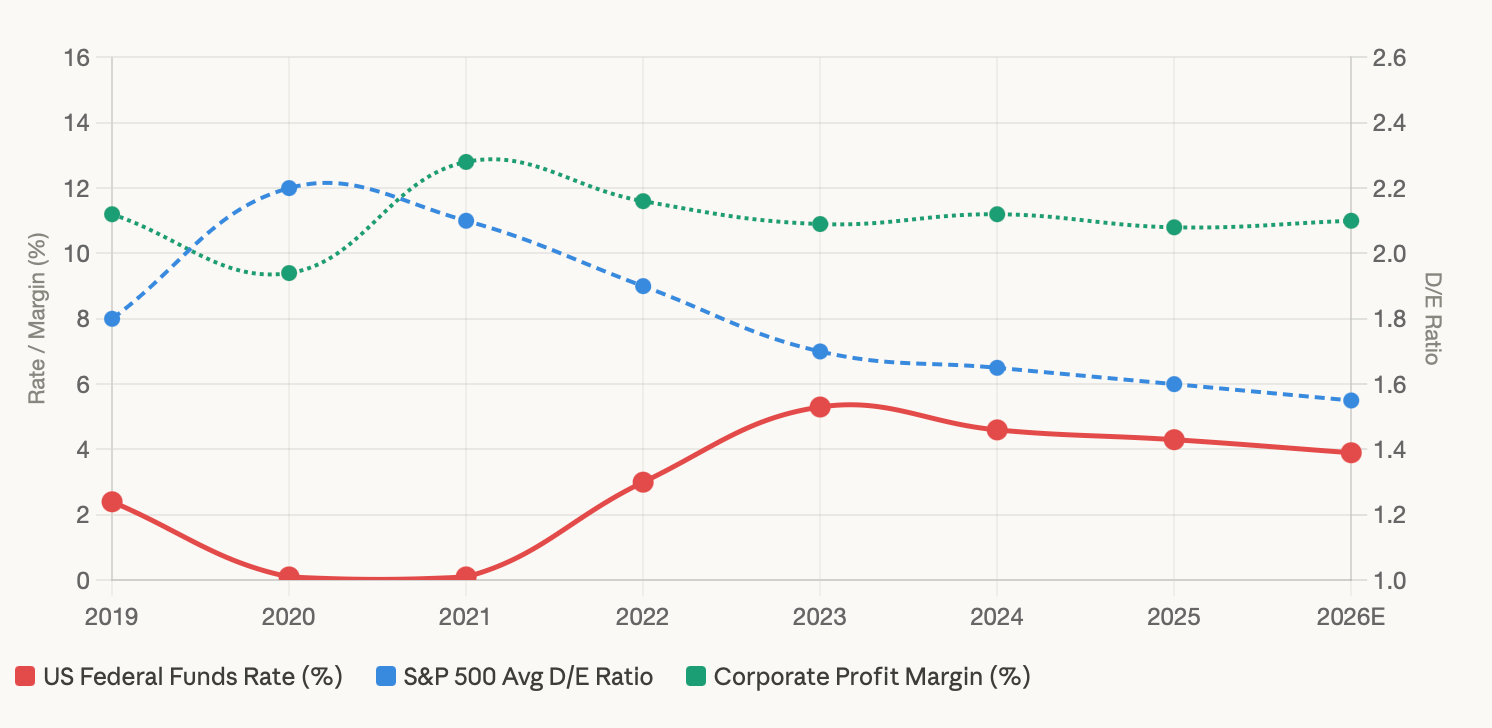
As can be seen in the above chart, with the rate increase from 2022 to the present, the average debt-to-equity ratio (D/E) of public companies has fallen as a result of companies deleveraging. Companies that did not deleverage fast enough suffered from a decrease in their profit margins and, in many cases, were forced into bankruptcy.
Different regions showed different patterns. In the United States, many public companies entered the rate cycle in a relatively strong position in terms of liquidity in the corporate bond market and positive earnings momentum. This enabled many companies to have the flexibility to manage their transition through the rate increase. Europe experienced more challenges than the United States.
The shock of energy prices, combined with the shock of increased borrowing rates, severely hurt the profitability of many high-leverage European industrials. Emerging market public companies with US dollar-denominated debt experienced the greatest pressure due to the dual effects of US rate increases, strengthening the dollar and increasing their cost of capital.
The expectation heading into the remainder of 2026 is that US interest rates will gradually decrease; however, rates will still be higher than they were during the prior decade, which means that leverage will still have a high cost. As such, companies that maintain clean balance sheets will continue to receive premium valuations.
How to Identify High-Leverage Companies and Financial Risks
Knowing what leverage ratio measures is one thing. Knowing how to spot a dangerous one in practice is something else entirely, and it's where most retail investors fall short.
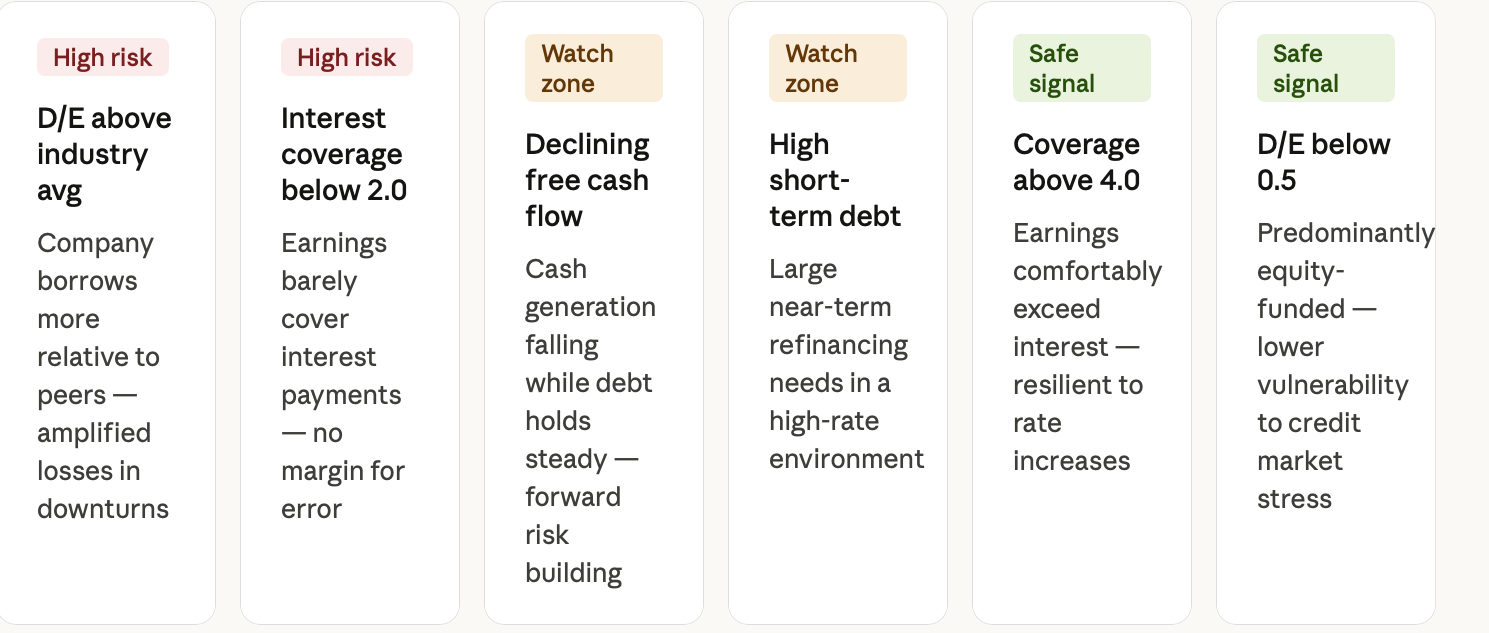
The first signal is a D/E ratio that sits well above the industry average. Context matters enormously here. A utility company with a D/E of 1.8 is operating within normal parameters, because regulated utility revenues are essentially guaranteed and can support consistent debt service. A consumer discretionary retailer with the same D/E ratio is in a much more precarious position, because its revenues fluctuate with consumer confidence, which is exactly the kind of cyclical risk that high leverage amplifies.
The second signal is weakening free cash flow relative to total debt. A company can maintain a stable D/E ratio on paper while its ability to actually generate cash deteriorates. If you look at two years of free cash flow statements alongside debt levels, a divergence between stable-looking leverage ratios and declining cash generation is one of the clearest early warning signs available to investors.
The third signal, and the one most commonly overlooked, is a rising interest expense as a percentage of EBIT. When a company's interest coverage ratio trends downward over several quarters, it means debt is becoming a growing burden relative to earnings. At coverage ratios of 3.0 and above, there's substantial comfort. Between 1.5 and 3.0, the margin of safety is narrowing. Below 1.5, credit analysts start attaching an elevated default probability to the name.
How to Use Leverage Ratio in CFD Trading and Stock Selection
When engaging in Contract for Difference (CFD) transactions, leverage ratio assessments can serve a myriad of purposes. Primarily, this type of analysis provides users with the necessary understanding of companies being traded, as well as how leverage is utilised when entering trades via the CFD structure.
CFD traders can use the leverage ratio as a filter when screening stocks. If you're developing a long-term position on a particular sector that you believe will outperform its peers, using companies with D/E ratios under the median D/E ratio for that sector is an excellent method for minimising the potential for losses due to an unexpected balance sheet deterioration that would negatively affect the sector's overall performance.
Similarly, if you believe that a sector is underperforming, using the highest-leverage companies within that sector will provide the most direct exposure to the accompanying credit risk associated with a sector downturn.
CFD traders must understand how leverage interacts with the financial leverage of individual underlying companies. If a trader enters into a leveraged CFD position on a highly leveraged company, they're actually stacking the leverage from two separate sources together. While this can be profitable, it requires a much tighter risk management discipline. A 5% drop in an underlying company's stock and the use of leverage in the CFD trade can magnify the losses to greater than the original margin amount if the position size is not managed correctly.
Companies classified as blue chips with low D/E ratios, high interest coverage, and stable price trends generally display a more stable and reliable price movement pattern because their earnings are less reactive to changes in interest rates and the conditions of the credit market. High-leverage companies can demonstrate a greater degree of short-term price movement.
However, while the short-term price movements may be more pronounced, the price changes tend to be less predictable, as these companies' price movements are largely influenced by the overall credit market, the refinancing of their debt, and earnings surprises, which all have a lower degree of predictability than the underlying fundamentals of a solidly capitalised business.
Risk Management in Leverage Trading: How to Avoid Large Losses
Traders' leverage can be highly effective, too,l but could also result in devastating losses if used as a means to increase performance. This confusion often leads to account depletion.
All leveraged trades should have predetermined exits established before entering a trade. By placing a stop-loss order at a predetermined percentage of total account equity, the trader is no longer emotionally tied to their decision.
While the exact percentage of allowable loss will vary among traders, most pros limit their loss per trade to between 1 and 2 per cent of their total capital. By adhering to this practice, even after a series of consecutive losing trades, their account balance will not be greatly diminished, whereas if they have a string of winning trades, their total capital will grow significantly.
Position sizing is also a critical aspect of risk management and is equally important to determining the risk and reward from any leveraged trade. The position size of any leveraged trade should not be based on how confident the trader is in their trade; rather, position size should be based on the amount of distance between the current price and the stop loss, as well as the maximum allowable financial loss. Confidence is not a risk management technique.
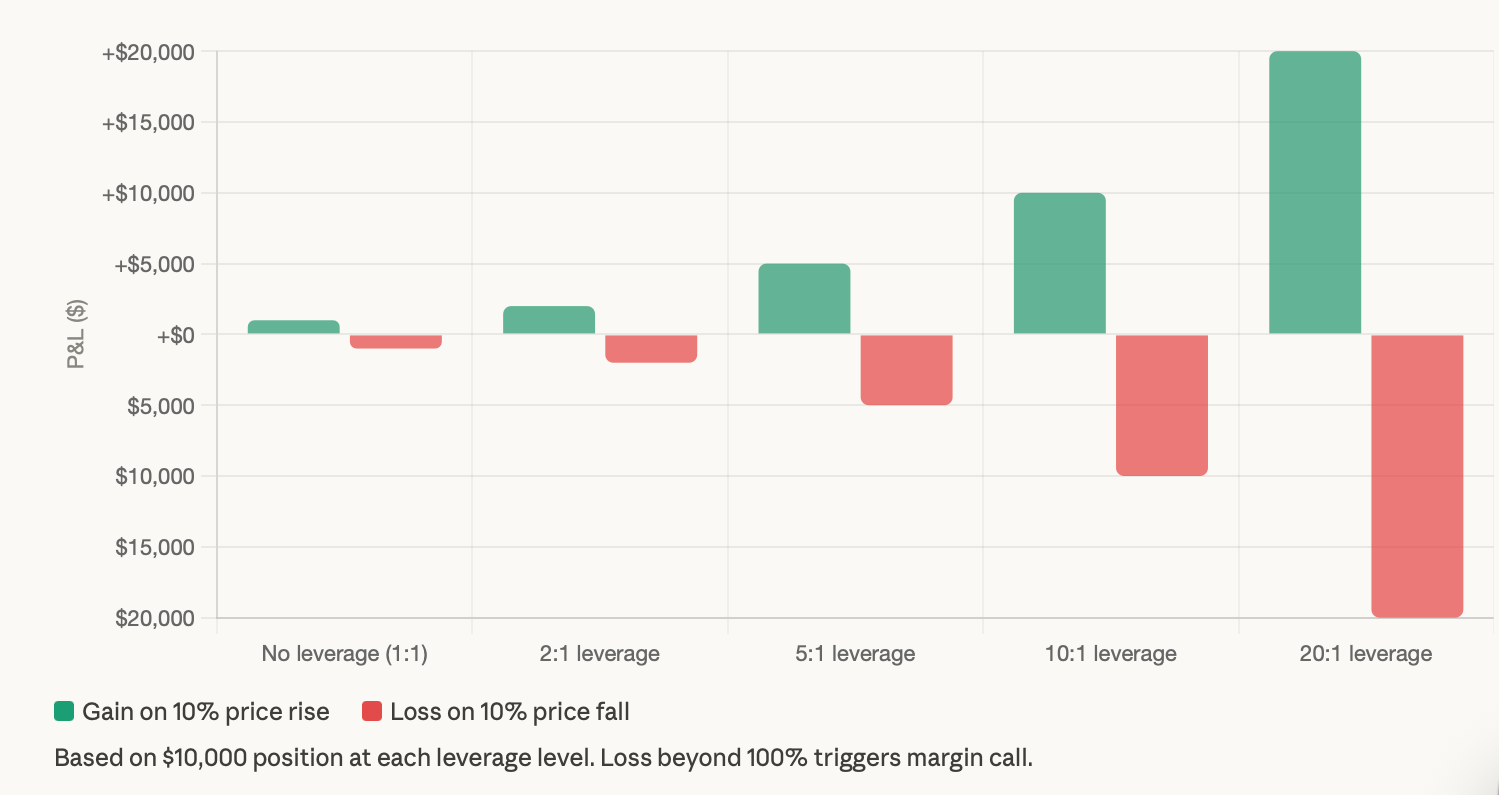
A margin call is triggered when a broker's account equity falls below a specified minimum maintenance level. When a trader uses 20 times leverage, they require an equity balance to be equal to or above 5% of the total amount invested. Therefore, a small downward movement can eliminate all of their position. This is not just a theoretical situation; it is the most common situation for all traders who do not have sufficient equity and focus on positive scenarios without equally modelling potential negatives.
Real-World Case Studies of Leverage Ratio in Financial Markets
Example 1: High-Leverage Collapse - As a consequence of the 2007-2009 financial collapse, Lehman Brothers had a leverage ratio of over 30 to 1. This means Lehman had over $30 in assets for every $1 of equity. When Lehman Brothers' portfolio of mortgage-related assets fell in value by a minimal amount, it eliminated its entire equity cushion, resulting in a complete insolvency within a matter of a few weeks. The leverage ratio was published and visible within Lehman's filings; however, investors chose to ignore the information and subsequently faced the repercussions of their decision.
Example 2: Low-Leverage Normality - Apple entered the current interest rate cycle of 2022-2023 with a net cash balance. When interest rates increased, highly leveraged tech firms experienced significant declines in valuations related to the increased discount rates, whereas Apple's relatively small net leverage insulated it from interest rate pressure, which would have otherwise impacted earnings; therefore, it provided Apple with liquidity and flexibility to utilise the cash as needed, a benefit not available to most of its competitors. As a result, Apple's stock price was significantly more resilient than the broader high-growth tech market.
Example 3: Balanced Structure - The debt-to-equity ratio of Johnson & Johnson has remained between 0.4 and 0.7 through multiple economic cycles. Johnson & Johnson uses the debt mechanism strategically; for example, this includes using debt to finance acquisitions when interest rates are low and repaying debt when profit margins are appropriate to pay down debt, while consistently having interest coverage ratios of more than 10 times.
This results in a capital structure that enables the company to withstand economic downturns, fund acquisitions and simultaneously provide continuing dividend growth. The stability of the capital structure enhances Johnson & Johnson's investment-grade credit rating and lowers its borrowing costs, producing a virtuous cycle of benefits to low-leverage firms while high-leverage firms are unable to replicate this success.
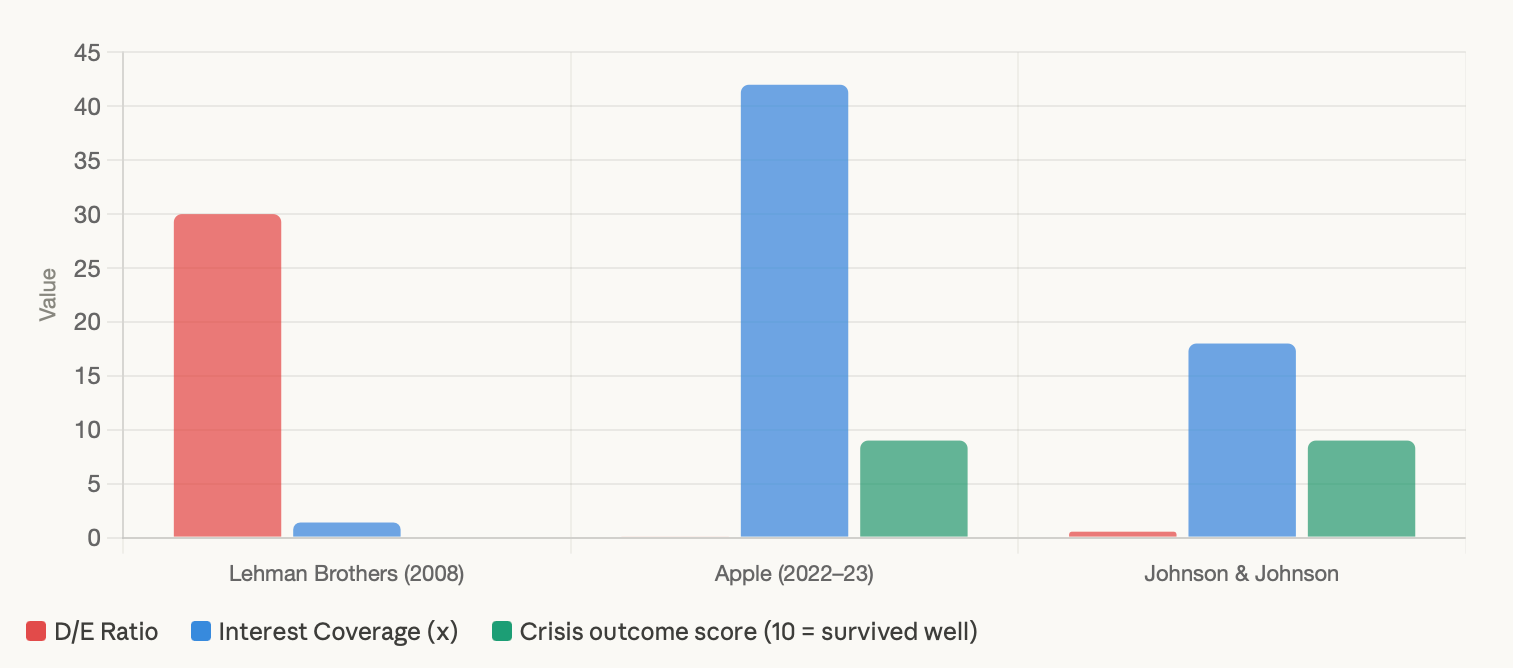
Each of the three companies provides a consistent lesson: The leverage ratio indicates not only the financial situation of the company today but also its expected resilience to potential outside shocks. Companies with little to no debt on their balance sheet will have options available to them when external circumstances worsen. In contrast, highly leveraged companies will have very limited options available to them.
How to Apply Leverage Ratio Analysis on TradeWill
TradeWill offers a trader-friendly way to go from having a conceptual understanding to actively taking positions with minimal barriers. You start by screening for stocks based on financial metrics that relate to leverage ratios, such as D/E ratios, interest coverage ratios, and debt-to-asset ratios. Once you identify stocks by using a screening threshold, such as D/E < 1.0 in the sector of interest, you can quickly find stocks that are likely to have lower risk.
An excellent way for new traders to develop their best practice trading strategies is to create a paper watchlist in a demo account so that they can run simulated trades on both a high-leverage name and a low-leverage name within the same sector. This will allow new traders to see how both price behaviours react in a volatile market environment, during earnings announcements, and macroeconomic releases - at no risk to their capital. Experiencing leverage ratios is not a substitute for being able to read about them. Many traders may not fully appreciate how price behaviour is impacted when there is volatility until they experience it in real-time, albeit through a simulated trade.
Experienced traders utilise TradeWill's platform as a systematic approach by combining leverage ratios with other fundamental factors such as free cash flow yield, sector allocation, and interest rate sensitivity when building watchlists rather than relying on narrative or momentum.
Conclusion: Why the Leverage Ratio Is Important for Investors
While the leverage ratio may not indicate what you should buy next week, the metric guides you to mitigate the potential for extreme losses that occur when you don't take into account the relationship between a company's leverage and its headline numbers.
Additionally, because corporates will experience more difficult refinancing opportunities due to higher interest rates today, along with an increase in the volatility of earnings, firms with solid balance sheets benefit from a competitive advantage by demonstrating greater consistency in their long-term returns.
For investors who rely on empirical data instead of intuition, leverage ratios offer one of the most straightforward and reliable indicators available. Understanding and evaluating a company's debt-to-equity (D/E) ratio does not require sophisticated financial modelling tools or software; simply check it regularly and evaluate it in the context of the company's overall performance.
The same principle applies to traders using leveraged products such as contracts for difference (CFDs). Understanding how leverage amplifies gains and losses, and creating a risk management strategy based on that understanding, distinguishes those who trade sustainably from those who merely make a series of disconnected speculative trades.
Ultimately, given that the majority of profitable traders are never able to accurately predict every move in the market, it is essential to implement a disciplined trading strategy. This includes ensuring positions are properly sized, taking losses early before they have a chance to escalate, and developing an understanding of the financial structure underlying the instruments being traded.
Frequently Asked Questions About Leverage Ratio
What is a good leverage ratio? There's no universal answer, because "good" depends entirely on the industry. A D/E ratio of 1.5 is normal in utilities and telecommunications but elevated in consumer retail. The most useful benchmark is the industry median, combined with an interest coverage ratio above 3.0.
Is a high leverage ratio always bad? Not inherently. Companies in stable, regulated industries can sustain higher leverage because their cash flows are predictable enough to service debt reliably. The risk emerges when leverage is high, and cash flows are volatile or declining, because that combination leaves no margin for error.
How do you calculate the leverage ratio? The most common calculation divides total debt by total shareholders' equity. Total debt can be found on the balance sheet under long-term liabilities and the current portion of long-term debt. Shareholders' equity is also on the balance sheet.
What is leverage in trading? In trading, leverage refers to borrowing capital from a broker to control a position larger than your own funds would allow. A 10:1 leverage ratio means you control $10,000 worth of assets with $1,000 of your own capital, amplifying both potential gains and losses by a factor of ten.
Why is the leverage ratio important? Because it's one of the most reliable early indicators of financial vulnerability. Companies with high leverage are more sensitive to rising interest rates, earnings shortfalls, and credit market stress, and identifying that vulnerability before entering a position is one of the most valuable things a fundamental analysis process can do.
Ready to put leverage ratio analysis into practice?
Open a TradeWill demo account and screen real stocks using D/E ratios, interest coverage, and risk filters before committing a single dollar of live capital.
Disclaimer: The content of the blog does not represent any position of Trade W, does not serve as any trading-related decision advice, and does not endorse any third-party.