

 Trade W
Big Figures constitute one of the most valuable concepts in forex trading that all traders must have a grasp of. The term Big Figure refers to the first few digits in a currency quote that create psychological barriers within the market. For example, when EUR/USD trades at 1.1050, the Big Figure is 1.10. When a USD/CNY quote is 6.95, the Big Figure is 6.9.
These are round number areas that act as magnets for the forex market. They capture the interest of traders around the world and have a naturally occurring support and resistance level. Professional traders use Big Figures to determine their entry and exit plans, while many beginner traders might use them as a reference point regarding market sentiment.
Big Figures are more than simple maths, Big Figures illustrate how human psychology impacts the movements of the market. They demonstrate where emotions such as fear and greed are heightened. Intelligent traders recognize these issues and their patterns, and utilize them to capitalize on opportunities.
This guide will cover everything you want to know about Big Figures. You will learn about their historical context, their psychological impacts, their trading strategies, their data analysis, and risk management, and how to trade Big Figures. We will provide real examples and practical application of these ideas and you should find that they are easy to understand and apply that idea into your trading decisions.
Definition & History
A Big Figure highlights the main digits in a forex quote and are used by traders as an important psychological reference. These are usually the first two or three digits before the decimal point and in some cases the first digit after the decimal point as well. The definition comes from the old open trading floors where traders would quote the small digits and simply assumed the whole market would always be accountable for the big figure.
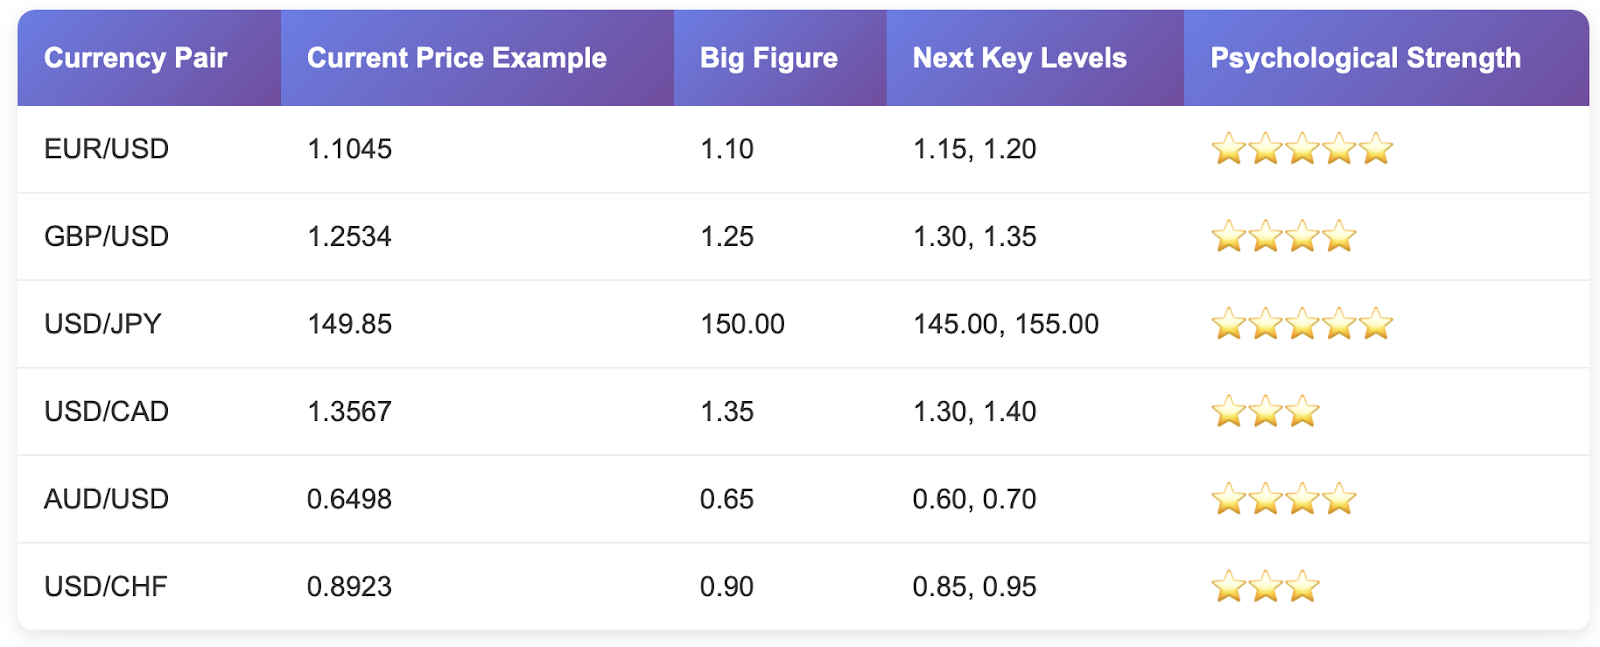
The history of Big Figures can be traced to the origins of forex trading when traders would execute trades over telephone lines between banks. A trader would say EUR/USD is at 50-55 rather than saying it is at 1.1050-1.1055, with the belief that everyone would inherently know it was 1.10. These smaller iterations of the price over the telephone became the foundation for what we now call Big Figures.
Then in the 1970's as forex markets became open to retail and easier access, retail traders also began to follow a similar convention of their institutional counterparts. The emergence of the electronic revolutions was around 1994 and it was at this point that Big Figures became more relevant as traders had detailed correspondence on their computer screen for each currency. It also made the big figures in the price much more visually exciting and impactful for traders to see as they are usually round numbers.
Different markets also adopt the way of using Big Figures in different ways. The forex market uses Big Figures mainly referring to whole number increments and sometimes half number increments. The stock market uses concept based upon dollars with their Big Figures, while Futures markets have rules for Big Figures based upon contract specifications.
The EUR/USD currency pair behaves like a classic Big Figure around, for instance, 1.10, 1.15, or 1.20 while the USD/JPY might behave like a Big Figure at 100.00, 105.00, or 110.00. These levels consistently attract market participants and generate trading opportunities.
Today's algorithmic trading has enhanced the Big Figure phenomena. Computer programs often trigger buy or sell orders at Big Figures. Since machine trading is more psychological than programming, it further enhances the effects we already know are powerful.
Psychology
Ultimately, it is psychology driving the strength of Big Figures in the forex market. Our brain recognizes some numbers represent more than others. Humans get more stressed or excited about round numbers than random numbers. This cognitive bias also leads to self-fulfilling prophecies in trading.
When the EUR/USD approaches 1.10 traders get excited - Some traders fear a break below 1.10. Others are excited about a potential break above. The emotional stress heightens trader volumes and volatility.
Psychologically driven support and resistance levels at the Big Figures do work because millions of traders think the same way. Everyone knows 1.10 is important to the EUR/USD, so it even becomes important in terms of market behavior.
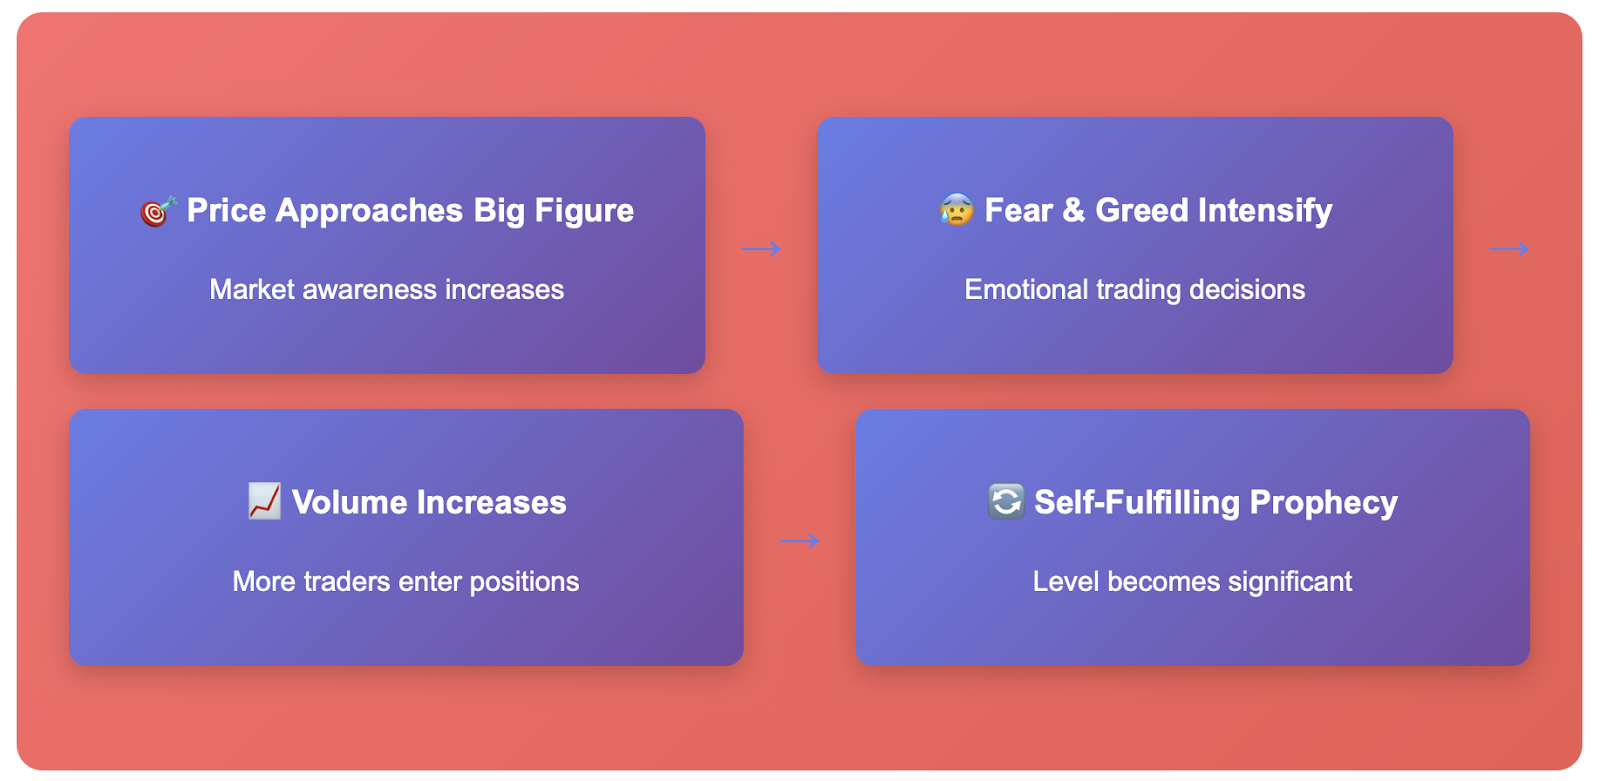
The psychology of Big Figures hinges on fear and greed. Fear is sensed when the price approaches a Big Figure from above, as they fear moving significantly through the level once it breaks. Thus, there is a cluster of fearful traders placing stop-loss orders just below these significant levels, which in turn gives rise to selling pressure.
Conversely, greed takes control of traders when the price is through the Big Figure meaningfully, because they fear missing a big move. They are chasing breakouts extended from round number levels, adding fuel to the trending move themselves.
As part of the psychology of Big Figures, the fact that forex is traded 24 hours a day makes the psychology even more pronounced. With different trading sessions comes fresh eyes to the same level. For instance, Asian traders may be mindful of a Big Figure level which European traders violated earlier.
News events would also be magnified around a Big Figure level. For example, if a significant economic release were to come out while EUR/USD was trading at 1.0995, and there is intrinsic value in the level as a psychological level (1.10), as traders react to the news at what is essentially closing in on 1.10 the moves are likely to be amplified.
Some Strategies
How to deal with Big Figures is a different part of the strategy to learn for successful forex trading. These strategies can be used in different time frames and different market conditions.
For example, intraday traders often use Big Figures as precise entry and exit points. As the price of EUR/USD comes into 1.15, they look for rejections to sell short. If 1.15 is broken with conviction and volume, they ballpark that level and this would become a buy. Their stop-loss in this case would be a limited distance beyond the Big Figure.
The combination of Big Figures with technical indicators can create very strong trading strategies. A 200-period moving average near a Big Figure often doubles the support or resistance strength of a standard moving average, while an RSI divergence at a Big Figure often gives us reversal opportunities.
Range trading strategies, or trading at Big Figures are quite good at finding opportunities in the market when the market price can bounce back to certain previous levels. For example, if EUR/USD is range-bound between 1.10 and 1.15, a trader simply buys at 1.10, and sells at 1.15 until one of the levels can not hold any longer in a true trending direction. This can work well in sideways market conditions as long as 1.10 and 1.15 can hold as well.
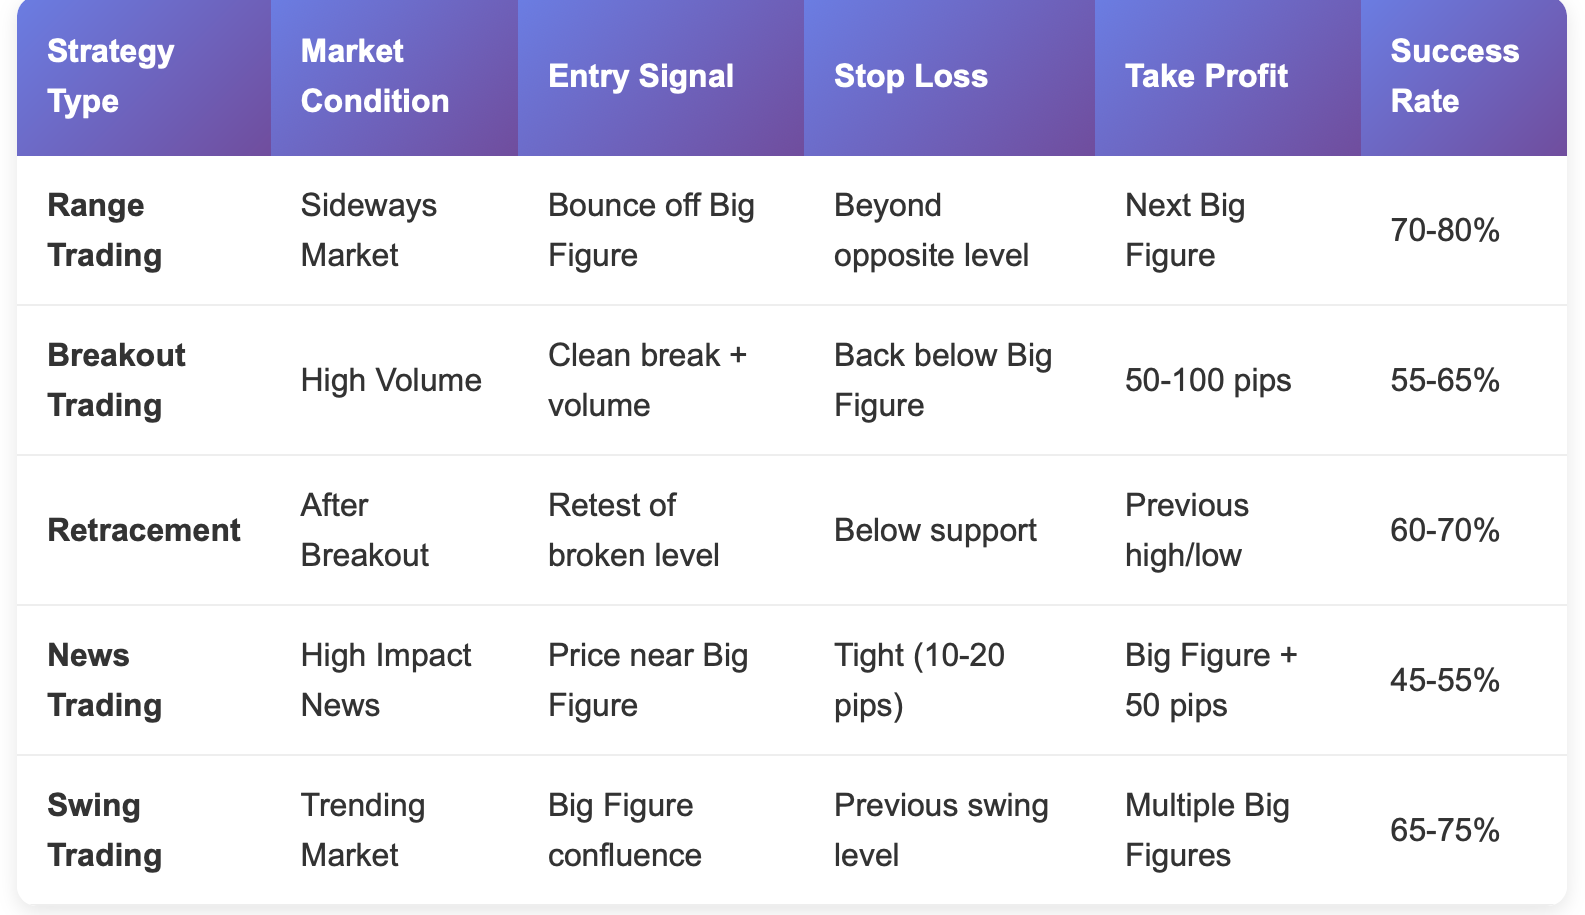
Swing traders will find Big Figures used to identify major swing changes in the market. A breakout or breakdown with a big enough move can move the market price for multiple weeks. An example would be if the USDJPY pair broke above 110.00 after several months of going sideways, the market price will likely lead to a significant upward move in that direction.
Breakout strategies often have the trader focusing on Big Figure violations with high volume. In this strategy, the trader is waiting for a convincing break above or below the level and if they are satisfied with the characteristics of that break, they will typically enter a position in the direction of the breakout.
Retracement strategies were great opportunities to trade when prices retested a former Big Figure when that area used to be a level of resistance. When prices break through that level and continue moving above that level successfully, when prices see a retest, traders would buy the breakout of that level, with a tighter stop loss placed below the previous resistance level.
Trading in the News around Big Figures will depend on precisely the right timing. The more significant an economic release or announcement is near a round number, the more pronounced the reactions will tend to be. Many traders take positions leading up to the release and manage their risk accordingly.
Multiple timeframe analysis is important to trading Big Figures. A Big Figure on the daily chart will give you a certain amount of weight, and the five-minute chart will give you another amount of weight. Many traders will not open their position or will close a position if it does not line up with a higher timeframe Big Figure.
Data Review
Historical data has validated the statistical significance of Big Figures in forex trading. Price action lessons have been examining the measurable effects such as big figures in terms of psychological levels.
Studying the data from the EUR/USD price action over the last 5 years, the data demonstrates some interesting patterns. Based upon the lack of randomness, EUR/USD clustered around the round numbers also demonstrated that the exchange rate is rarely 5 pips away from a Big Figure, tending to cluster at those levels: 1.10, 1.15, 1.20 or near to them.
Continuing with the EUR/USD example, the volatility measurements also validated the actions taken near Big Figures. Average true range calculations placed the volatility ranges 20pips around these major round numbers 20-30% higher than normal. This meant that many traders realized this increased activity around Big Figures as opportunity and/or riskier trading.
Trading volume analysis also supported the concept of Big Figures. I detected numerous times that the volumes in trading segments consistently increased for exchanges on Major Currency pairs at a round number typically by comparing volume segments from days previously. The average trading volume will jump by around 40% on EUR/USD from the previous trading level when the exchange pair is trading within 10 pips of the Big Figure.
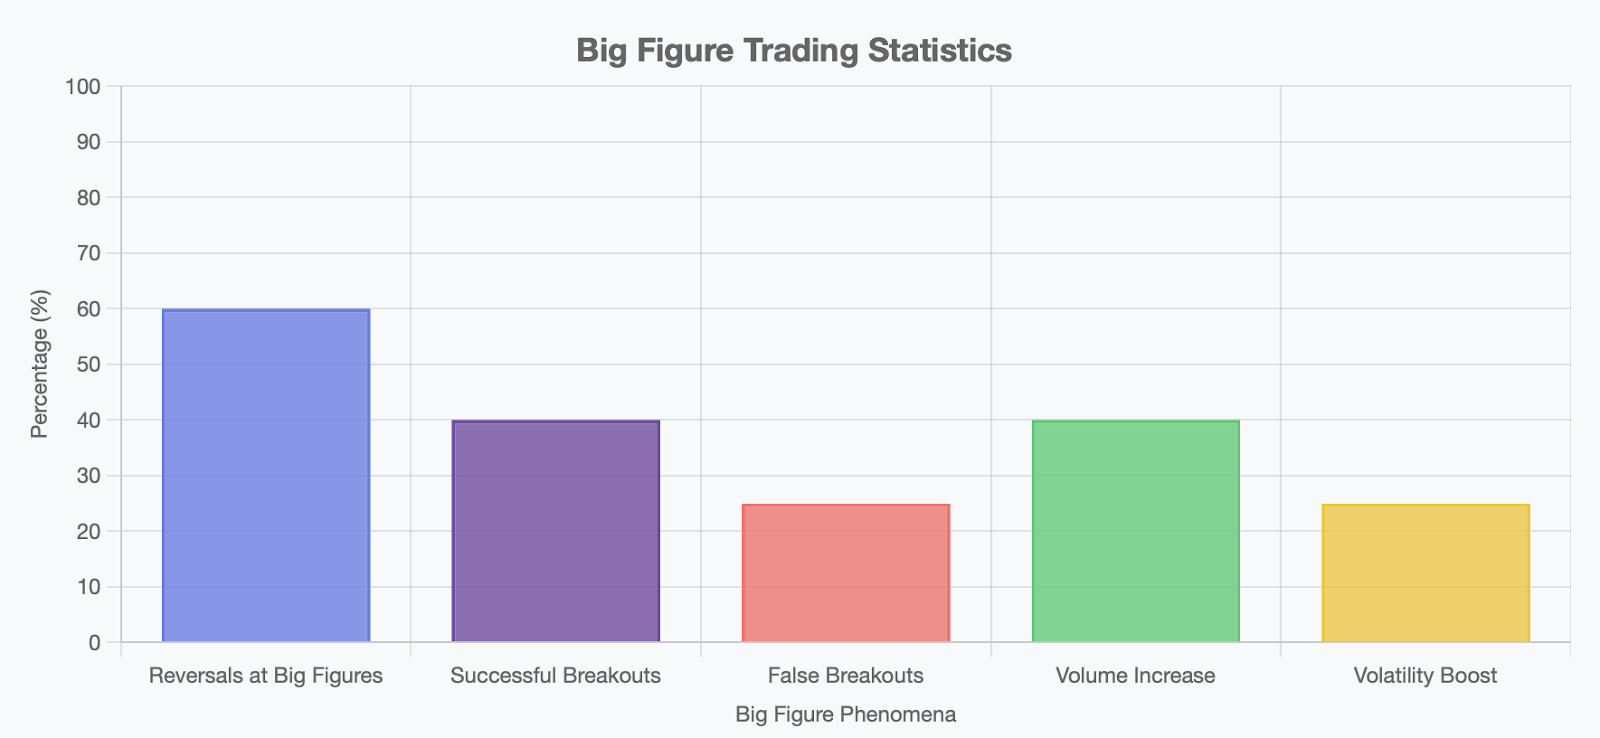
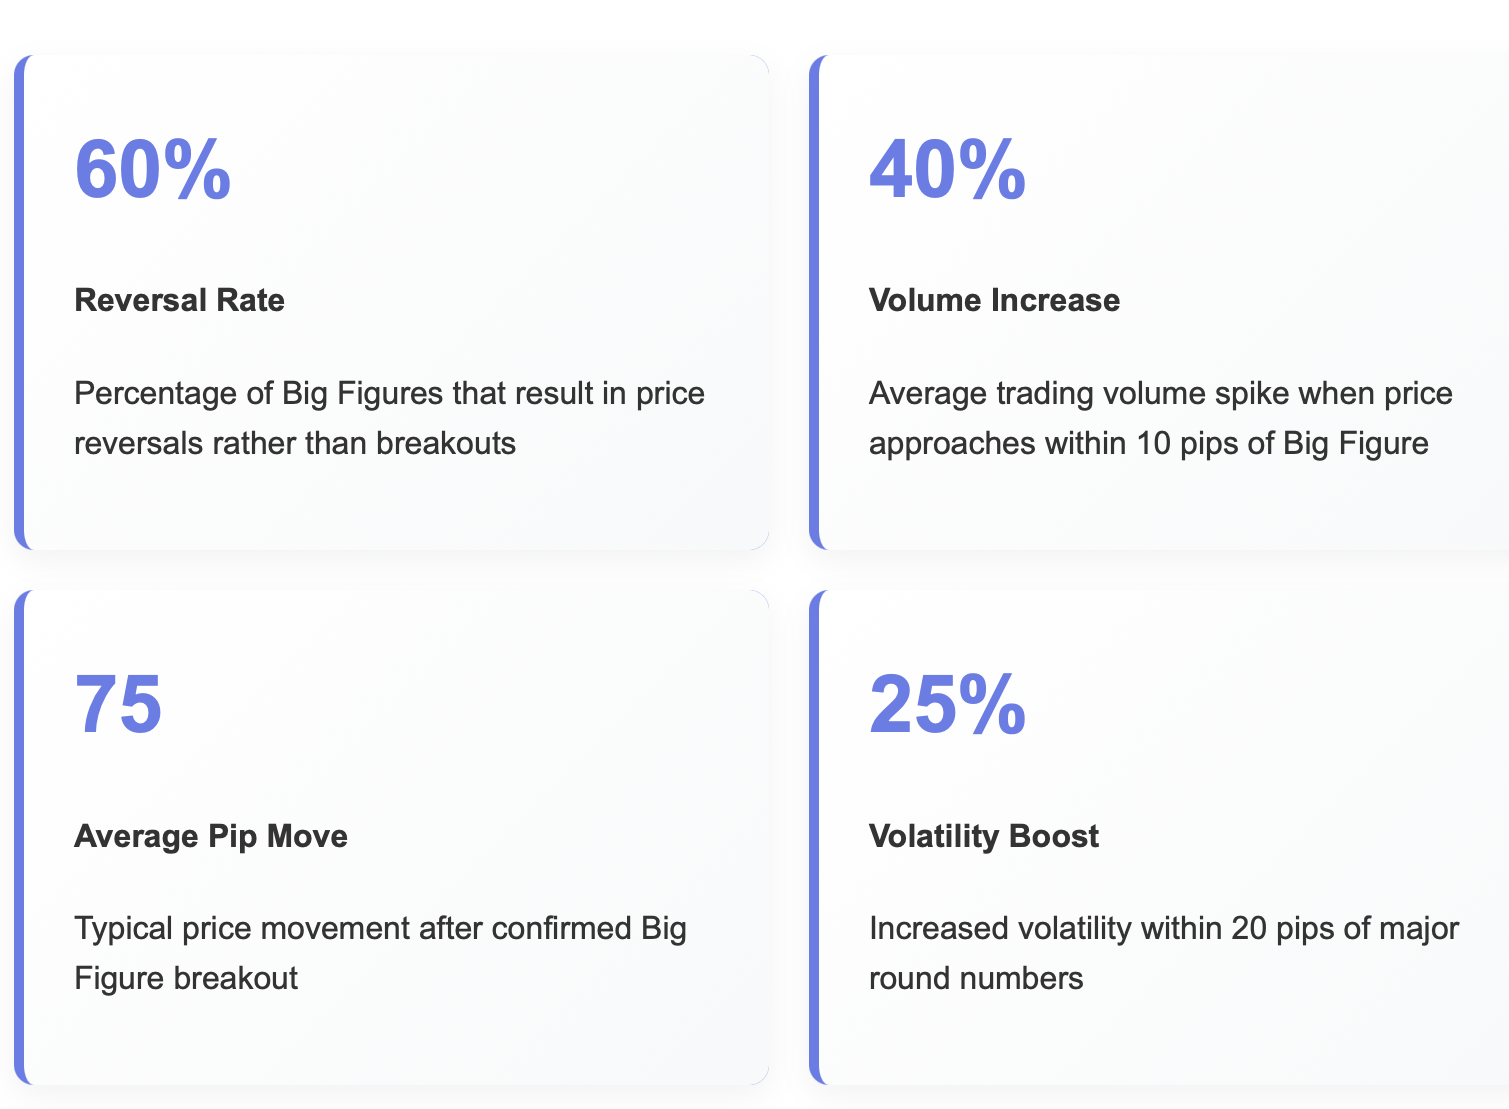
There have been varying results in breakout probability research. In fact, about 60 per cent of Big Figure strategies lead to reversals, rather than breaks. This means that it may be more beneficial to trade +/- within a range in relation to the higher levels.
When Big Figures do break, the follow through can be substantial. The average amount moved by a major currency pair after a confirmed break on a Big Figure can be anywhere from 50-80 would be triple this estimation (pips). Therefore, the evidence supports break trading strategies.
False breakout rates vary across currency pairs and when actually trading would result in false false break rate increases overall during periods of higher volatility.
Time of day analysis shows patterns by session-specific times when breaking Big Figures. London breaks on Big Figures have greater numbers of success versus any break attempts in the Asian session. US session reversals are quite common, though breakout quality of signals is higher than for examples of breaking Big Figures.
There are also bigger effects from the Option expiry effects at Big Figure levels, that are out of the hands of traders. Trading periods for the last monthly and quarterly expiry are even higher, as these expiry dates gravitate closer to major round numbers and provide for further augmented pressure on support and resistance levels for options trading.
Common Mistakes & Risk Management
There are particular risks when trading around Big Figures that traders should be aware of and manage in the correct way. Many positive trading strategies fell because they ignore these common mistakes.
The main error is treating all Big Figures the same. Not all round levels have the same psychological importance. For example, EUR/USD at 1.10 has a much bigger significance than EUR/USD at 1.13. Why? Because 1.10 is a big psychological number.
False breakouts are why many Big Figure trading accounts are blown up. Oftentimes, the price moves through the round number and then back down quickly. Many traders follow the price action without properly confirming and thus lose money all the time.
When traders use too much leverage surrounding Big Figures, their losses but the move will go against them, and with the position leverage - this leads to an even bigger whipsaw out. The volatility surrounding round numbers is often chaotic, while you increase your trading leverage to play the ultra short timeframe leading to a bigger price swing against you. Thus, careful size could potentially save your account in volatile price action.
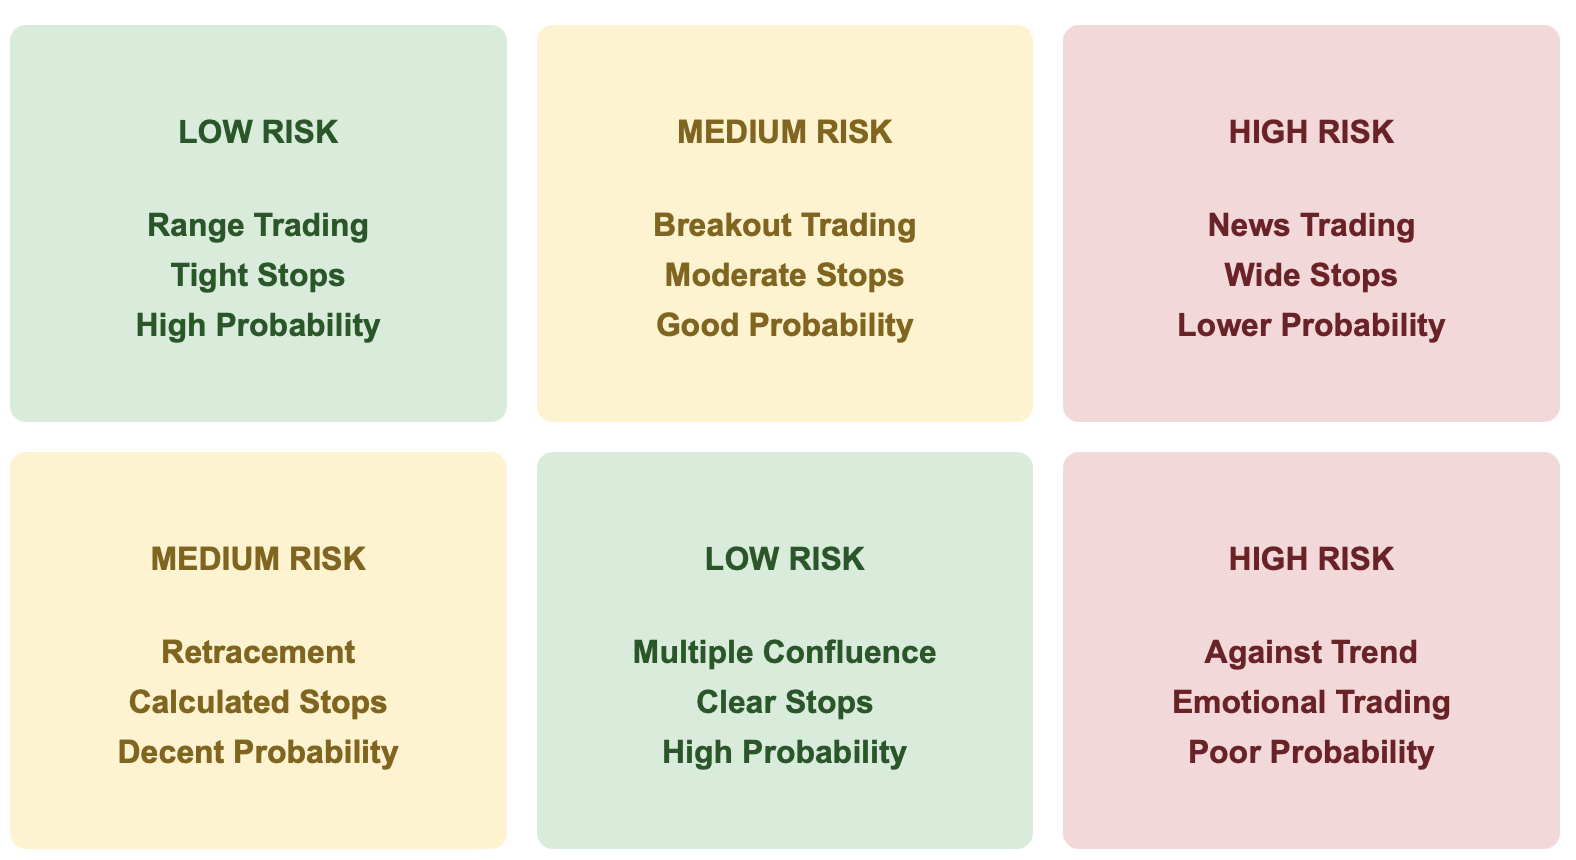
Trading Big Figures without larger context leads to bad trades. While you can often find a Big Figure as a potential resistance, you can be overwhelmed by a dominating trend with deep context. There is nothing to thin out the relative strength area when trading against a well-considered trend and contending breakout.
The placement of stops can become very important when price action trades into Big Figures. If you put your stop on the round number, you are inviting the big boys to manipulate you. Placing stop out a few pips past the threshold you have added time to manipulate you without triggering until the order is completed.
In terms of Big Figure trading, confirmation is vital for success in trading. Whether it is a confirmation in terms of a candlestick pattern, or confirming the price move via volume or momentum indicator, the price action must be confirmed prior to trading Big Figure retracements. The weight of doing some waiting just makes all the difference in terms of ultimate win rate.
Time-based risk management avoids Big Figure traps. Holding positions too long near round numbers increases risk of sharp, sudden reversals and using time-based exits helps manage the risk of extended consolidation in a trade.
Multiple position management strategies work well with Big Figure strategies. Traders can take partial profits at the Big Figure while letting runners continue, which encompasses both reversal and breakout scenarios.
Advanced Tips & Practical Application
Professional traders implement sophisticated techniques to optimize their Big Figure analysis. These Advanced strategies set apart the nagging novice trader to the successful trader.
Multiple Big Figure analysis is an improved timing tool. When faced with multiple round numbers in a single time frame, across multiple currency pairs, the psychological impact is greater. For example; USD strength at multiple Big Figures across the EUR/USD, GBP/USD, and AUD/USD creates stronger directional bias.
Fibonacci confluence in proximity to Big Figures also creates high probability setups. The information advantage doubles when a 61.8% retracement coincides with a Big Figure! Combinations of Fibonacci levels and round number support and resistance are powerful because they represent the dichotomy between the buying and selling side of the market and oftentimes due mark significant turning points.
Seasonal patterns established by retail trading behaviour also impact Big Figure round number dynamics. End of month and quarter-end institutional flow create artificial pressure near round numbers. Savvy traders understand the impact of seasonals on Big Figures and navigate flows accordingly.
Central banks intervene at significant levels. For example, years ago the Swiss National Bank would constantly intervene to defend the 1.20 level in EUR/CHF. The Bank of Japan repeatedly did so at levels referring to major round numbers as support and resistance in USD/JPY. When traders follow consistent patterns like these, and trade them, they have an edge.
Options barrier analysis can sometimes provide an insight to the hidden meaning of Big Figures. Large amounts of options at round numbers create some support and resistance. Professional traders watch options expiry calendars, as there may be large barriers at round numbers.
Using correlation analysis with currency pairs is a way to improve your trading using Big Figures. When EUR/USD is at 1.10, the behavior of GBP/USD at its Big Figures would also be important as confirmation of volatility. Correlation of movement adds to the level of confidence in directional trade.
Economic data releases and timing can create trading opportunities with Big Figures. Timed around major releases, especially NFP, can give wider ranges and bigger returns, particularly if there’s a round number e.g. EUR/USD at 1.0995, the potential for explosive moves to 1.10.
There are trading patterns related to Big Figures that exist in algorithmic trading methods. Many automated systems are programmed to trigger at specific round numbers. If the trader has a good understanding of these or similar patterns, he/she will have a better idea of which way price may move for a short time.
Learning Resources and Practice
To become proficient with trading Big Figures, you need to engage with Best practice tools and trading platforms. You cannot develop trading skills to be much more consistent or profitable simply by learning theoretical knowledge.
Demo trading platforms allow for risk-free Big Figure practice. MetaTrader 4 and 5 provide really good chart analysis tools to study round number actions. TradingView has fantastic charts for advanced Big Figure identification capabilities.
Analyzing historical data helps to identify Big Figure patterns more quickly. Analyzing the previous price action around major round numbers identifies patterns that tend to repeat over and over again. Successful traders will spend hours going back through their historical charts to analyze where they could profit and lose money for when they trade live.
Back-testing software helps to better evaluate any Big Figure systematic trading strategies. Professional platforms like Amibroker, and any Python-based solutions help quantify and data analytics any strategies or performance. Having the data to back-up and justify any trading decisions went a long way.
Economic calendars are helpful in identifying the best times for Big Figure trading as they are often around news events. Websites like Forex Factory and other calendars highlight the top/best economic releases for the week that would have an impact on round numbers. Timing can significantly impact your success rates.
Trading journals are a great tool, which will start to show any Big Figure consistent performances over time. Write down when you entered, exited and indicated what you were thinking, seeing, etc. Reviewing what you write down will expose your strengths and weaknesses. This kind of personal analysis greatly speeds up the learning process.
Community discussion and forums can be useful for good Big Figure trading ideas from other traders who have relevant experience. Websites like BabyPips or ForexFactory give the opportunity to see common discussions around round number strategies. Learning from the mistakes of other traders can save a lot of time and money.
Real-time market scanners can be a useful Big Figure trading tool as they can identify real-time opportunities across multiple Forex currency pairs. Scanners will give alerts on currency pairs reaching round numbers that you can set based upon a distance amount (e.g., X pips). If scanners automate some of the decision-making, this could give you an edge to capitalize on more Big Figure trades.
Mobile apps facilitate Big Figure tracking during the day. Traders are constantly reminded of opportunities with push notifications for round number approaches. This constant awareness allows you to execute trades with better timing.
Are you ready to master Big Figure trading and level up your forex skills? Then practice in your demo account now and join thousands of traders using these important psychological price levels to improve trading outcomes.
Disclaimer: The content of the blog does not represent any position of Trade W, does not serve as any trading-related decision advice, and does not endorse any third-party.