

 Trade W
What is Bullish Engulfing?
The Bullish Engulfing pattern is one of the most established candlestick patterns in forex trading. This single pattern consists of two candles that indicate falling prices are about to shift to rising prices. This happens when a sizeable green candle engulfs the body of the prior small-sized red candle.
Think of it in this example, a small wave is overtaken by a large powerful wave. The force of the larger wave has taken control and changed the direction of the water. This is what occurs when Bullish Engulfing is formed within the market.
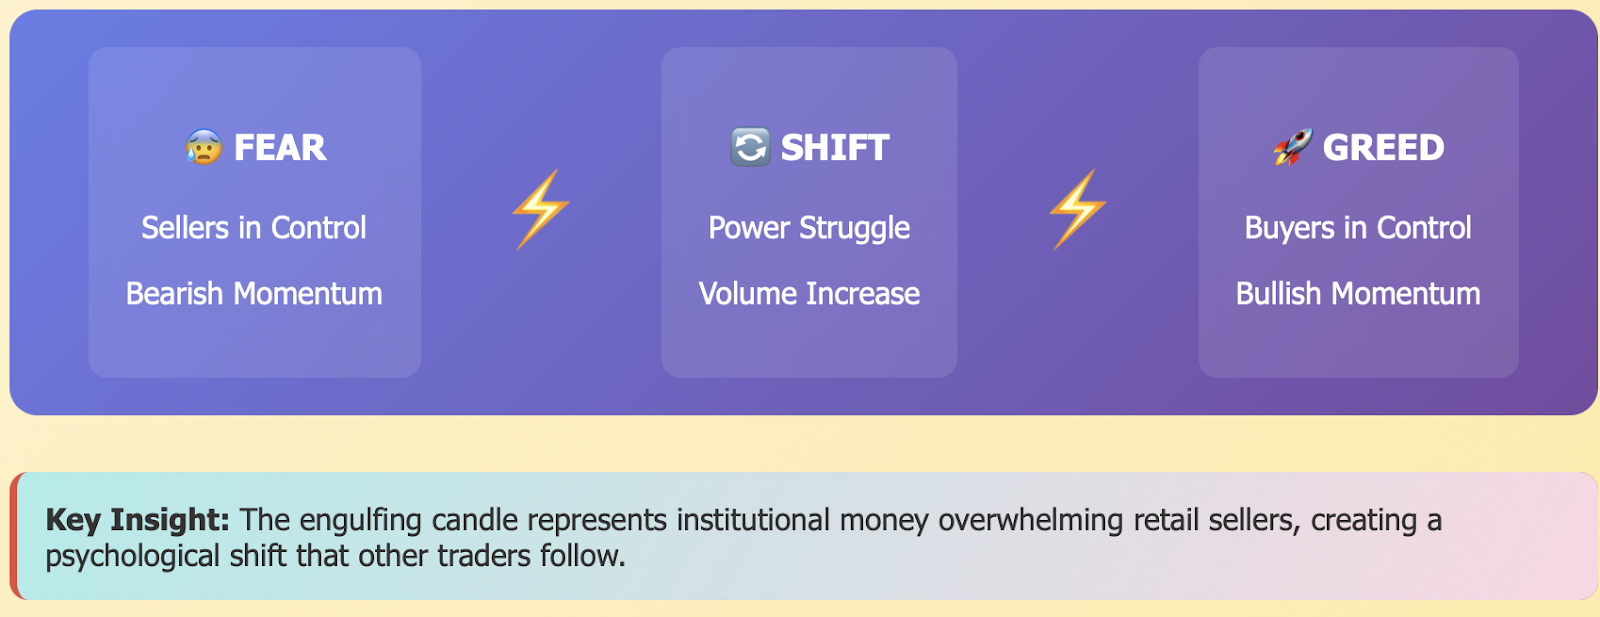
Many forex traders appreciate this pattern because the market psychology is clear. The first red candle indicates sellers were in control of the market. The second green candle was able to demonstrate buyers are now in control but at a much more powerful force. As they did so, the short sellers were forced to buy back their positions, adding to the profit potential often associated with a price reversal.
Bullish Engulfing pattern "signals" work best in trending markets. When prices have been falling for an extended period of time, Bullish Engulfing can signal a potential end of the bearish trend. Savvy traders will wait for this bullish signal to profit from a long position, often developing oversold conditions, and eventually a buying opportunity.
Professional traders regularly get Bullish Engulfing patterns formed with major currency pairs like EUR/USD. So when the EUR/USD trade has fallen and suddenly a Bullish Engulfing pattern forms, the probability is high, the euro is about to appreciate against the dollar. This is what savvy traders look for. There are many opportunities to profit when you have the ability to spot the bullish engulfing pattern on the chart.
The main factor in trading the Bullish Engulfing pattern, is to realize the Bullish Engulfing pattern is a sign of a psychological change in the trading market. Regardless of the candle shape, the candlestick pattern may give you hints in how buying pressure and selling pressure is changing and give you clues in how price is moving.
How to recognize a Bullish Engulfing Pattern
Misidentifying the Bullish Engulfing pattern can cause significant losses in a trader's trading account. The Bullish Engulfing pattern must meet clear and specific trade requirements that must be present for the Bullish Engulfing to be recognized.
First, the Bullish Engulfing pattern must occur after a downtrend. It is impossible to have a bullish reversal pattern without a prior downtrend to reverse. The downtred give the whole meaning to the pattern.
The bearish candle must be present as the first candle of the Bullish Engulfing pattern. This candle is the last push of the sellers prior t the buyers becoming in control. The candle does not need to be a large candle, however the candle must close below the open.
The second candle must be bullish (green) and its body has to completely engulf the body of the first candle. The green candle has to open lower than the close of the red candle, and then move up, to close higher than the open price of the red candle.
When looking at both candles, focus on the bodies only, not the wicks. The wicks can extend outside of each other as long as the real bodies show complete engulfment. This is an important distinction because the bodies actually indicate the price range where most of the actual trading occurred.
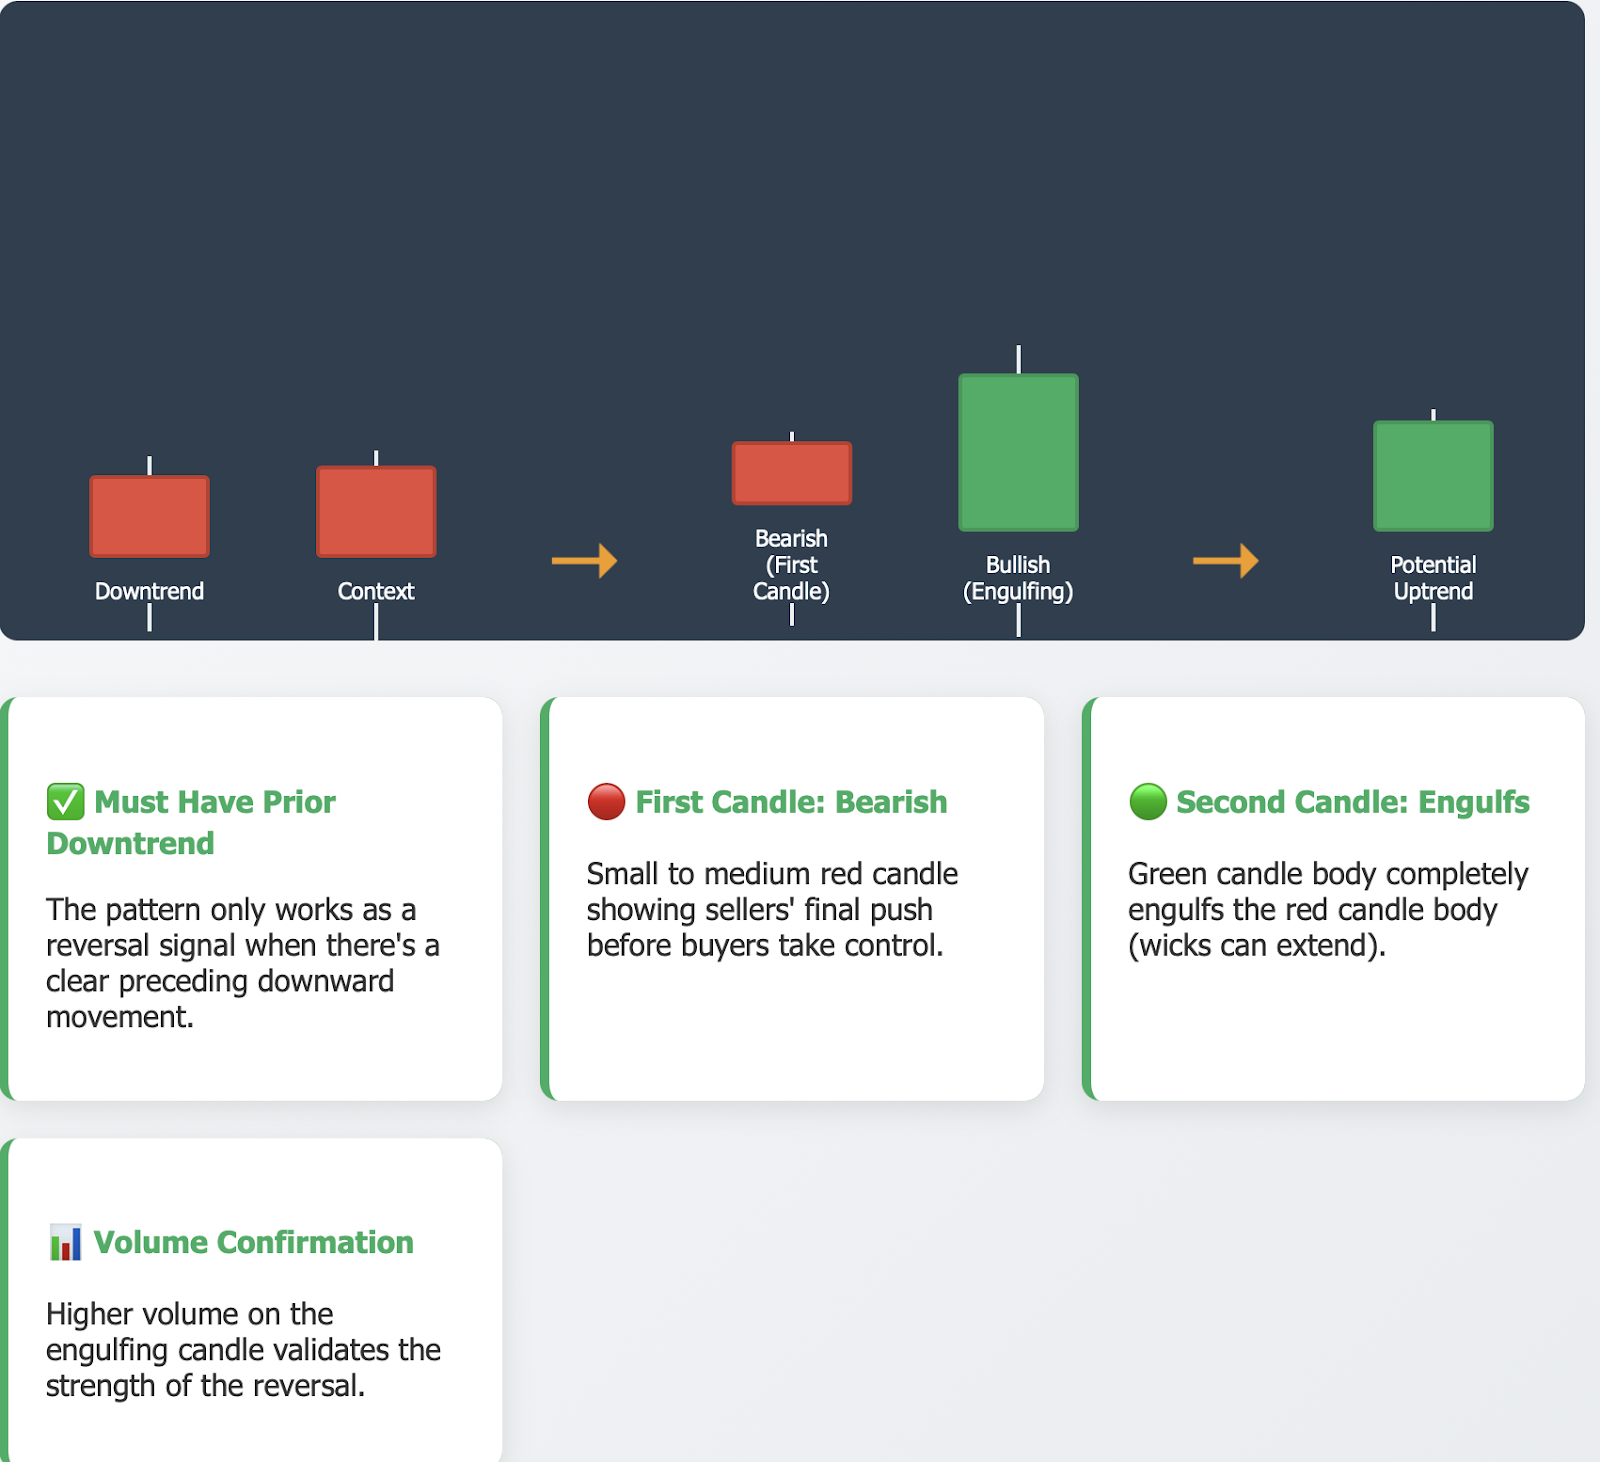
The strength of the pattern can be validated by adding volume confirmation. When the engulfing candle forms with higher trading volume, it simply tells the trader that more traders are participating in the reversal. The more traders competing for the active trade the increased chances there are of the pattern working.
Think of the second candle like a bigger player who completely pushes out the first player from the game. The bigger player has more strength and can take control.
You should be looking for the pattern on higher timeframes, like on the 4-hour or daily charts. Higher timeframes will allow you to filter out a lot of the market noise, giving you a more reliable signal. Don't forget a Bullish Engulfing on a daily carries WAY more weight than a Bullish Engulfing on a 5-min candle.
Never trade the pattern alone. Always consider the larger market context, the overall trend strength and the other technical elements surrounding your trading decision.
Psychological Meaning of Bullish Engulfing
Market psychology is very important for trader decisions, and bullish engulfing provides a clear example of the view and psyche of the traders involved in the process.
The first red candle represents who is in control of the momentum, sellers, and highlights the significance of the sellers in any bearish trend downwards. The bears made their conclusion the asset is being overvalued and are continuing to put further selling pressure, this represents the bearish emotion forming to drive the bearish trend lower.
The second green candle represents a humiliating shift in market momentum. Buyers entered the market with overwhelming force, taking control and absorbing all of the selling pressure by much higher prices than previously. You now have a complete difference of market emotion, with the bears shifting to bulls.
The volume variance really matters and it established the conviction of buyers over the sellers. The green candle is clearly larger than the red candle and this suggests buyers have much more conviction in purchasing the stock than the sellers did on the previous red candle. This imbalance often leads to continued movement upwards.
This psychological shift is often led by institutional traders. Large banks and hedge funds have enough capital to make it happen which means they drive the psychological shift and are able to create large price swings. When they decide to buy, they have orders large enough to easily hung up retail sellers into buying pressure, thus creating the engulfing pattern.
Imagine a basketball game. In the first quarter one team has the lead, but in the second quarter the other team comes out with great energy and annihilates the first team. The momentum has clearly shifted. You can feel it.
The pattern works because other traders are aware of this psychological shift. Once they see a clear Bullish Engulfing pattern, many of them are inclined to jump on that buying pressure as well. This creates a self-fulfilling prophecy that drives prices higher.
Fear and greed are also important. Sellers that used to have confidence now fear losing out on a gain. The buyers, who hesitated, are now longing to get involved in the new uptrend.
These psychological shifts fuel the price movement that comes after the pattern.
Market psychology is not random. Patterns like Bullish Engulfing repeat themselves as humans experience and react to market situations fairly consistently over time.
Trading Strategies Using Bullish Engulfing
Trading is about having a systematic approach. The Bullish Engulfing pattern can be utilized to set up successful and profitable trading strategies when used appropriately.
The basic entry method is to confirm. It's never wise to enter an order as soon as you see the engulfing candle. What you want to do is wait for the next candle to close above the high of the engulfing candle. Confirmation not only helps to reduce the chance of false signals but it increases successful trades.
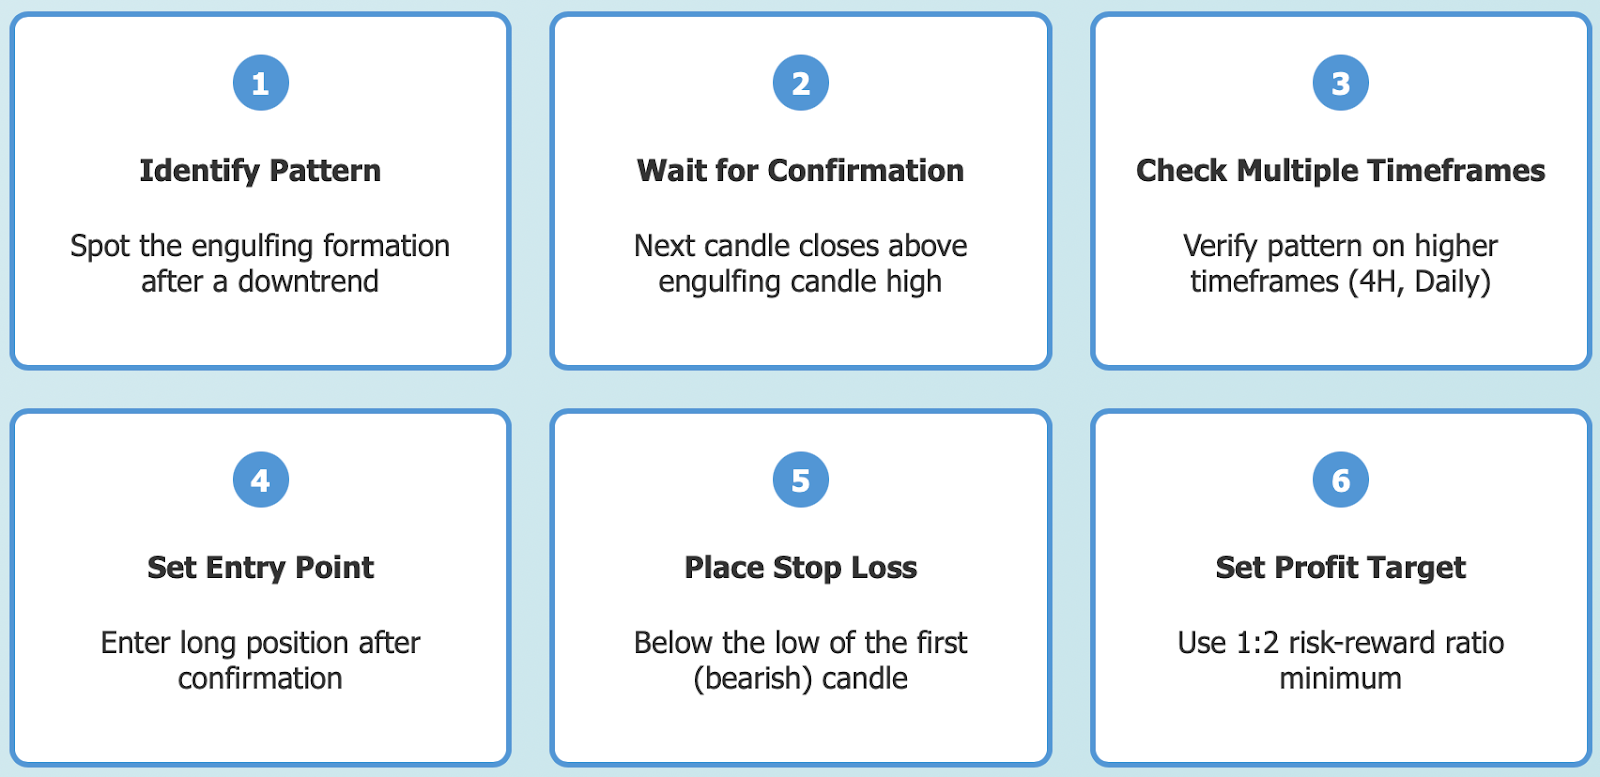
You should place your stop-loss below the low of the engulfed (first) candle. If the engulfing pattern fails and price continues to fall, you want to be protected. Remember that risk management is far more important than any opportunity in the trading arena.
When setting profit targets, you will want to use technical analysis. Look for resistance levels, prior highs, or you can use a risk-reward strategy of 1:2 at a minimum. If you risk $100, you want to try and target at least $200 in profit.
When using the engulfing pattern, combine it with moving averages to create stronger buy/sell signals. If a Bullish Engulfing is formed in close proximity to an important moving average (e.g. 200 EMA), the reversal signal is greater to be reliable since the moving average will provide dynamic support/strength for the engulfing pattern.
RSI Divergence will strengthen your analysis of the engulfing pattern. If the price makes lower lows (e.g. price is continuing to fall), and the RSI makes higher lows, and then a Bullish Engulfing pattern occurs, the combination will help generate a very strong buy signal.
Using multiple timeframe analysis will lead to improved results. You are seeing the pattern on a daily chart, and then you drill down to 4-hours or even lower to see exactly when the best value is to enter the trade. By doing it this way, you will get better entry prices than if you just entered immediately after seeing the pattern and you reduce your risk.
You can think of a pattern kind of like a green traffic light after being stuck at a long red light. You can clearly see the green light, but you still look both ways before proceeding. The same idea goes for trading.
Position sizing is equally as important as recognizing a pattern. Use no more than 2-3% of your account on any single trade, regardless of how much confidence you have in its pattern.
You need to invest the time in keeping a detailed record of all of your trades and also which setups worked best for consolidations in various market conditions. Over time, you will be able to improve your strategies with your trading data.
Pros and Cons of Bullish Engulfing
All trading methods have pros and cons to consider. Understanding this will help you to utilize the Bullish Engulfing pattern more effectively.
The Bullish Engulfing pattern is easy to recognize once you have an idea of what you are looking for. The pattern is visual so it is easy for a beginner to grasp but still has applications for a trader who practices advanced techniques. You don't need to do any calculations or use an indicator because of the simplicity of the formation.
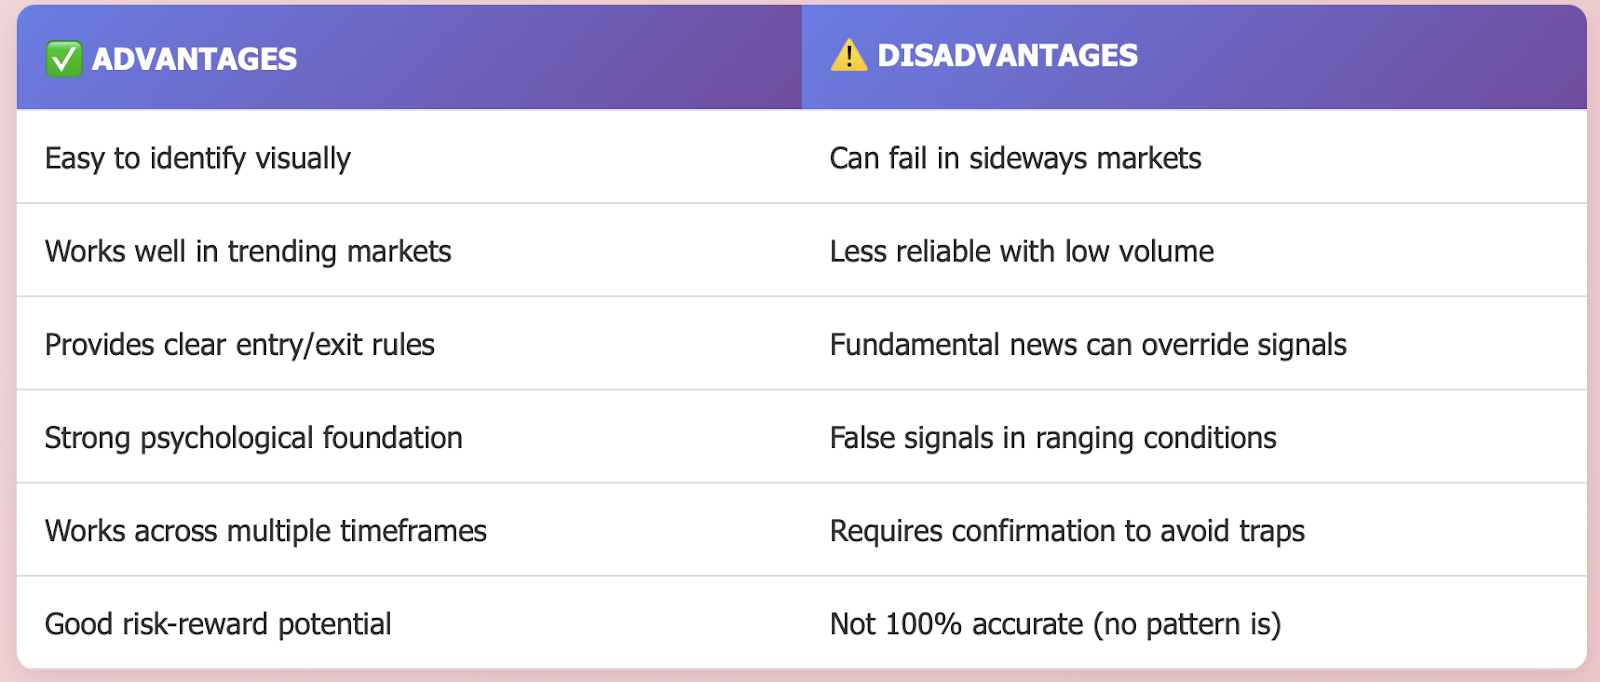
Bullish Engulfing patterns work great in trending markets. In a clearly defined downtrend, these patterns often act as good reversal signals. The stronger the downtrend, the stronger the reversal signal.
Bullish Engulfing patterns provide clear entry and exit rules. You know exactly where you will enter the market, where you will set stops, and how you will manage the trade. This clarity helps cut down emotional trading decisions.
Multiple time frames showing the same pattern adds confluence. When you see a Bullish Engulfing pattern on both a daily and a 4-hour timeframe, the trade set-up is much stronger.
The patterns can fail in sideways markets. When price is moving sideways between a range without any clear market direction, engulfing patterns can and often do create false signals. Always verify if a real trend exists prior to attempting to trade an engulfing pattern.
Changes created when low volume conditions do occur, can cause engulfing patterns to lose their reliability. If there are only a handful of participants in the market, it is much less likely that price action is indicating any real change to existing market sentiment. You should always look for volume indicators to accompany engulfing patterns when trading.
Both fundamental factors and market news can supersede technical trading patterns. Economic announcements or ongoing geopolitical events can and frequently do lead to price movement against technical analysis. As a trader, you should always be mindful of any influencing fundamental factors when developing or implementing your analysis.
The pattern is like a weather forecast - typically reliable, but not always accurate. Professional meteorologists have a strong reputation for being correct, but they too have occasionally been surprised when storms formed out of nowhere.
Trade signals derived from higher timeframes are typically more reliable than signals derived from lower timeframes. A Bullish Engulfing formation on a weekly chart means much more than one on a 15-minute chart. Longer timeframes have more opportunity for accuracy.
No pattern is guaranteed to work 100% of the time. Even the most reliable technical formations will fail occasionally. This is the reason for the necessity of confirmation and risk management as part of any trading strategy.
Real World Instances of A Bullish Engulfing
Real world instances of the Bullish Engulfing pattern illustrate how it performs in actual physical market conditions. These instances also include both successful trades and difficult, but often enlightening, lessons.
The financial crisis in 2008-2009 provided tremendous Bullish Engulfing opportunities. After months of falling prices, the S&P 500 and other major indices provided clear engulfs in price charts which were ultimately the beginning to multi-year bull markets. Traders that saw these were able to make many times their expected returns.
The COVID 19 market crash during March 2020 had similar opportunities. Many currency pairs started to show Bullish Engulfing patterns just as central banks announced stimulus, some of which were unprecedented. For example, EUR/USD had a clear engulfing formation prior to a sustained multi-month upward movement.
GBP/USD shows us great instances of the pattern in action. Following Brexit, this pair has many instances of Bullish Engulfing patterns forming at crucial support levels and would often lead to short-term tactical reversal points that skilled traders were able to utilize.
USD/JPY gives a sense of how the pattern acts in different market dynamics. USD/JPY often creates Bullish Engulfing during risk on environments, when investors and traders move out of safe haven assets like the Japanese yen.
A beginner trader trading a demo account could experiment with these patterns. Starting off small, even in virtual trades, will help new traders learn and feel more comfortable without risking money. Many traders have gotten their start this way.
In 2016, the US election outcomes led to dramatic moves in the market. There were several currency pair engulfing patterns as traders readjusted based on a surprising election outcome. All these patterns showed significant trend changes.
I also see the gold markets showing clear engulfing patterns. Especially when there is uncertainty in the economy, gold often shows these patterns at the most crucial technical levels. The engulfing patterns work across many asset classes, including Forex pairs.
Oil price moves often show engulfing patterns at important supply or demand shocks. The 2020 oil price collapse and subsequent recovery demonstrated multiple engulfing patterns to mark important changes in direction.
These examples in the real world have proven Bullsih Engulfng patterns consistently work in different markets, timeframes, and economic conditions. The most important point is to recognize the pattern and then follow trading rules.
Practical Advice and Mistakes to Avoid
Learning from the mistakes made by other traders can save you time and money. These pieces of practical advice will help you to avoid many common mistakes when it comes to trading Bullish Engulfing Patterns.
Wait for confirmation before placing your trades. I can't tell you how many beginners will see an engulfing candle forming on the chart and will put in buy orders, without waiting for confirmation, in a complete rush to get into the trade. I can tell you that rushing into a pattern almost exclusively ends in a loss when the engulfing pattern fails to follow through.
Make sure that you use proper position sizing, regardless of the specific strength of the specific pattern. Even the strongest Bullish Engulfing setup can fail, so never risk more than you can personally afford to lose. The best traders always protect their capital before chasing profits.
Check multiple timeframes before acting on any pattern doing your analysis. Just because a pattern looks perfect and offers the best trade in one timeframe, doesn't mean it will do the same in other timeframes. They may have conflicting signals for you, and it is best to check more than one timeframe to prevent a good number of losing trades.
Do not trade the pattern when there is little volume. Volume can often appear as if. There can be a lot of activity or movement in a thin market but that doesn't necessarily mean there is real buying pressure to go long the trade. Always wait for a good hour of content buying and for active trading sessions when volume is healthy.
Don’t overlook necessary components that could impact your price movement. A perfect technical pattern is worthless if it is about to be significantly impacted by economic news. Be sure to check the economic calendar before you enter any trades.
Do not chase trades after the pattern has moved significantly. If you missed the original entry, wait for the next entry instead of entering late. Part of the discipline of trading is patience.
You need to keep a detailed trading journal to assess your results with each pattern. Document the market conditions that favored your patterns and the market conditions you want to avoid. This information will greatly enhance your decision making, over time.
When you identify multiple patterns at once, remain conscious of overtrading. Keep in mind that, in trading, quality is always better than quantity. Especially since it is one thing to take one trade with a high probability and it is another to take multiple trades with marginal probabilities.
Think about your trades similarly to how you would think about playing chess, you need to be able to see more than one or two moves ahead of the current pattern. You must think about what could happen after you enter the trade and not just what your signals are telling you to do right now.
Always be aware of your emotions and don’t allow them to conflict with your trading plan and rules. FOMO (fear of missing out) leads you to bad entries or chases, while FOL (fear of loss) will lead you to exit your positions too decisively. You must stay disciplined and stick to your predetermined plan regardless of the manner you are feeling.
In the risk-free environment of a demo account, you can develop your skills and strategies without having to worry about real money. This is a valuable opportunity to learn and build your skills and confidence without the added mental strain of risk. Most successful traders have spent a considerable amount of time live trading, and then transitioning their strategies (and often market psychology) to real money live trading after practicing live in demo accounts.
Try to learn from your winning and losing trades, as often losses can provide the best lessons. The key is to reflect on what you did wrong, and to adapt your practices moving forward.
Key Takeaways to Successful Trading
The Bullish Engulfing pattern can be a great resource for forex traders if it used correctly in your trading strategy and overall approach! After properly recognizing this two candle formation, you can observe the possibility of trend reversal by attracting sellers and creating buying pressure.
To properly identify the Bullish Engulfing pattern, certain criteria must be met and correctly observed within market price action. To meet the criteria for the Bullish Engulfing pattern to be valid and useful, you must have identified the presence of a downtrend, a bearish first candle, and a bullish second candle that completely engulfs the bear candle.
Each of these elements must be properly identified for validity of this pattern to be established.
Market psychology drives the Bullish Engulfing pattern. The engulfing candle shows the buyer overwhelming selling pressure and results in momentum that often continues and drives a top-down trading decision to long.
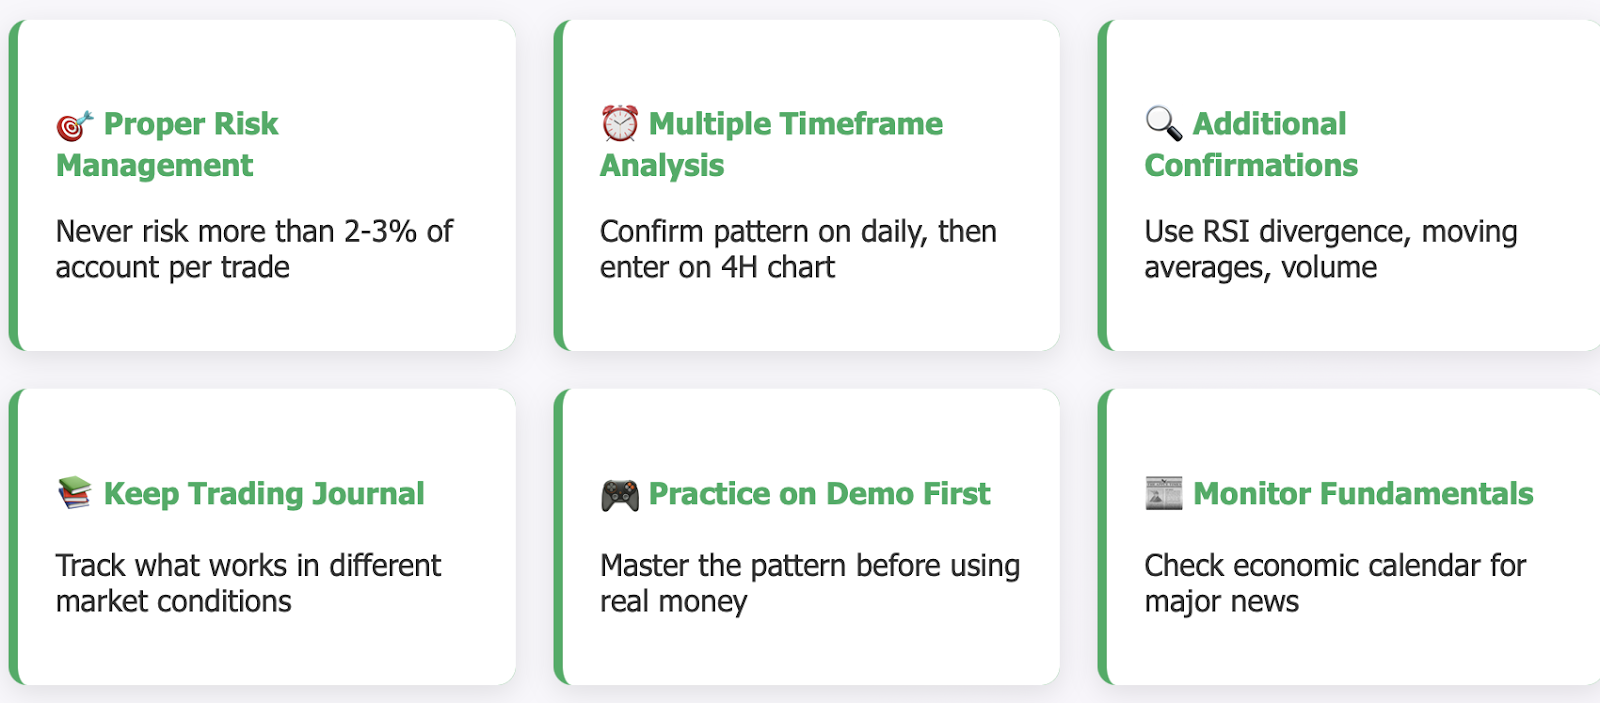
Identifying market psychology will help shape your trading decision for bullish opportunities. Successful and effective trading strategies will combine patterns with other technical tools of analysis to achieve a better success rate. Technical tools include moving averages, RSI, volume, and playlists of multiple time frames of analysis, signals from patterns should never be analyzed exclusively on their own.
The pattern has obvious benefits, such as ease in identification and strict entry rules. Disadvantages include false signals in ranging markets and reduced impact temporarily due to reduced volume.
Examples from major market events and their outcomes demonstrate the historical effectiveness of the pattern. Historic behaviour indicates the Bullish Engulfing pattern of price action consistently marked the start of major turning points during major financial crises and subsequently marked the change in trend on the recovery out of economic congestion.
Mistakes in trading include jumping the gun and executing positions without confirmation, not recognizing the market context, and a lack of risk management. Making these mistakes and not following a rule set will yield lost interest across your trading account and the importance of avoiding these mistakes will enhance overall results.
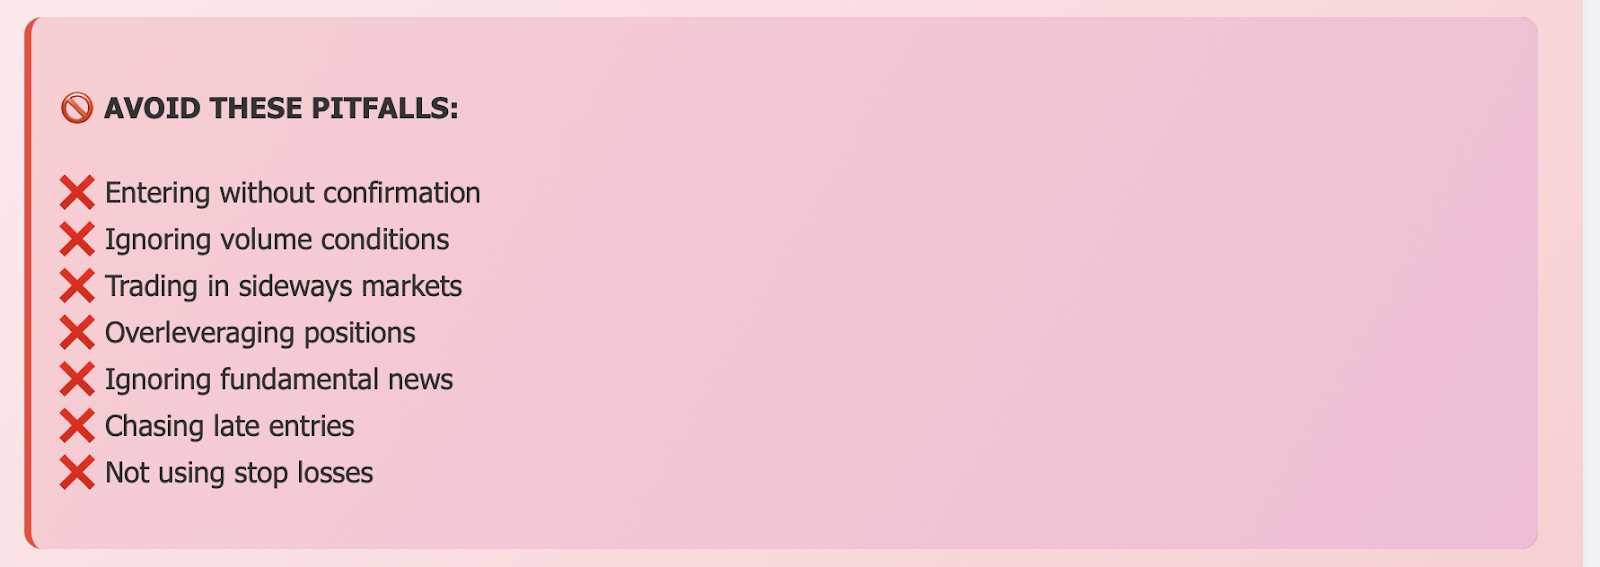
Good risk management is still more paramount than pattern recognition. Good position sizing that incorporates your account risk, stop losses, and profit targets give you the best protection for your capital and capacity to achieve profitability over the long term.
Using practice accounts is a great way to develop your skills without risk (finances) until you have mastered your strategy. The Bullish Engulfing pattern is no different in lifelike practice you must learn to MASTER it before trading it with your money.
The pattern works best when included as part of a full trading system rather than a stand-alone signal. The Bullish Engulfing Pattern works best because you are mixing technical analysis, market fundamentals, and disciplined execution.
Always be learning and adjusting your trading process based on the markets. The markets are forever changing and good traders are always improving their trading talent/skill level.
Ultimately, no trading pattern is a certainty. The Bullish Engulfing Pattern is a probability based tool that produces more wins than losses when all things are considered. Stop trying to predict whether the market will end at a certain price level and instead focus on making a good trading decision.
Disclaimer: The content of the blog does not represent any position of Trade W, does not serve as any trading-related decision advice, and does not endorse any third-party.