

 Trade W

While most charts indicate a stable market environment, the megaphone provides an indication that the marketplace is in disarray, and this is considered an advantage for trading.
Also known as a broadening formation, the megaphone develops when there is a simultaneous occurrence of higher highs and lower lows, creating an expanded outward shape similar to that of a megaphone bell. The megaphone pattern also provides information regarding momentum and direction.
There are many emotional and chaotic markets, as well as many retail traders who will not understand the megaphone pattern; however, those who are familiar with this pattern can identify it as providing some of the most precise technical analysis-based entries available.
You will find this formation across forex, cryptocurrency and equity markets. As it relates to the currency markets, the megaphone pattern is more common with volatility resulting from macroeconomic events (e.g., Federal Open Market Committee meetings), spikes in volatility resulting from the cryptocurrency market, and at the top of both cryptocurrency and equity markets.
What is a Megaphone Pattern?
A megaphone pattern or broadening formation is a type of technical chart formation consisting of higher highs and lower lows, generally expanding in total size over time. The broader megaphone pattern indicates greater volatility in the market, as well as emotional imbalance or pricing pressure. A broadening formation is typically formed before an important reversal or continuation price move. The existence of megaphone or broadening formations can be observed in forex, cryptocurrencies, and stock markets.
Structure and Characteristics
A megaphone cannot be accidentally formed. The formation of the megaphone requires a minimum of three identified higher highs (HHs) and three identified lower lows (LLs); each price movement goes beyond the previous price swing high or price swing low. The upper and lower trend lines are diverging away from one another, which is the primary visual indication of this pattern.
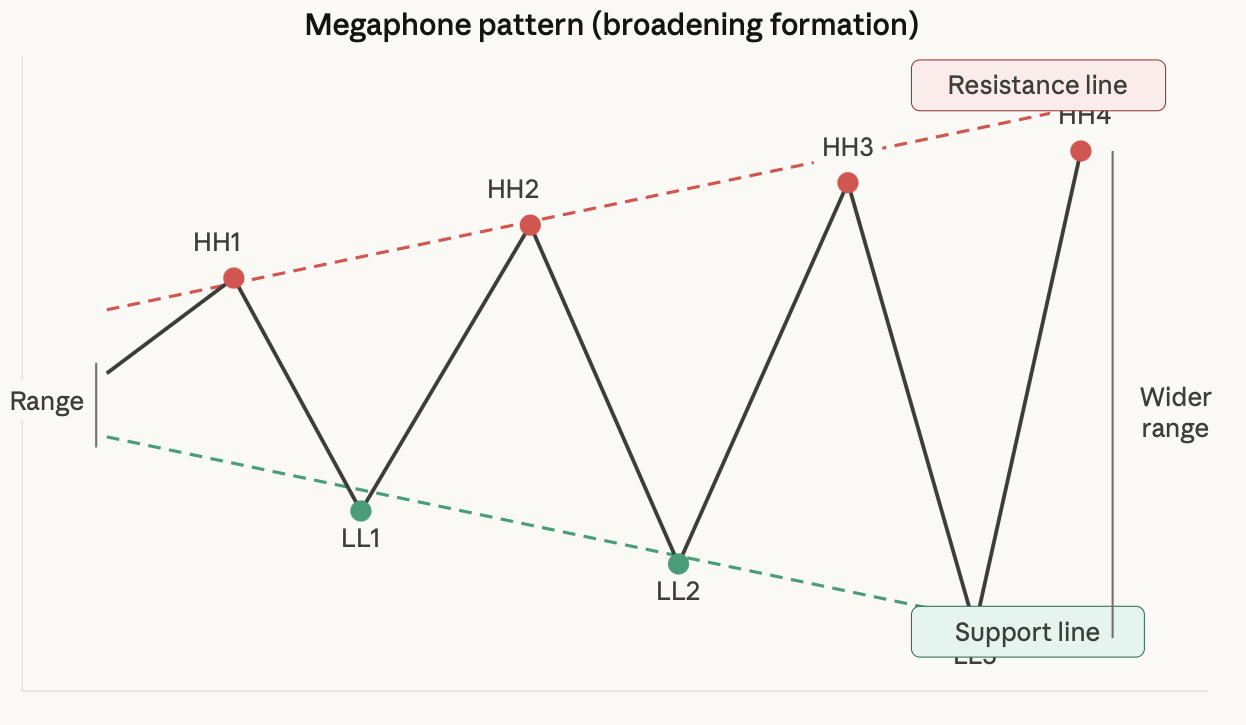
Imagine a triangle that creates a "compression" or tight price range to build solid price movement. A megaphone creates an opposite effect by "releasing" the energy created from price movements and swinging further apart each time there is a price movement.
Because of these different effects, the trading implications are very different as well. In a triangle pattern, traders remain on the sidelines and establish trades after the breakout occurs. In a megaphone pattern, traders look for an opportunity to establish trades "on the edges".
Megaphone vs. Triangle: Why the Difference Matters
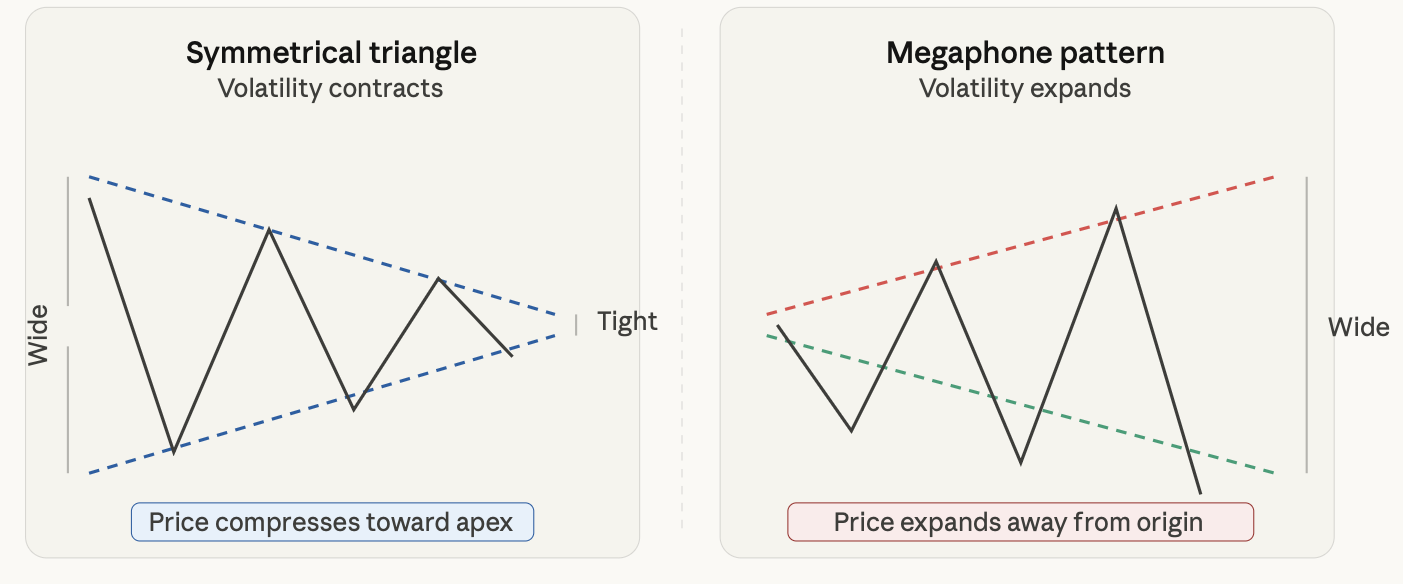
The key distinction: a triangle is about patience, waiting for compression to resolve. A megaphone is about precision, identifying where the edges are and fading them with confirmation.
Why the Megaphone Pattern Forms: Market Psychology
Here’s what most traders don’t understand - when you’re looking at a trader’s megaphone, it isn’t just random chaos. It is organised chaos caused primarily by the actions of institutions.
When institutions want to accumulate or distribute a large position without a large swing in price, they need liquidity from both sides of the transaction. So they raise the price to encourage people to participate in the FOMO buying, then sell sharply to trigger stop loss orders and panic selling. They repeat this cycle at increasingly higher or lower levels.
That’s how the megaphone takes shape. As the price continues to rise and create higher highs, it attracts retail traders to buy the breakout, and as the price moves down and creates lower lows, retail traders get shaken out, and their stop losses get harvested. The institutions use both the top and bottom of the megaphone as an ATM.
The name of this concept in institutional trading is called "dual-sided liquidity harvesting." The pattern literally shows you where those liquidity pools are in relation to the extreme highs and lows of the price.
Therefore, for retail traders, the key takeaway here is to never trade in the middle of the megaphone. You want to take your trades at the extremes of a megaphone because that’s where you are most likely to make a profit. The middle is where most traders get cut to pieces.
How to Identify a Valid Megaphone Pattern
Not every expanding price action is a megaphone. Here's what separates a real pattern from noise:
Essential Requirements:
-
A minimum of three higher highs (HH) and three lower lows
-
Two trendlines that are clearly going in opposite directions (one upward sloped and one downward sloped)
-
Each swing must have palpably exceeded the previous swing by a significant margin.
-
True expanding volatility that can be tracked using ATR and the size of the candle body.
Common Trader Mistakes:
-
Calling it a megaphone when it only contains two swings – you require more than 2 to build out your megaphone structure.
-
Confusing it with a wide-range Channel (parallel lines are a channel, whereas an upwards-directed trend line, along with a downward-directed trend line, together create the opposite of the megaphone).
-
Drawing your two trend lines too loosely – capturing random noise instead of properly defined pivot points.
A good, solid rule of thumb is that if you need to squint to see what you believe to be the pattern, more than likely, it does not exist. The best megaphones can be seen very clearly on a clean chart.
Complete Trading Strategy: Entry, Stop Loss, Take Profit
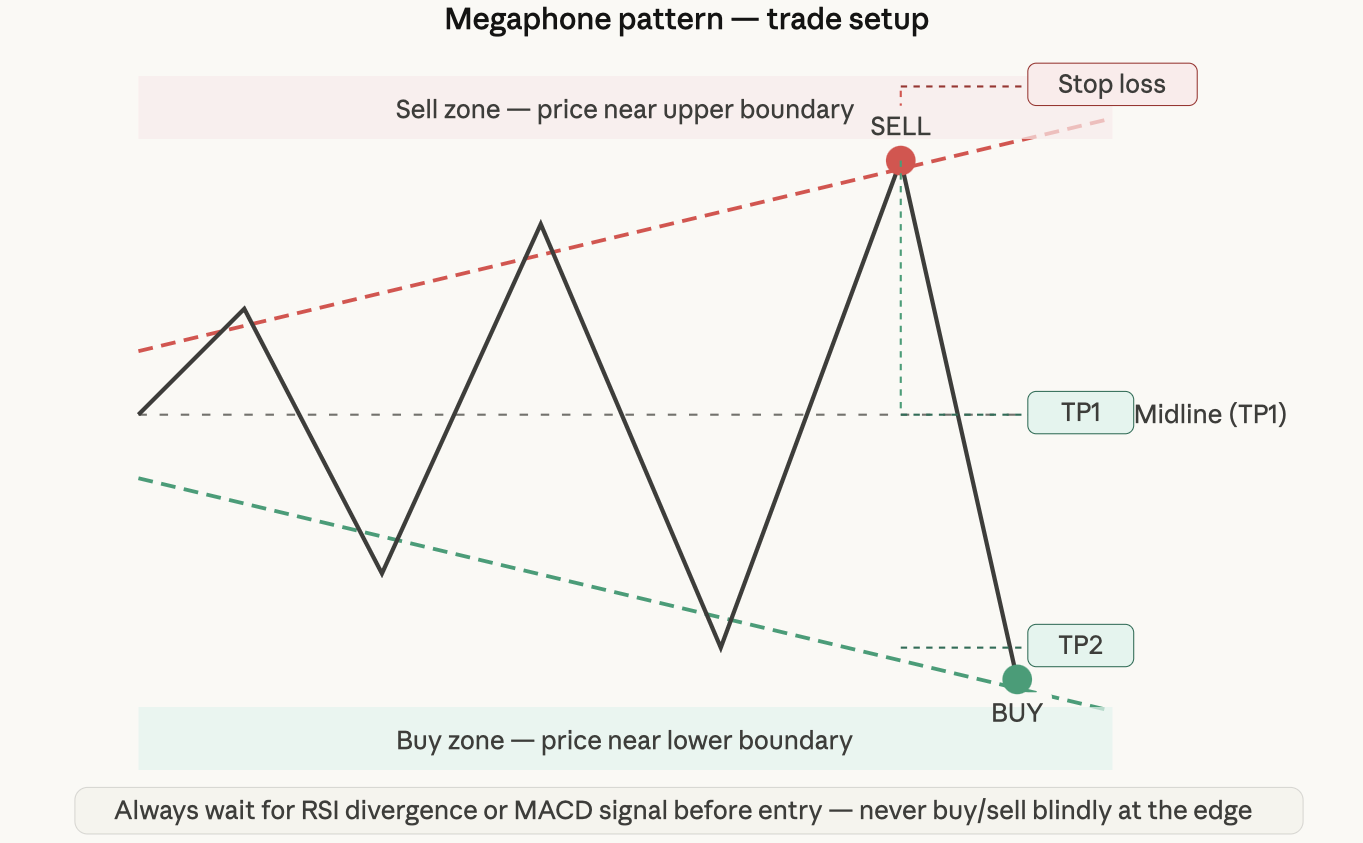
While the method to be followed is simple, the execution is not.
Sell Setups (upper limit): In instances where price is touching or nearing the upper end of an uptrend, we will wait for confirmation with either bearish RSI divergence or MACD bearish cross before entering into shorts with a stop loss above the structure. The plan here will be to take some profits (TP1) at the midpoint in terms of price and to hold onto the remainder for a longer-term target (TP2), which will be the lower trend of the price channel.
Buy Setups (lower limit): We follow the same reasoning, except we are hunting to buy with confirmation of either bullish divergence or a momentum shift before we enter long on price. Don't buy because "it's near the bottom." Megaphones develop, meaning the price may continue to go down further.
Risk Management: 1–2% risk on every trade; the volatility associated with megaphones is very high, so we will need to downsize our position size in relation to the average true range. As a rule, targets should lay out with something like a minimum of 2:1 reward to risk, starting with your TP2 target at the opposite side. Most times, the TP2 target may be in the range of a 3:1 or better.
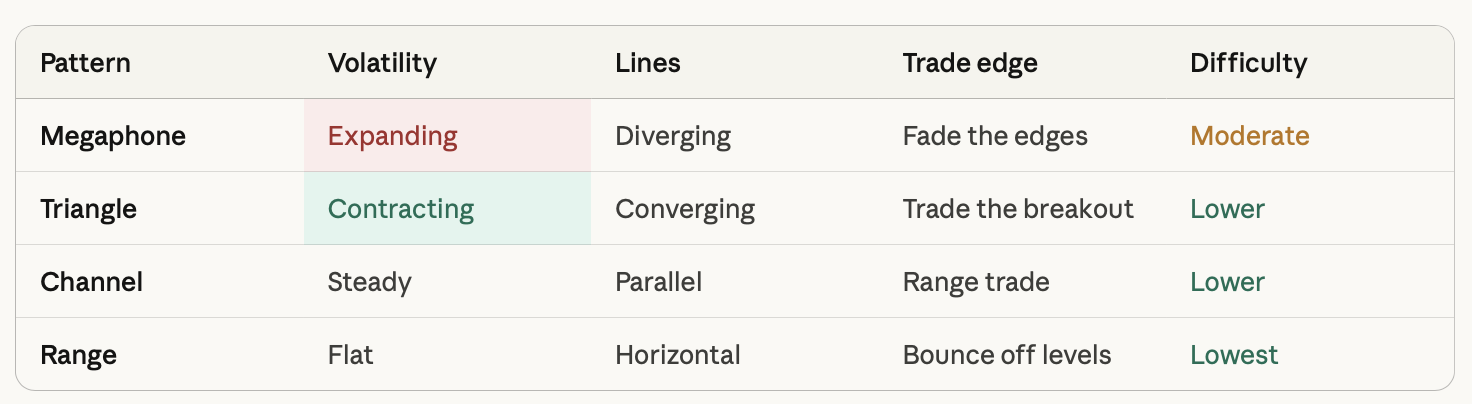
Pattern Comparison at a Glance
How It Behaves Across Different Markets
The megaphone shape appears in multiple financial instruments, but each market has its own unique characteristics.
In Forex markets, we traditionally see this pattern developing around large economic events such as interest rate decisions from the Fed, NFP reports, and political news. In the case of the EUR/USD and GBP/USD, we typically see broadening formations develop during times of uncertainty regarding monetary policy. Although the swings are relatively orderly, they can also be explosive during the course of one trading day.
When we look at cryptocurrencies, we can clearly see that the pattern has developed with extreme force and volatility. The 2021 bull cycle peak of Bitcoin provides an excellent example of this, as we have seen a series of consecutive swings develop for a period of several months, with each swing demonstrating a level of price move that exceeded the previous swing, and eventually culminating in a sharp and decisive downward price move.
Volatility in cryptocurrencies has the tendency to result in broader megaphone formations, quicker swings, and more false breakouts than in other markets.
Megaphone formations also tend to develop during the earnings season and periods of overall uncertainty in the macroeconomic environment within stock indices such as the NASDAQ. These patterns frequently mark distribution zones where large institutional investors offload positions to retail investors.
The megaphone formation in gold is also representative of true uncertainty, as we see conflicting pressures from safe-haven buying and risk-aversion selling during periods of geopolitical stress. This generates the large, emotionally charged swing moves of the pattern.
Advanced Technique: Using RSI and MACD With the Pattern
Megaphone trading is half-blind. The difference between successful and unsuccessful trades is in using structural analysis along with momentum indicators.
RSI divergence is the best confirmation tool you have. When the price makes a new higher high in the upper boundary of the megaphone, but the RSI makes a lower high, it shows that momentum is weakening and is the perfect time to go short. Similarly, as the price makes a lower low in the lower boundary of the megaphone, if the RSI makes a higher low, it shows that there is bullish momentum arriving and is the perfect time for a bounce.
The MACD gives you an additional confirmation for timing. When you get a bearish MACD crossover near the upper trendline of the megaphone, along with an RSI divergence, it provides you with confirmation from two independent sources. One of them has provided a coincidence, and the other is now a setup.
Multi-timeframe confirmations are critical in megaphone trading: If the 4-hour chart shows a megaphone, check the daily chart for the overall trend. A megaphone at a key level of daily resistance would carry much more significance than a megaphone at non-significant levels.
The order to follow is: first, determine if the structure of the megaphone pattern is validated by the price; next, if there is momentum signalling that a reversal is occurring from the RSI divergence; and finally, if timing is confirmed by a MACD crossover. Only after you find confirmation from all three of these sources should you take a position.
When Not to Trade This Pattern
Recognising when to pass is a true skill. Here are specific examples when the megaphone is no longer valid:
If volatility decreases regardless of the pattern's expansion, the pattern is invalid. When the ATR is declining, while prices are swinging widely from one side of the ATR to the other, this is a sign that these large price swings were simply noise.
The odds of the edges remaining intact decrease dramatically when the pattern of the megaphone occurs within an established trend; Megaphones in a trending market break in the direction of the trend.
Low liquidity sessions have volume unrepresentative of true institutional behaviour. The Asian session for Forex is an example, as is pre-market trading for stocks.
Trading Checklist
Before you take any megaphone trade, run through this:
-
At least 3 higher highs and 3 lower lows confirmed
-
Both trendlines are clearly diverging (not parallel)
-
RSI divergence is present at the entry boundary
-
MACD crossover aligned with trade direction
-
Stop loss placed outside the structure boundary
-
Position size at 1–2% account risk max
-
Reward-to-risk ratio of at least 2:1 to midline target
-
Higher timeframe not in a strong opposing trend
If any item is missing, wait for the next setup. The pattern repeats; your edge doesn't evaporate if you skip one trade.
5 Mistakes That Blow Up Megaphone Trades
The major errors that cause the majority of losses in this pattern consist of five major types:
1. Trading without confirmation is the biggest. A price hitting the upper boundary does not confirm a sell signal on its own. Trading without divergence or momentum shift is a guess; making that guess over the depths of strong trend moves can get very costly, very quickly.
2. Ignoring the overall market context and just trading the pattern destroys your edge. The megaphone pattern will most likely reverse back toward where it came from, rather than break out if the overall market is significantly trending.
3. Overtrading every swing inside the structure will progressively deplete your account. Not every bounce within a megaphone will be a valid trade; trade only the edge.
4. Moving your stop loss to "give the trade more room" is considered revenge trading. If you placed the stop loss appropriately based on the overall structure, stick to the stop loss.
5. Doubling down on losing trades inside the megaphone pattern is particularly dangerous, as that pattern will have the next swing be significantly wider. A position that is already wrong will continue to deteriorate and accelerate in that direction in relation to the depth of the price swing.
FAQ
Is the megaphone pattern reliable? It's reliable when combined with momentum confirmation, like RSI divergence, and traded at the boundaries. Without confirmation, the false breakout rate is high.
Is it bullish or bearish? Neither inherently. It's a neutral volatility pattern. The bias comes from context, where it forms relative to the larger trend, and which boundary breaks first.
Does it work in crypto markets? Yes, and often with exaggerated moves. Crypto megaphones tend to be faster and wider, which means the reward is larger, but so is the noise. Tighter confirmation rules apply.
How do you trade a megaphone pattern? Fade the edges with confirmation. Sell near the upper trendline with RSI bearish divergence. Buy near the lower trendline with bullish divergence. Stop outside the structure, target the midline first, then the opposite boundary.
What timeframe works best? 4-hour and daily charts produce the most reliable setups. Anything below 1-hour introduces too much noise for the pattern's structure to hold cleanly.
Stop guessing breakouts and start trading patterns with actual structure. TradeWill gives you the tools, analysis, and education to trade megaphone patterns and everything beyond — with real confidence.
Disclaimer: The content of the blog does not represent any position of Trade W, does not serve as any trading-related decision advice, and does not endorse any third-party.