

 Trade W
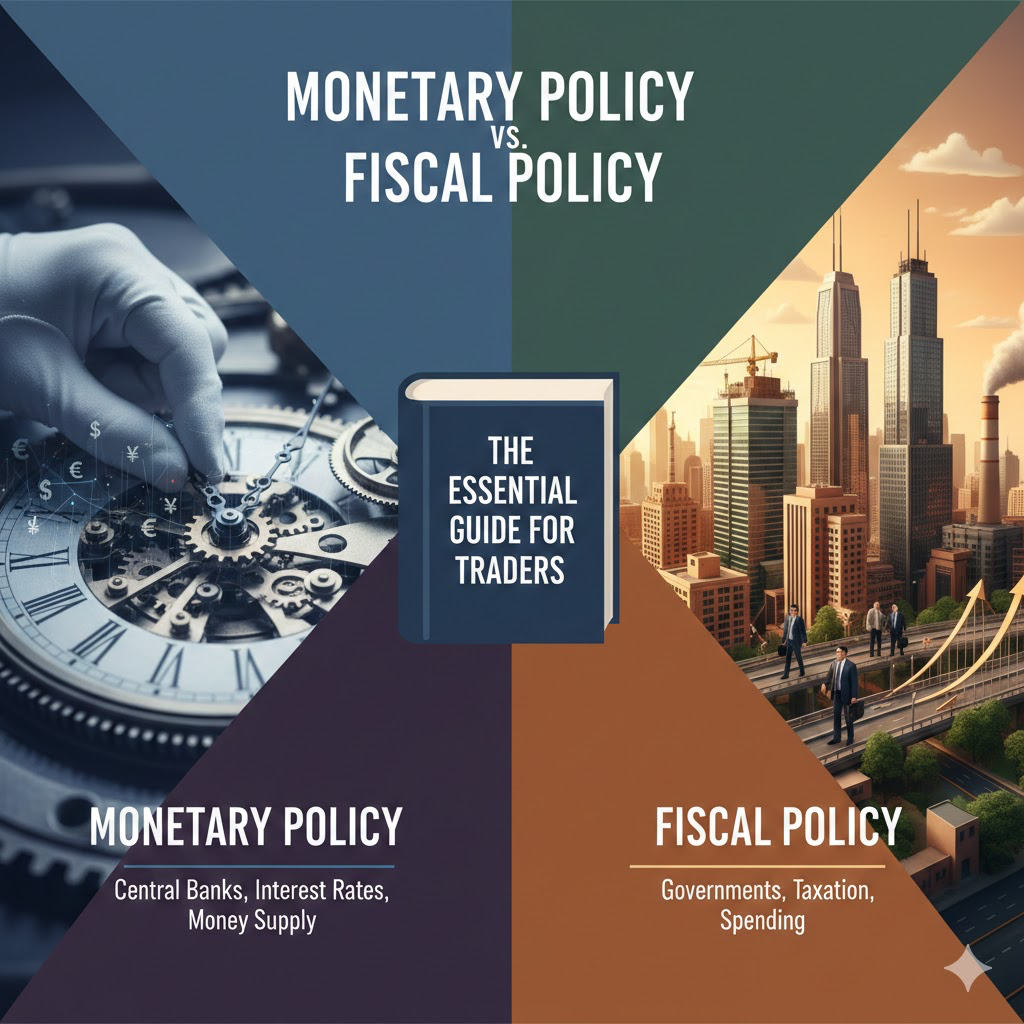
Introduction: Why Every Trader Must Know the Difference
Some traders find it difficult to understand why the stock market reacts strongly to both the announcement of an interest rate cut by the Federal Reserve and when a new trillion-dollar spending bill is passed by Congress.
In order to answer this question, it is necessary to take a look at two types of government policies: fiscal and monetary. Understanding these two policies is important for understanding how both types of policies influence every asset you trade, such as EUR/USD, gold, and S&P 500 futures.
Monetary policy is created and enforced by central banks, including the Federal Reserve, which uses interest rates, quantitative easing, and reserve requirements, as well as other monetary tools. This means that monetary policy is immediate and has a quick impact on markets as compared to fiscal policy, which is created by federal governments such as the United States Congress.
While fiscal policy is powerful in the long term, it takes time for fiscal policy to affect the economy because there is a much longer period of time between the time the law is created and the time the money actually hits the economy. For example, interest rates could be cut today, and the dollar could drop within a matter of minutes; whereas the $2 trillion layout of the infrastructure bill will take years, not days, before it will begin to be felt in the economy.
As of 2026, we are currently witnessing the effects of the Fed's latest cycle of interest rate cuts colliding with a significant fiscal policy called the One Big Beautiful Bill Act (OBBBA). Understanding the relationship between these two policies is not just a fun theory; it can also mean the difference between catching a breakout in a stock or being on the wrong side of a reversal in stock prices.
Both day traders who trade currencies and long-term investors who own companies need to be aware of the driving force in the stock market and which type of policy will have the most significant impact over the next three months.
Core Comparison: Tools, Goals & Who Controls Them
In this blog, I want to take time out to discuss the actual differences between monetary and fiscal policy.
Who's In Control?
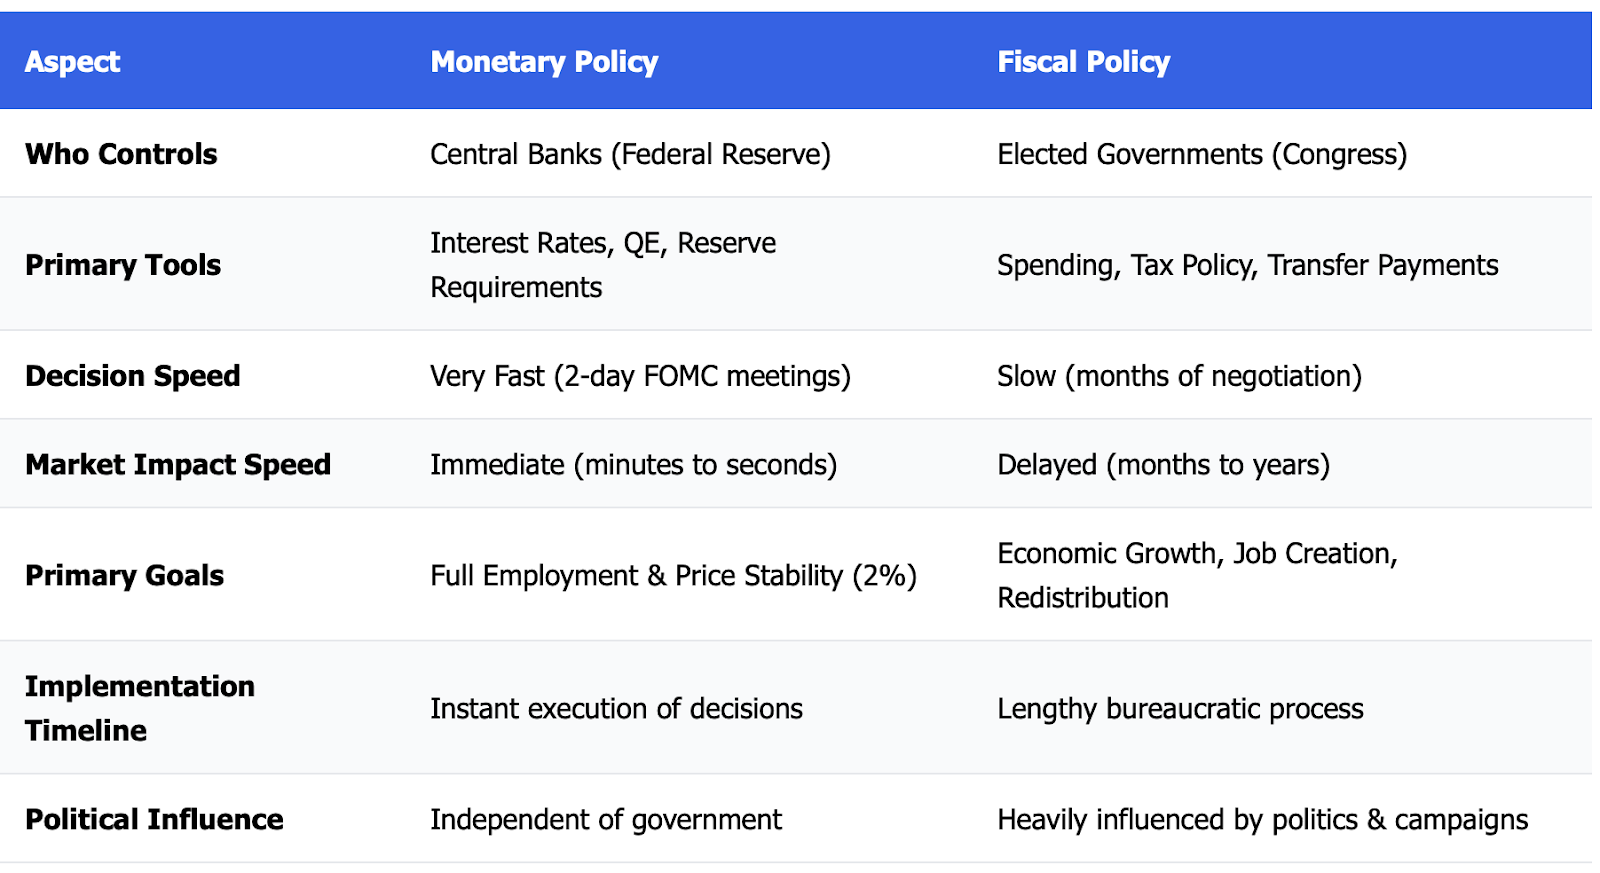
Monetary policy is the job of Central Banks. In the United States, the Federal Reserve does this. The European Union relies on the ECB. The Bank of Japan is theirs. All these banks operate independently of the government, at least on paper. Jerome Powell does not get any permission from Congress in the U.S. for rate decreases.
Fiscal policy is the job of elected governments. In the U.S., Congress creates the budget, tax code and actual taxes. The Treasury executes, etc. Every dollar spent by the government and every single tax break received goes through the political system.
The above is important because Central Banks can change direction much faster than elected leaders can. Politicians, however, have to negotiate, potentially compromise and always campaign.
Tools Available For Use
Central Banks use 3 basic tools of monetary policy:
-
Interest Rates - The price of money borrowed - cutting rates leads to business investment; raising interest rates will temper inflation
-
Reserve Requirements - The amount of cash banks must have; lower reserves increase the money supply
QE (Quantitative Easing) - Buying bonds to inject liquidity - a speciality of the Fed since 2008.
Conversely, governments have an entirely different set of tools available for fiscal policy:
-
Gvt. Spending - Direct injections into the economy through infrastructure spending, defence contracts, and welfare spending.
-
Tax Policy - Corporate tax cuts, payroll tax holidays and capital gains adjustments represent the tax code changes that affect the amount of capital individuals have available.
-
Transfer Payments - sending checks, as well as unemployment benefits, and providing subsidies are ways in which the U.S. government provides money to consumers.
Economic Outcomes Based on Government Monetary Policy
The Federal Reserve states that it has two primary objectives: Full Employment and Price Level Stability, 2% inflation target. They place the most emphasis on these two objectives; all other goals are secondary. To achieve maximum employment and maintain stable prices, the Fed employs a mechanistic/algorithmic approach of raising interest rates when inflation is 4% and lowering interest rates when unemployment increases.
Fiscal policy has more complexity than monetary policy regarding its objectives/goals. Economic stimulus is a goal, but wealth redistribution, fulfilling political promises, regional favouritism, and re-election/campaigns also fall under fiscal policy's purview. A spending bill may create jobs; however, for many congressmen, it is simply a way of financing their home district back home.
For example, currently, in January 2026, the Fed dropped interest rates by 0.25%, which was a clean targeted effort to support growth without overheating inflation. This decision was made in two days at a fee meeting of the Federal Open Market Committee.
In contrast to fiscal policy, the passage of the $1.8 trillion OBBBA infrastructure spending package took months of Congressional wrangling to finally get passed. The aggregate $1.8 trillion spending package infrastructure appropriations over 5 years will not be in full effect until 2028, and there were corporate tax cuts that will be phased in over 3 years and green energy tax credits that will not peak until 2028.
This illustrates how, while both the Fed and Congress are working towards the same objective, supporting economic growth, they operate at very different speeds.
The difference in how these two bodies operate means that a change in monetary policy, such as a Fed interest rate adjustment, will have an almost instantaneous impact on the market, i.e., volatility in treasury yields will occur in a matter of seconds. In comparison, a fiscal spending bill will have much less of an immediate effect on the market; rather, fiscal spending bills will create a much slower/longer-term impact on market trends in currencies and commodities.
Reaction Speed: Why Interest Rates React Faster Than Government Spending
The horrible fact is that when it comes to timing between fiscal and monetary policy, by the time an actual fiscal policy is implemented through the federal government, monetary policy has already moved the market three times.
The Decision Process
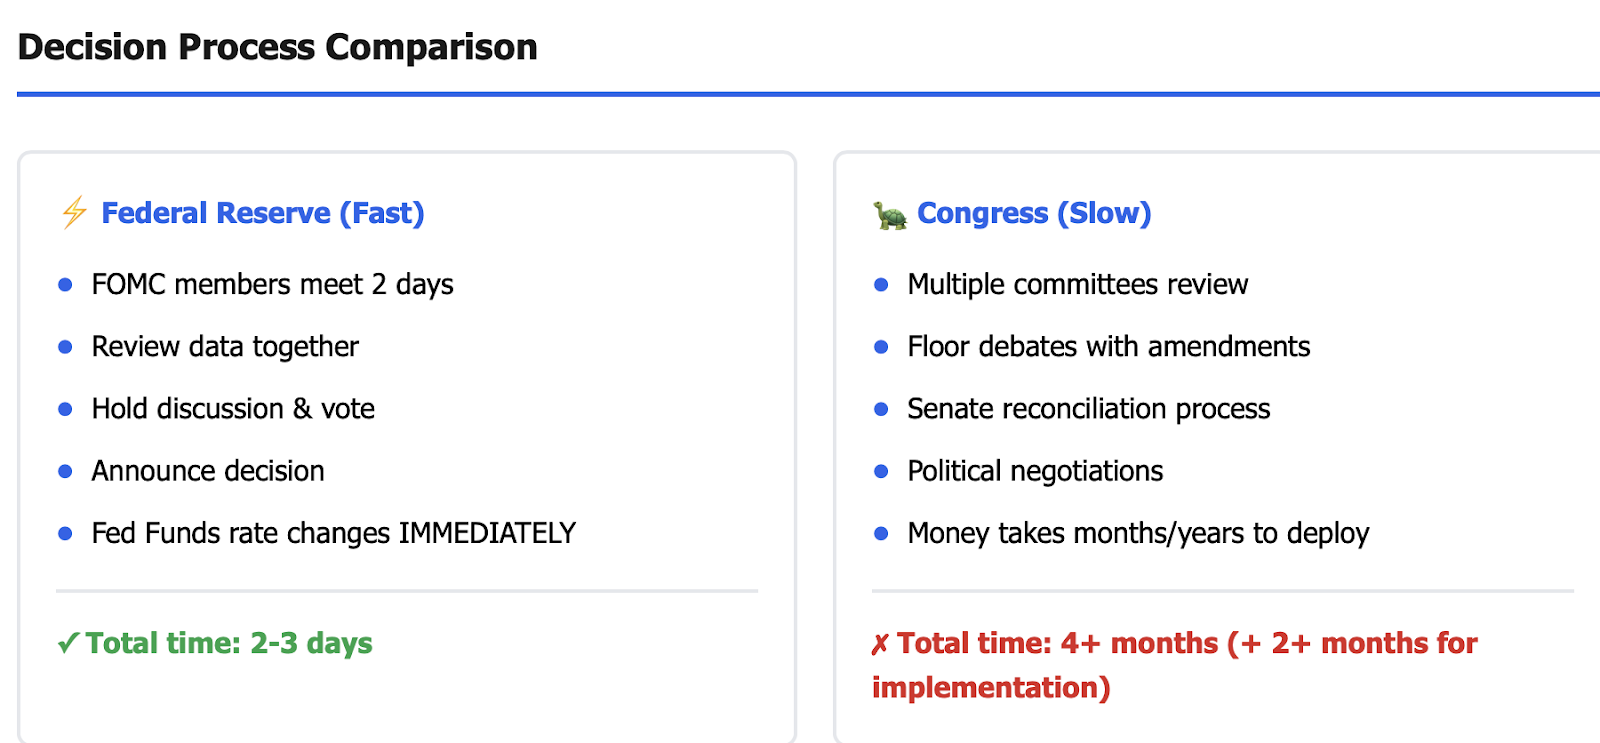
When the Federal Reserve looks to decrease the interest rate, the process for how it makes that decision is really clear. Members of the Federal Open Markets Committee (FOMC) look at the following data, meet for two days, discuss and hold a vote, and announce their decision. How long does it take from the decision to actually implement the interest rate cut? Very fast! The target rate changes for the Fed Funds immediately!
When the Federal Government wants to implement fiscal policy, there are many time-consuming and convoluted steps to take. This process involves too many committees, lots of floor debates, amendments and Senate reconciliation, all of which take time. The OBBBA took four months from the time it was originally proposed until it was officially passed. And then another two months for agencies to set up grant programs and bidding instructions/ deadlines before actually issuing grants.
Market Timings
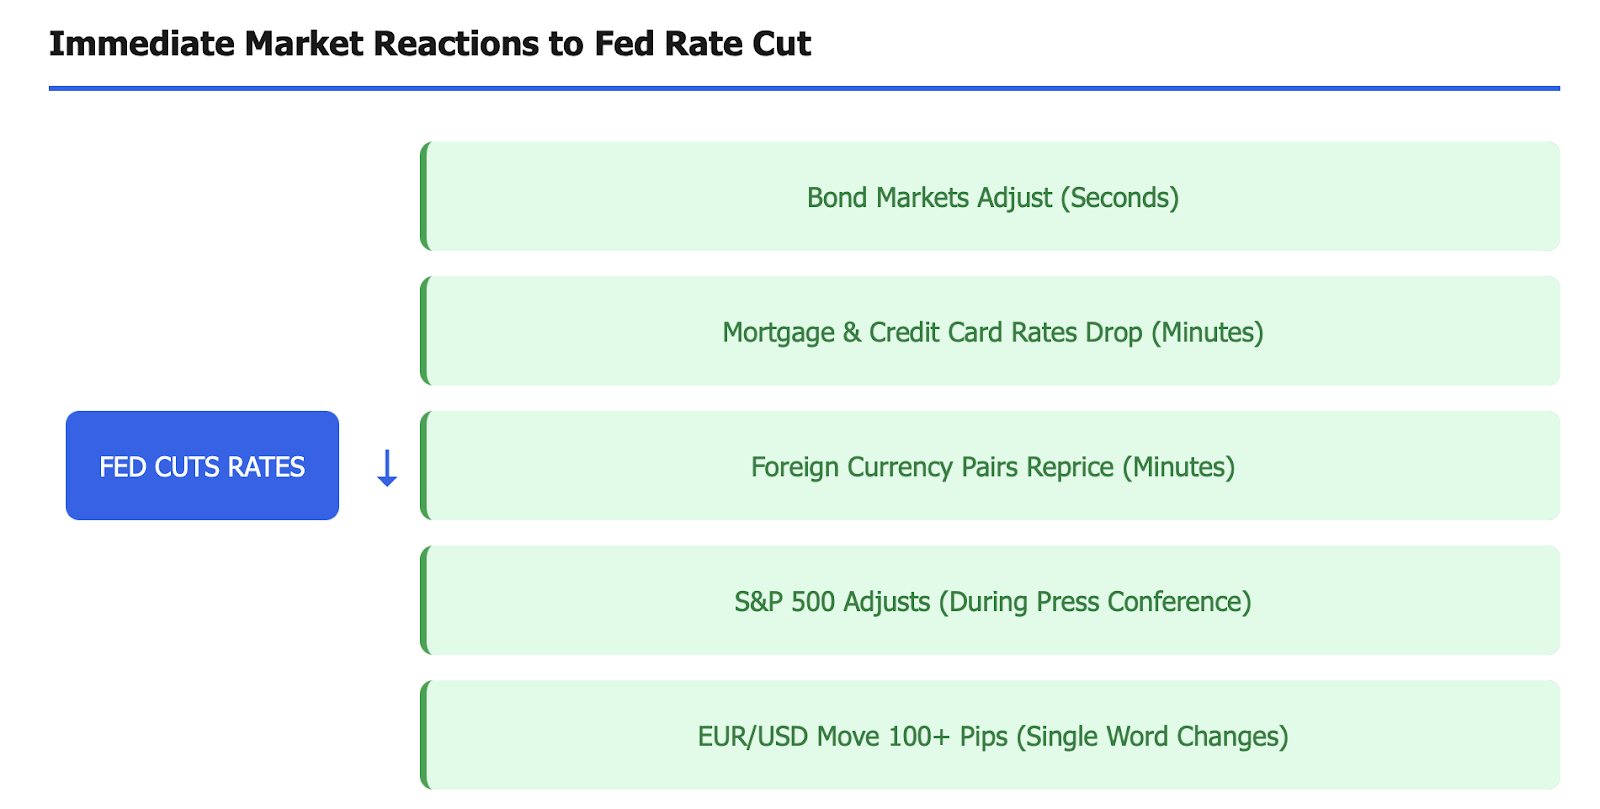
When the Fed cuts the interest rate, it's an immediate FOMC decision. All interest rates go down instantly, because in minutes:
-
The bond markets adjust
-
Mortgage rates go down
-
Credit Card Rates Go Down
-
Multiple Foreign Currency Pairs Are Repriced
The S&P 500 will adjust prior to Powell even finishing his press conference, and the EUR/USD may change by 100 pips on a single word of the FOMC statement.
So when the Federal Government passes a fiscal policy bill, the first chunks of money to be spent don't come out right away. When implementing infrastructure projects like a highway, you have to go through a lengthy process of environmental assessments, bidding by contractors and procuring materials. The highway money from the OBBBA may not be spent until Q4 2026, and peak spending will be in 2027.
Case Study: February 2026
Two Week Prior 1:2::2/5/2026 Fed Open to Future Rate Cut
On February 5, 2026, the FED demonstrated willingness towards another rate decrease as subsequent data came into view with Fed Funds Rates as well as with longer-dated treasuries declining 80 pips during the first hour after the announcement, an increase of $25/ounce for Gold, treasury yields down 8basis points for Yields< 10.
Before that date, the initial part of February was 2 weeks earlier when Congress approved and signed into law $400 billion of the OBBBA package, allowing for immediate spending.
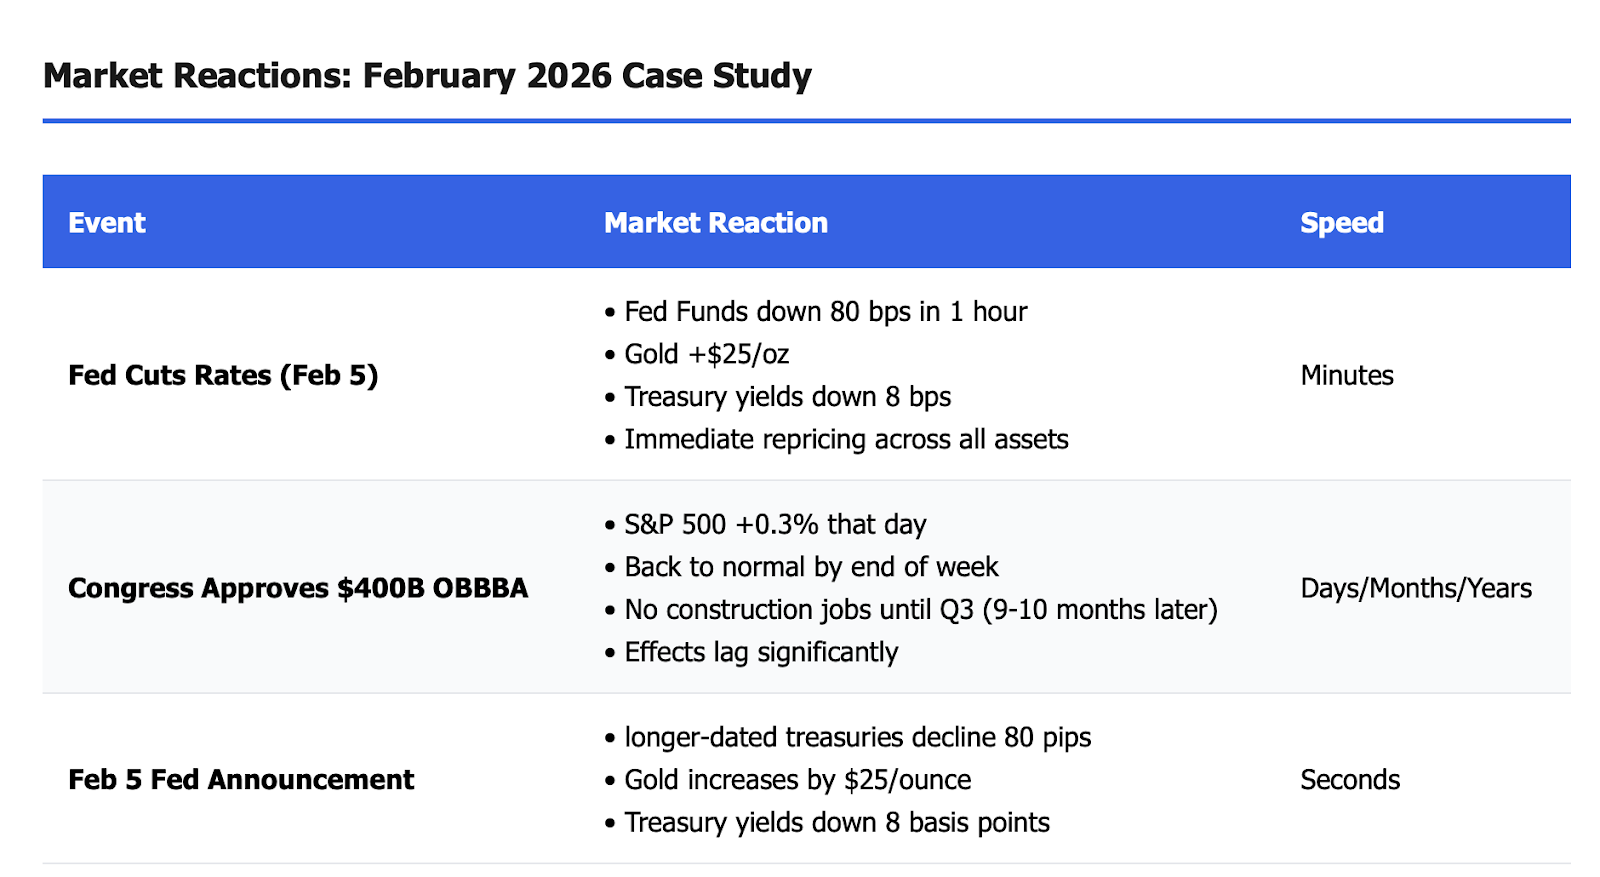
The immediate market reacted with the S&P500 up .3% that day, back to normal by the end of the week, before having any construction jobs reflected on Q3 Empl. numbers, most likely after 9 or 10 months into the program, to the completion of various construction projects.
Trading Considerations:
Short-term traders: Monetary policy serves as your driver/timing. Fed meeting days are great days to scalp the market during the reactions post-rate decision.
Long-term investors: When you have an OBBBA project, the demand for industrial metals from this package of infrastructure spending will last for at least the next several years. Earnings growth/revenue growth for those defence contractors receiving an OBBBA-funded contract will also demonstrate earnings improvement for both 2027 and 2028.
Think of it like this: Monetary policy will create the waves that day traders trade tomorrow, whereas fiscal policy will determine whether those same waves become higher/lower within or outside of the monetary structure.
2026 Real Case: How OBBBA & Fed Rate Cuts Move Markets
To effectively analyse how fiscal and monetary policies are currently at odds with one another, let’s take a look at the Fed and the OBBBA.
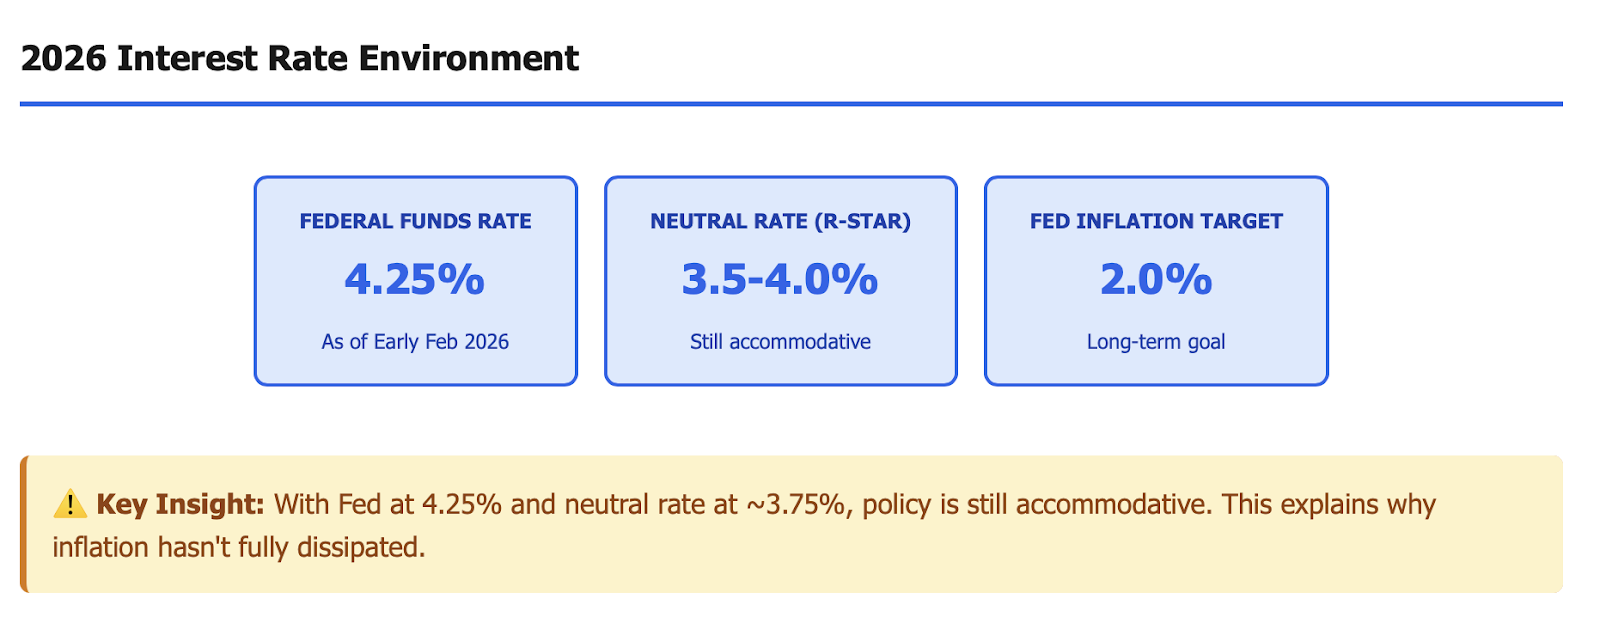
Starting with the Fed, they have been cutting rates since late 2025. Currently, the Fed has cut rates to 4.50% as announced in early Feb 2026. The rate cuts were announced with a commitment to support growth while keeping inflation headed toward the target of 2%.
The January 0.25% reduction had dovish forward guidance, and Chair Powell stated "growing confidence" about the inflation outlook and that the Federal Reserve was well-positioned to help support the labour market. The implications of this statement to traders suggest more cuts to come, potentially three more in 2026.
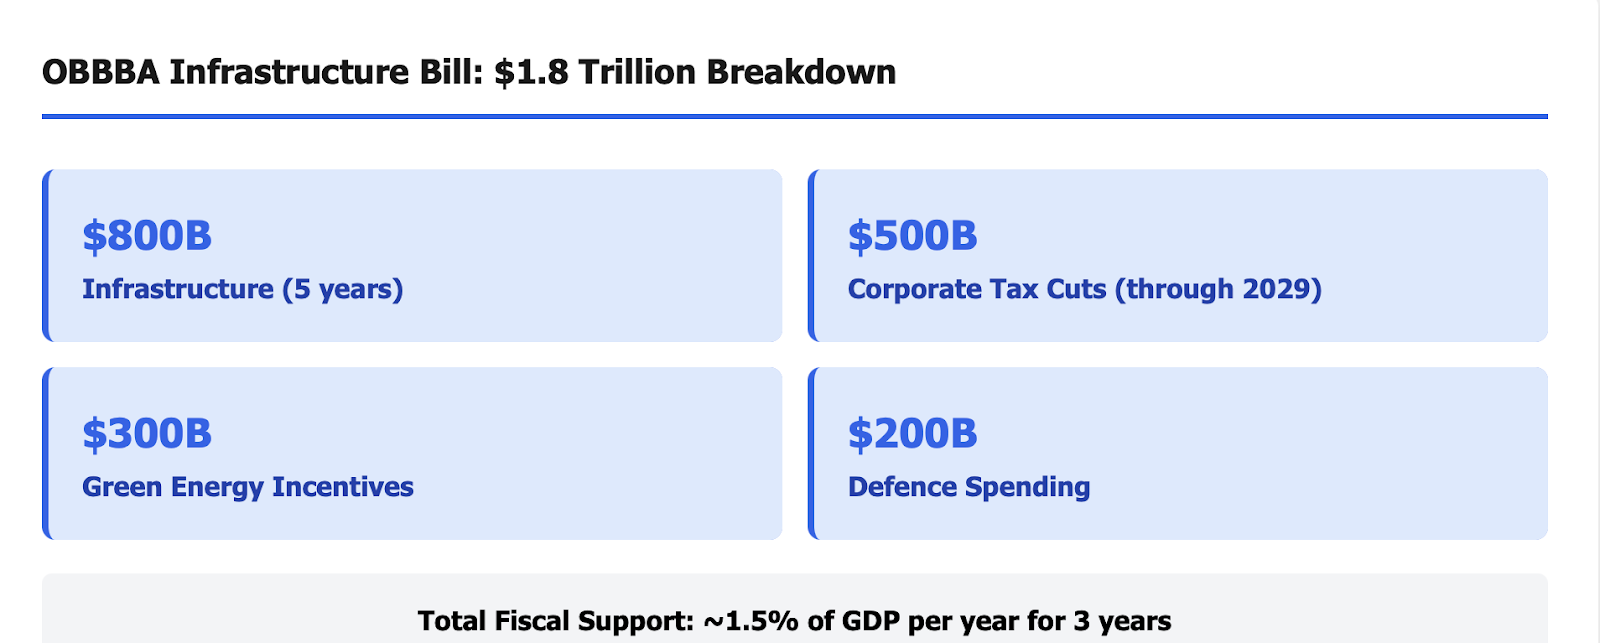
The OBBBA is the largest fiscal expansion since COVID-19. Key aspects include:
-
$800 billion designated for infrastructure over five years
-
$500 billion in corporate tax cuts through phasing in until 2029
-
$300 billion for green energy incentives
-
$200 billion for defence spending
Total fiscal support will amount to approximately 1.5% of GDP each of the next three years.
The Collision Course
This is where it starts getting really interesting. The Fed is attempting to lower monetary policy pressure through an interest rate cut (or cuts). At the same time, the federal government is pumping money into the economy via the OBBBA program through large-scale spending on various infrastructure projects.
Theoretically, these two monetary policies would work in harmony with one another as the OBBBA program would also be deemed an expansionary form of monetary policy or monetary stimulus with the intention to inspire a pick-up in economic growth as rapidly as possible.
However, there is some building tension between the large-scale fiscal spending of the federal government and the target inflation rate of the Fed. Due to the expected increased construction costs and wages stemming from OBBBA-funded infrastructure projects, the Fed may have to halt its current interest rate cut cycle sooner than expected by the financial markets.
Market Reactions to Date:
Equities: The S&P 500 Index posted an increase of approximately 8% from the time of the OBBBA announcement until early February, driving the gains in the Technology Sector and the Industrial Sector, with the Defence Contractors and Multi-Modal Infrastructure Companies gaining approximately 12% - 15%.
Bonds: This is the area that gets ugly. As it pertains to the overall yield curve, one would expect yields to decline as the Fed cuts rates, yet yields began to decline initially, as evidenced by the 10-Year Treasury bond rate dropping from approximately 4.60% to 4.30%. After that point, however, the Treasury's large issuance of new debt to fund OBBBA construction projects caused the rate to move back towards 4.50%. Additionally, the yield curve has begun to steepen as the market begins to anticipate the Treasury's increased issuance of long-term debt to fund OBBBA construction.
Forex: The U.S. dollar traded lower, and the Euro/USD has rallied from $1.03 to $1.07, but then the dollar has found a technical support level as investors' expectations of U.S. Economic Growth in comparison to European Economic Growth continue to accelerate, regardless of interest rates being lower in the United States.
Gold: Gold had an initial price move to $2,720 due to the dovish interest rate outlook, but then the demand for Gold fell back to a trading price of $2,680, since the price of Gold currently reflects an elevated level of real interest due to higher fiscal spending.
The Trading Setup
For the next few months, you should pay attention to signals of policy divergence; if inflation data comes in hot (above 3%), the Fed will likely be on hold even though OBBBA has provided stimulus. In this case, the dollar will get stronger and put downward pressure on both gold and equity markets.
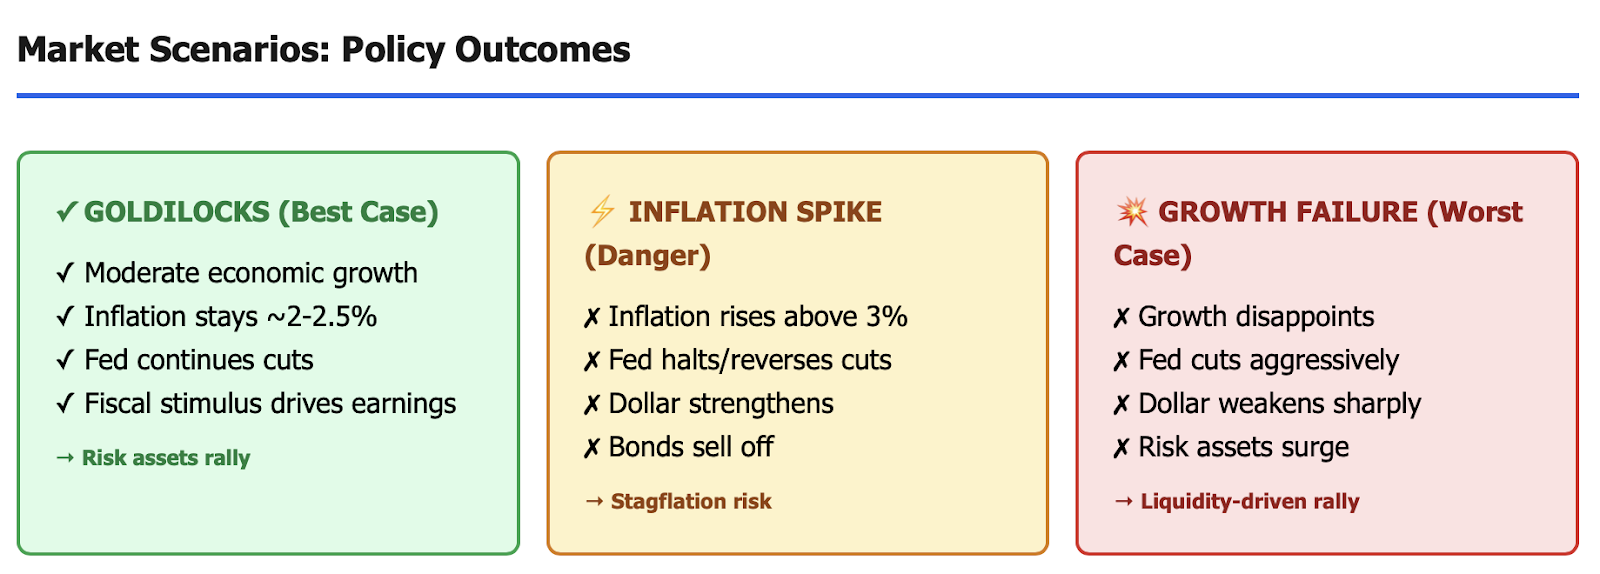
On the flipside, if economic growth data does not meet expectations, the Fed could very likely reduce interest rates aggressively moving forward. This would then add a significant amount of currency weakness to risk assets, thereby helping risk assets perform well.
Moderate economic growth combined with ongoing interest rate cuts from the Fed would be the perfect combination (i.e., a Goldilocks scenario) that is leading to current market exuberance.
Trading Opportunities: How Policy Divergence Creates Profit Potential
The most profitable markets are usually the dirtiest markets. When fiscal and monetary policy are moving apart in opposite directions, you have volatility, and when you have volatility, you have opportunity.
What is divergence?
Expansionary fiscal policy is when the government is pushing cash into the economy by spending more than it is collecting in taxes. On the other hand, contractionary monetary policy is when the central bank drains cash out of the economy by increasing interest rates and shrinking its balance sheet.
These two different types of policies create a conflict because the government is pressing the accelerator while the central bank is pressing the brake. The markets do not like uncertainty, which is why traders watch for the direction of the particular policy to see who will ultimately win.
As of June 2026, we currently have opposite conditions. Government and central banks are all pushing to expand. Many factors would normally support risk investments when fiscal and monetary policies are both loose, but now there are new concerns rising because of inflation.
The yield curve is a fantastic indicator of divergence trades. When fiscal stimulus is rapidly flowing into the market while the Fed is pushing short-term interest rates lower by way of interest rate cuts, the entire yield curve is creating a steeper slope.
Short-term yields (2 years) are coming down in accordance with the fed funds rate. At the same time, long-term yields (10 & 30 years) are coming up because investors require more compensation for the risk of inflation and for the increased Treasury supply that will be created by the expansionary policies.
From January to February 2026, we experienced an increase in the yield curve between 2-year and 10-year of 15 basis points to 45 basis points, indicating a major shift in sentiment.
Your trade is long equities due to lower short-term borrowing rates, while being cautious on long-duration bonds due to a lack of supply and rising inflation expectations.
How is each asset class expected to perform?
Stocks: A combination of fiscal spending providing direct earnings and lower rates providing cheap access to capital will benefit all equities. Smaller companies will primarily be affected as they are more domestic in proximity to their financing source than companies with international exposure.
Forex: Divergence between countries creates an even larger opportunity to take advantage of fiscal stimulus versus monetary policy. In the current situation, the EUR/USD is not trading between a dovish Fed, and due to the expansionary fiscal stimulus of the US, the US continues to grow even though the Fed is dovish, creating multiple opportunities.
Commodities: When the Government releases its expansionary fiscal spending program, the prices of some industrial metals will skyrocket. Specifically, copper, aluminium and steel will all benefit from infrastructure upgrades due to the expansionary fiscal policies of the Government over the past several years.
Gold, however, presents a more challenging analysis. If the Government spends on fiscal programs, the cost of holding that gold will also continue to rise as interest rates fall, since the opportunity cost will also increase if there are opportunities elsewhere due to High Real Growth rates.
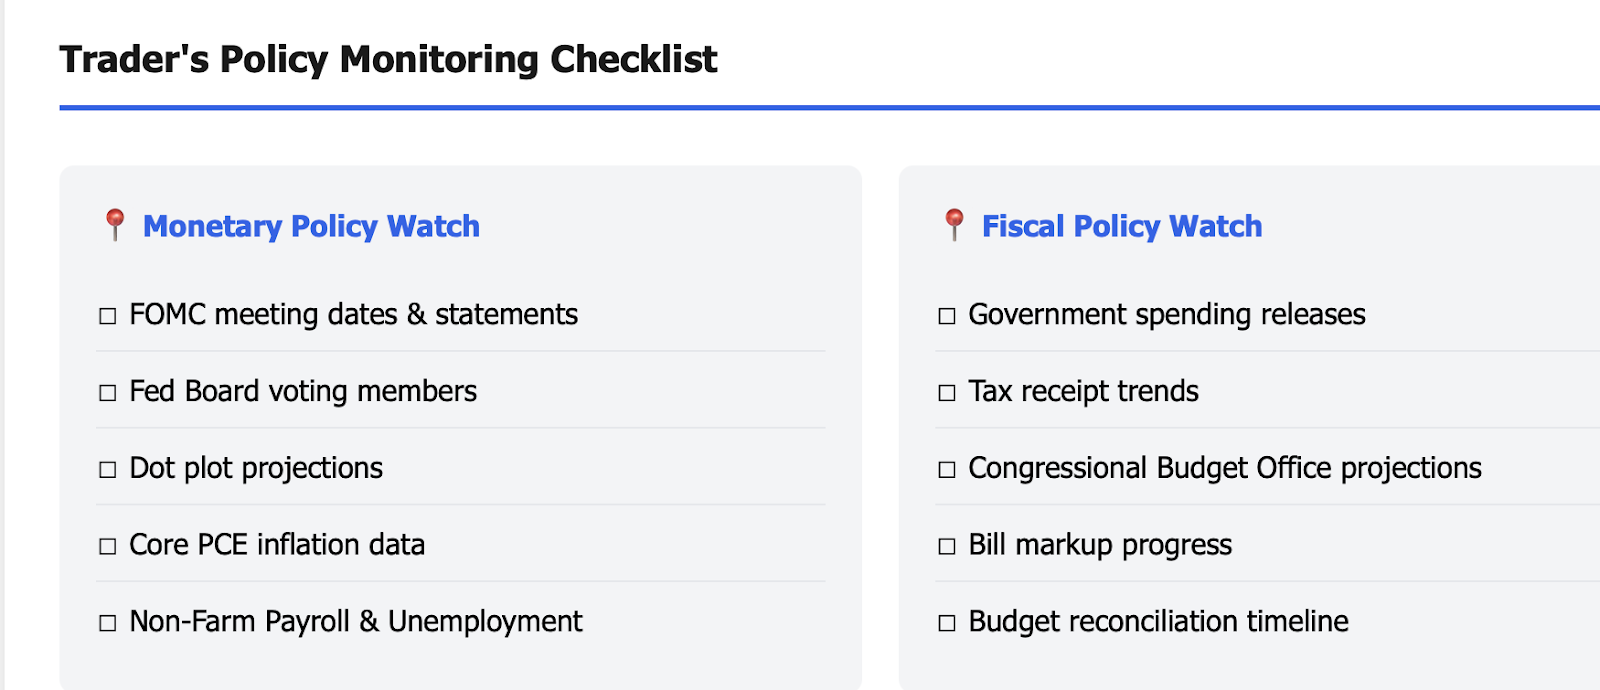
Practical Monitoring with TradeWill
If you don’t keep track of your trades, then you can never trade successfully! Here’s how to ensure you’re always ahead of the curve:
Track Following With Monetary Policy:
-
FOMC Meeting Dates/Statements
-
Federal Reserve Board Members, i.e. Federal Reserve Board of Governors or voting members of FOMC
-
Core PCE Inflation Fed’s Preferred Measure
-
Non-Farm Payroll & Unemployment Rate
Track Following With Fiscal Policy:
-
Government Spending Data Releases
-
Tax Receipts Trends
-
Congressional Budget Office Projections
-
Fiscal Multiplier Estimations from Various Economists
TradeWill’s Economic Calendar automatically tracks all the above events and allows you to configure alerts for FOMC Days, non-Farm Payrolls, and Major fiscal announcements.
Risk Management
There will be fluctuations when trading based on policy changes. The passing of the OBBBA in late January caused the markets to fluctuate for several days while traders adjusted their expectations based on the news.
Using larger-than-normal stop-loss orders is an advisable strategy when you are trading volatility generated by a change in policy and possibly fake breakouts. A 1% move below support levels may surge up to 1.5% before pulling back down to the original level.
Consider using volatile options strategies such as straddles for trading before FOMC meetings or major votes, where you can profit regardless of which way the price moves now.
Forex Focus: Avoid Strategy Fails by Understanding Policy Impact
If you trade currencies, monetary vs. fiscal policy is gonna be your only option, if you want to keep feeding yourself, that is.
Interest Rate Parity
It's one of the most important pieces of info regarding forex trading; it warrants repeating. Currencies tend to flow to the country/currency with higher real interest rates.
If the Fed cuts interest rates and the ECB keeps their rates where they are, money will move from dollars to euros; EUR/USD will go up. This is mechanical and happens quickly because of the way in which these parameters are structured.
The tricky part is that real interest rates have a stronger influence on currency fluctuations than nominal interest rates. If the U.S. cuts from 4.5% to 4.25% and U.S. inflation is circling 3%, then the effective real rate of return will only be 1.25%, while if the ECB maintains 3.5% interest and the eurozone is experiencing 2% inflation, then the effective real rate will be 1.5%. As such, money would then flow to the euro.
That's also why forex traders are equally obsessed with inflation figures as much as central bank meetings.
Fiscal Policy as a Slow Burn
While fiscal deficits and levels of debt don't have a strong impact on currencies on a day-to-day basis, they can be quite significant over time.
The OBBBA will add about $1.8 trillion to the U.S. national debt, which is more Treasury issuance, greater supply, & higher interest rates to entice buyers. In theory, higher interest rates will strengthen the U.S. dollar.
However, there is a tipping point: if the markets begin to doubt the U.S.'s ability to maintain fiscal sustainability, the U.S. dollar could weaken, even though interest rates are high. The UK gilt crisis in 2022 is an example of how following the fiscal credibility rules is important.
Right now, the U.S. is still in good standing; the U.S. dollar is still the world's reserve currency, and Treasuries are still viewed as a "haven" asset. However, traders who ignore the rate of fiscal deterioration in the U.S. are going to regret it when they finally get caught in a slow-moving train that suddenly runs them over.
Classic 2026 Setups
For US Dollar/Japanese Yen carry trades:
In Japan, with rates held near zero and the US Federal Reserve cutting rates down to 4.25%, there is a difference in rates of 425 basis points. You are able to borrow yen and use them to purchase US dollars, thereby capturing this huge differential.
The risk with this strategy is that if the Federal Reserve cuts rates faster than anticipated or if the Bank of Japan raises rates (with inflation in Japan on the rise), the strategy can unwind dramatically. For example, USD/JPY dropped from 156 to 149 in 2 days when the Bank of Japan indicated a possible movement to normalisation.
There is also a material divergence policy between the ECB and the Fed on how to address rising inflation and declining growth. This suggests that there will be a move to strengthen the EUR relative to the dollar, but the extension of fiscal stimulus in the US from the OBBBA may allow the US to outperform the EUR due to fundamentals.
In the end, this represents the classic battle between monetary policy and fiscal policy with respect to one currency pair.
Execution of Trade
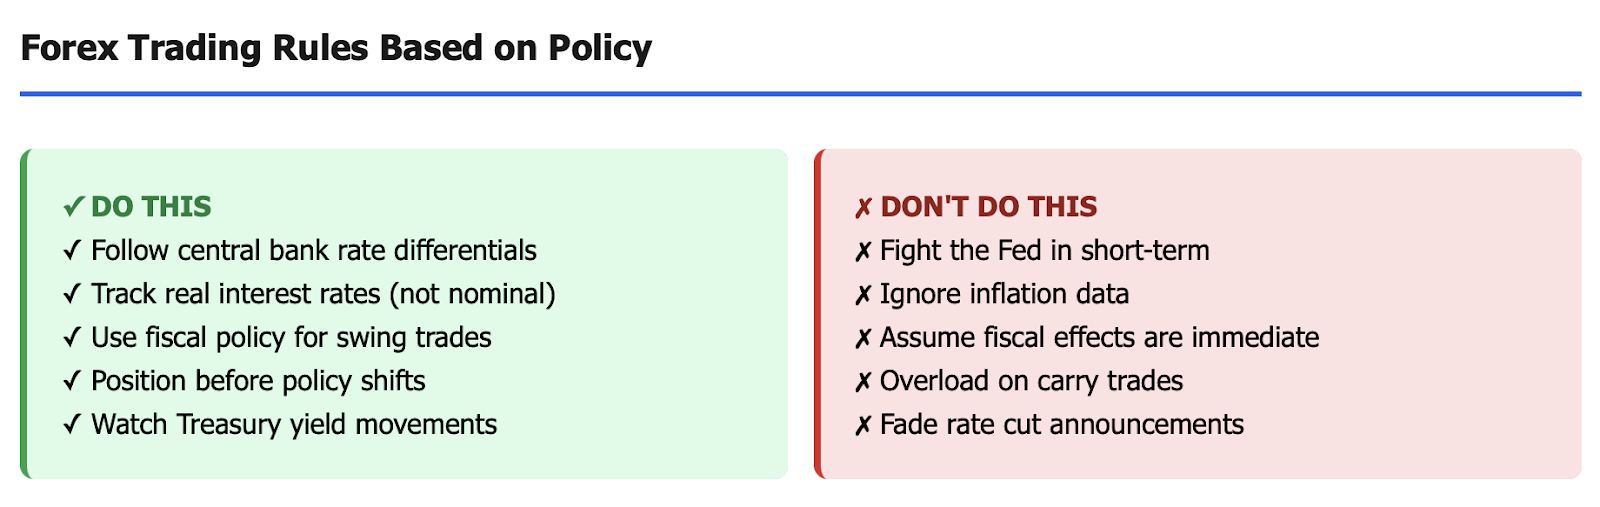
Do not cross the central bank’s perceived view in the short term. If the FOMC is going to cut rates, the dollar is likely to depreciate immediately, regardless of the level of fiscal policy, and you will only fade that move with extreme confidence with respect to either inflation or fiscal-driven growth.
Utilise fiscal policy for swing trades and long-term positions. If you believe that OBBBA will promote sustainable outperformance of the US economy and therefore a stronger dollar, purchase dollar long trades when prices are low. You cannot expect immediate results.
Also, keep an eye out for confirmation from related markets. If yields on Treasuries are rising while the FOMC is slashing rates, that represents fiscal policy exerting its influence – and is representative of a signal that dollar weakness is likely to be limited.
2026 Macro Outlook: How to Invest Amid High Deficits & Neutral Rates
On the broader scope of fiscal and monetary policy in 2026 and beyond, it’s important to look at the current situation.
The Debt Issue
U.S. federal debt levels are now approaching $36 trillion, with the passage of the OBBBA adding another nearly $2 trillion. The federal government continues to run annual deficits of about $2 trillion, even with the economy growing at a reasonable pace.
These trends create what economists refer to as fiscal crowding out. When the federal government borrows heavily, there is competition with the private sector for available capital. As a result, capital becomes more expensive due to increasing interest rates, thus forcing private investment lower.
In practice, this situation will make the job of the Federal Reserve (the "Fed") much harder in terms of cutting interest rates to support job growth, as the large amounts of federal borrowing will keep long-term interest rates at elevated levels. Consequently, the yield curve will not be conducive to supporting job growth.
Debate over Neutral Rate
Another key issue that needs to be reviewed relates to R-star, or the “neutral rate”, defined as the rate at which monetary policy is neither stimulating nor restricting the economy. Pre-2020, estimates of this rate were around 2.5%, and many Fed officials now believe it may be closer to 3.5% to 4%.
The rationale for the shift to a higher neutral rate is based upon structural issues, including an ageing population requiring greater savings, the impact of de-globalisation resulting in lower efficiencies, the transitional costs of moving to a climate-friendly economy, and, yes, the need for higher government debt.
If 4% is in fact the neutral rate, then with the Fed currently at 4.25%, the Fed is still not in a restrictive monetary policy. As a result, this will explain why inflation has not completely dissipated after two years of “tight” monetary policy.
Asset Allocation Considerations
Traditional 60% equities, 40% bonds asset allocation portfolios have struggled to perform in an environment where there is loose fiscal and monetary policy. Bonds no longer offer diversification for an investment portfolio when both monetary and fiscal policy are loose.
Gold and silver are more attractive investment choices as they hedge against inflation, hedge against currency debasement, and may substitute for regular bonds that have negative real yields. Gold reached a high of $2,720 in early February for a good reason: investors are concerned with the fiscal environment and believe it is unlikely that inflation will remain at 2%.
Treasury Inflation-Protected Securities ("TIPS") should provide a better hedge against inflation than regular bonds. TIPS are expected to outperform regular U.S. Treasuries significantly if the expected level of inflation exceeds 3% due to the additional spending associated with the OBBBA.
Real assets such as infrastructure funds, commodity producers and real estate will directly benefit from fiscal stimulus. These assets not only act as hedges against inflation, but also will benefit from federal spending.
Equity investments will also be a viable option as long as you are selective. Companies that can pass on price increases will have better chances of surviving in a high-inflation environment. For example, companies focused on the domestic market will have greater access to Federal expenditures associated with OBBBA than will multinational companies. Defence contractors and infrastructure contractors will be the most obvious beneficiaries of federal spending.
The 2027-2028 Worry
There are reasons for macro investors to be concerned - What will happen if the OBBBA peaks in 2027? If we see inflation re-accelerate back over 3% to 4%? Will the Federal Reserve raise interest rates after previously saying it would lower interest rates?
With both monetary and fiscal policy now tightening, you can expect to see growth decline. Due to increased costs related to interest payments on debt, large increases in the deficit, and subsequent repricing of all financial assets.
Even though this is an unlikely outcome, it is still a situation within the realm of possibilities. You should prepare yourself by holding some cash to deploy into stagflationary assets, e.g. gold, commodities, defensive equities and avoid long-duration debt.
Constructing Your Portfolios
An ideal portfolio for this situation would contain a combination of stocks that can benefit from immediate policy actions, e.g. winners based on possibly lower interest rates & small caps/growth activities. Plus, there would be longer-term hedges against inflation, e.g. gold, TIPS, tangible assets.
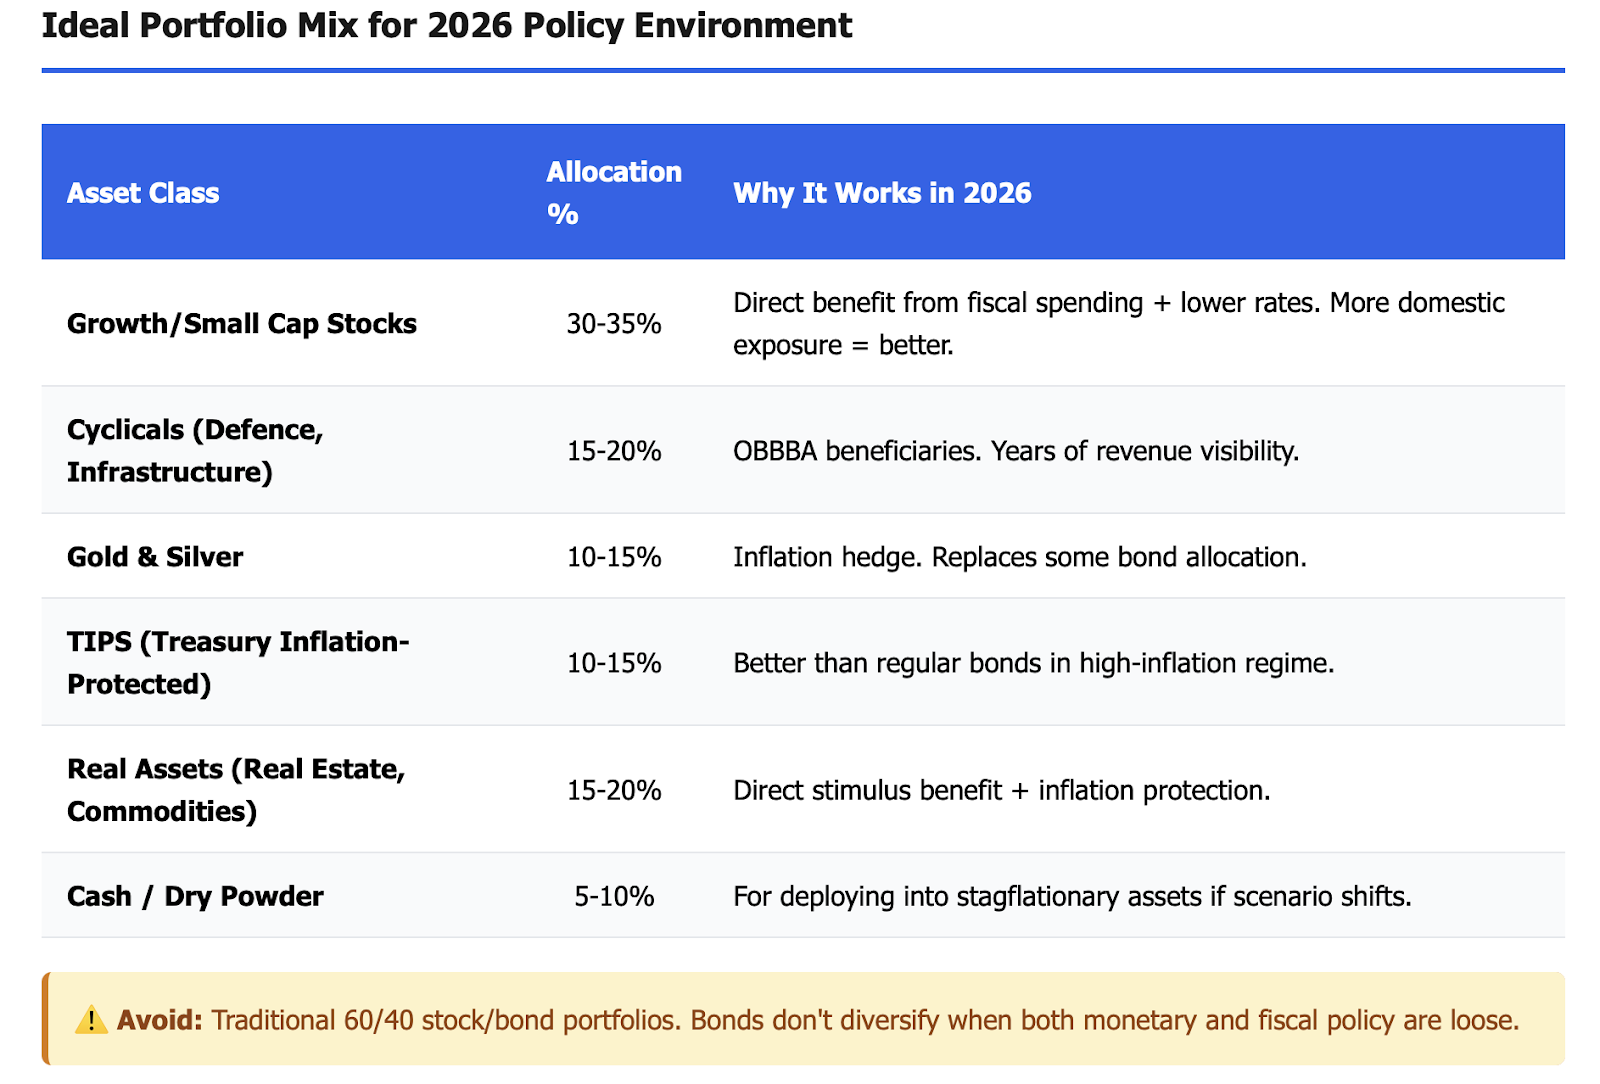
Do not go all in on either bullish fiscal stimulus creates great effects or bearish the U.S. will default on its debt. The truth between the two opposing factions will likely be revealed throughout this transition as they are both accurate to varying degrees & over various periods of time.
You will need to be prepared to react flexibly to changes as you follow closely how RPI data is released weekly, and do not forget that policy is not executed linearly; there is always a time lag for everything involved when implementing or changing policies.
Market Psychology: How Traders Price in Policy Shifts
The Market Does Not Wait for Policies
However, markets 'pre-price' their expectations of new policies long before the FOMC cuts rates or Congress passes a deficit bill.
Buy The Rumour, Sell The Fact
This is an adage about trading based on the expectation of a change in a monetary policy environment. For example, if there is a hint from Chairman Powell about a rate cut coming, perhaps through an overly dovish tone at a speech, the market will immediately rally. However, once the Federal Reserve actually does cut rates, which will take several weeks, it's usually a disappointment.
For example, this occurred in January 2016, when the Fed cut rates by 25 bps and the S&P 500 had barely moved; this was due to everyone already pricing in the potential of a rate cut. The best time to buy was on the "dove cycle" shift in December when Powell made dovish comments.
The same principle applies to fiscal policy. The "OBBBA" was also anticipated long before it passed Congress. Therefore, the market had already priced in some of the benefits of this legislation before its passage, but quickly consolidated after it passed.
The strategy is to position yourself before a potential change in policy based on one's perception of what the change will be, while avoiding the delays that accompany announcements of changes in policy. By the time the announcement is made, it's already too late.
Forward Guidance as a Tool
Central banks have discovered that controlling expectations is just as effective as controlling policy directly. In effect, once the Fed announces they "expect to lower rates three times this year", markets instantly begin to change their expectations for future interest rates even before the first rate cut actually occurs.
That’s why some traders devote a significant amount of time to closely examining the language and word selection in FOMC statements. If the Fed substitutes “considerable” for the word “some”, that signals them to expect more dovish behaviour. Likewise, if the Fed uses “ongoing increases” where it could have used “any additional increase”, traders also interpret that as a dovish signal.
The uncertainty embodied by Fiscal Policy is far greater than that of Central Bank Policy. Politicians have been known to make very bold promises, e.g. the originally proposed $2.2 trillion OBBB Act, only to end up delivering less than expected, the final OBBB Act passed for $1.8 trillion. This has necessitated that markets constantly adjust their prices based on a lack of clear communication from political leaders as to their level of commitment to policy implementation.
Reading the Signals
When observing monetary policy, keep an eye on :
-
What comments Federal Reserve members make, and whether they will be voting members for the year or not.
-
What changes are being made to the dot plot, where federal officials expect interest rates to be at the end of the calendar year?
-
The minutes of the previous meeting will include details on the votes that took place.
When tracking fiscal policy, follow:
-
Undergoing Bill Markups - what items made it out of the committee and into the final bill, and what were cut.
-
Vote margins - narrow vote margins indicate uncertainty on how to implement the bill once passed.
-
Executive actions are available to the President without going through the legislative process. Budget Reconciliation timelines - when to expect the next big spending bill.
Positioning for Surprises
Policy surprises can happen from time to time. An example of a surprise event could be if the Federal Reserve cuts rates by 50 basis points instead of just 25 basis points, or if a tax provision is included in an OBBBA abbreviation for Personalised tax longer name. These types of events can produce larger stock price movements because the market assumes one side and the actual rate change triggers stop-loss orders, which creates forced buying and momentum is driven higher.
Some capital should be put aside to accommodate the events stated above, so you can react accordingly if your original assumption is proven incorrect.
Global Monetary vs Fiscal Policy: How Cross-Country Divergence Moves Markets
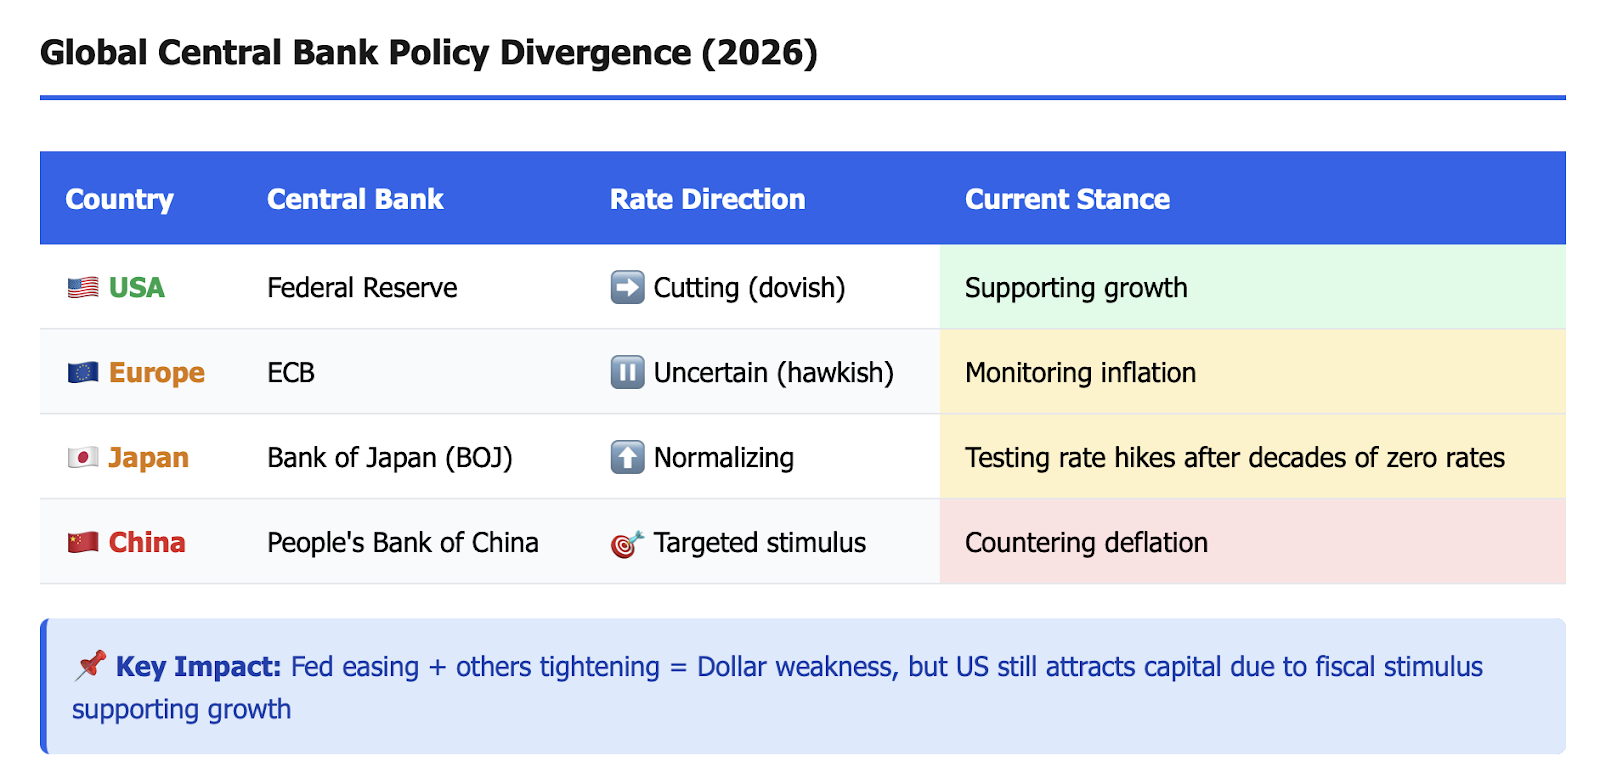
Policies are interconnected. The decisions made by the Federal Reserve have a ripple effect throughout Europe, Asia and emerging economies, so an understanding of how global monetary policy compares to fiscal policies will be important to successfully navigating the landscape of 2026.
Synchronising Policies as Opposed to Diverging Policies
During the time period following the worldwide pandemic, we saw central banks all take the same actions, with most printing additional dollars, cutting their interest rates to near zero, and running record levels of fiscal measures.
We are now in the phase of diverging monetary measures. The Federal Reserve is continuing to cut rates, while the European Central Bank is questioning whether or not inflation is actually calming down. Japan is starting to participate in "normal" monetary policies after almost two decades of keeping interest rates close to zero. Finally, China is in a period of deflation, yet it is utilising targeted fiscal policy.
The geographic divergence of monetary policy will create both opportunities and risks for investors.
The Effect of the U.S. Dollar on World Economies
When the Federal Reserve reduces its short-term interest rates, the subsequent result may not only affect the currencies being actualised versus the U.S. but will also produce liquidity issues for the rest of the world. A declining dollar will always help emerging countries meet their dollar-USD-denominated obligations. Commodities, which are generally quoted as U.S. dollar prices, should increase in price and therefore increase the willingness of many investors to invest.
If the Federal Reserve does not ease, while other countries decide to ease, the U.S. will appreciate, and emerging markets will find it much more difficult to pay back their dollar-denominated obligations. Due to the exportation of inflationary pressures on the developed world, global growth will also be negatively affected.
In the present time, with the Federal Reserve lowering rates and the U.S. being fiscally supportive to world economies, the U.S. economy is creating a positive opportunity for world risk assets.
Cross-Country Fiscal Differences
Because of restrictions put in place by the EU, European countries cannot utilise stimulus packages akin to those being used by the United States. Germany is exceptionally prudent with its expenditures because of its cultural view towards debt.
Consequently, even if the ECB reduces rates as the Fed does, European growth will likely lag behind that of the US through 2026 and 2027, primarily due to differences between fiscal policies.
These facts lead traders to conclude that:
-
U.S. Equities will outperform European Equities
-
EUR/USD will have significant headwinds because of growth differences
-
U.S. small caps are expected to outperform all other developed international markets.
Carry Trade Dynamics
Interest rate differences between nations are what lead to massive capital flows, and right now, there are clear incentives due to the respective interest rates: Fed - 4.25%; BOJ - 0.10%; ECB - 3.75%. These rates dictate that a trader would borrow Yen (the cheapest currency) to buy Dollars or Euros, which creates the carry trade - it has become huge in 2026.
The risk to traders is the possibility of a sudden change in monetary policy. If there is an unexpected increase in rates by the BOJ or a quick decrease in the Fed's rates, the trade will unwind, and it did have a recent preview when BOJ officials discussed tightening rates in January - USD/JPY dropped 700 pips in just one week!
Monetary policy also has to take into consideration how much debt Japan's government has (250% of GDP), as it cannot afford higher interest rates without potentially creating a fiscal crisis. Consequently, the BOJ is going to maintain a loose monetary policy even though inflation is beginning to rise. Therefore, the fiscal constraint on the BOJ will determine how it sets its monetary policy.
Emerging Markets
US fiscal stimulus and Fed cuts are typically positive for emerging markets, due to loose global financial conditions, a weaker dollar, and higher commodity prices. However, the catch is that if US growth driven by OBBBA maintains inflation at higher levels and restricts how much the Fed can drop rates, then emerging markets may not fully benefit. Emerging markets require significantly lower US interest rates to prosper.
EM currencies and bonds can provide signals to the market for how US economic policy is expected to develop. If EM currencies and bonds are strongly rallying or are experiencing great value, then the market is expecting a continuation of easing in the US.
Conversely, if EM currencies and bonds are struggling to appreciate after Fed cuts, then this is likely to indicate that there are other factors that are influencing the market's performance negatively.
Building a Global Portfolio
Seek opportunities for international diversification rather than just thinking about a U.S.-only policy.
Examples of positions that may benefit from differing economic performance between countries:
-
Long U.S. equities; short European equities
-
Long USD/JPY (carry-type trade based on interest rate differences)
-
Long emerging market debt, assuming the Fed continues to cut rates
-
Long commodities affected by a weaker dollar and/or Chinese stimulus.
Ultimately, the goal is to have a solid understanding of what is taking place in countries around the world and how different types of policies impact other countries; thus, we can find investment strategies that capture the benefits of these different countries' economic conditions.
Conclusion: Key Takeaways Every Trader Must Know
By knowing how monetary and fiscal policies operate, you have a strong advantage when trading in the stock market in 2026.
The monetary policy of central banks can change overnight by lowering interest rates that affect all markets (eg, gold, bonds, cryptocurrencies). Your ability to react quickly to these changes will result in increased volatility, which provides short-term benefits.
Unlike the monetary policy, the implementation of the fiscal policy at the government level is a slow process. While the effects of the government's fiscal stimulus will take months to deploy, they will continue to influence the long-term trajectory of growth and inflation in the economy, eg, determining what sectors will experience growth vs decline.
The economic strategies that will be used in 2026 are already determined by the expansionary monetary policy actions taken by the Federal Reserve (Fed) to keep interest rates low while controlling inflation at the targeted level of 2% and the total amount of nearly $2 trillion allocated for infrastructure, defense, and green energy under the Omnibus Appropriations Bill (OBBBA) over the next five years.
The fiscal stimulus associated with the OBBBA will have a direct effect on the level of inflation and may affect the Fed's ability to cut rates any further. Additionally, because of the amount of Treasury bonds issued to fund the OBBBA, long-term interest rates may remain at higher levels even when the Fed reduces short-term rates through lower interest rates. The steepening of the yield curve demonstrates this ongoing tension.
For traders, each of these fiscal and monetary policy changes represents significant opportunities to make money. The disparity between the two policies creates volatility in the marketplace; therefore, the volatility created by fiscal and monetary policy differences results in the creation of many trading opportunities.
Traders can take advantage of this dynamic by trading the currency pairs that reflect relative differences in interest rates, investing in equities that will benefit from the fiscal spending of the OBBBA, or buying gold as a hedge against excessive inflation created by fiscal stimulus initiatives and policies.
Make sure to monitor the relationship between monetary and fiscal policy changes, as well as the different expectations of market participants regarding the effectiveness of monetary and fiscal policies, in order to determine your trading strategy.
TradeWill gives you real-time economic calendars, FOMC meeting alerts, and fiscal policy tracking, all in one platform. Stop guessing which policy matters today. Start trading with clarity.
Disclaimer: The content of the blog does not represent any position of Trade W, does not serve as any trading-related decision advice, and does not endorse any third-party.