

 Trade W

Using the OPCE deflator in investments is critical in determining success and should be understood by any investor. Below is the complete overview of this important economic indicator and how it impacts market movements.
What is the OPCE Deflator?
The OPCE deflator (official personal consumption expenditures) calculates inflation by measuring price fluctuations of goods/services which are typically purchased by the average consumer's household- Therefore, it serves as a financial thermometer, telling investors whether the economy is expanding or contracting.
While the Consumer Price Index (CPI) uses a standardised bundle of items to calculate inflation, the OPCE deflator allows for changes in the items that may be reflected in consumer spending patterns. For example, if beef prices rise, but consumers purchase chicken instead, the OPCE deflator captures this switch in purchases, whereas the CPI would not.
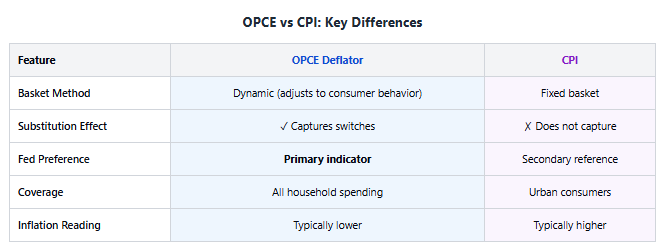
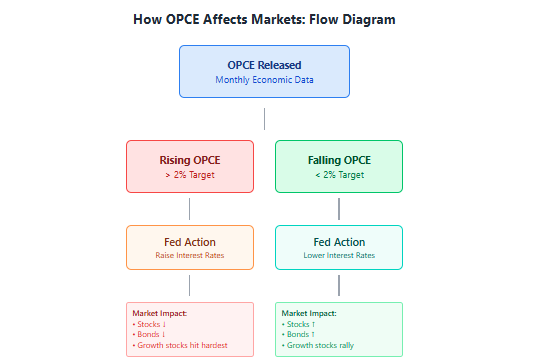
The Federal Reserve has a preference for using the OPCE deflator to establish interest rates because it reflects actual consumer behaviour. Generally, when the OPCE deflator indicates inflation is exceeding the 2% target that it has set, increasing interest rates usually occur. Conversely, when the OPCE deflator shows inflation decreasing, reductions in interest rates may happen.
Simple Illustration: Assume that last year your desired snack was priced at $3 and this year costs $3.30; this is an increase of 10%. The OPCE deflator will track these annual cost fluctuations with thousands of products in order to create a comprehensive picture of inflation.
The OPCE Deflator is important to an investor since it offers insights on potential actions by the Federal Reserve. A potential increase in the level of inflation points towards an increase in interest rates that tend to negatively affect the value of stocks and bonds; on the other hand, if inflation levels drop, typically, the market responds positively with increased valuations.
The primary distinction between PCE and OPCE: OPCE specifically removes the effect of quantity, making it a more accurate representation of pure inflation.
.How the OPCE Deflator Is Calculated
You can calculate OPCE Deflation by taking the total dollar amount of Personal Consumption Expenditures (PCE) and dividing it by the Real-PCE and multiplying that by 100. This way you can see how much the cost of goods and services has increased in price from what consumers are actually buying.
The calculation breaks down like this:
The Bureau of Economic Analysis collects data on PCE by separating it into different categories (Food & Beverages, Housing & Utilities, Healthcare, Transportation, Recreation and Other Services) and weighting them according to how much a typical Household spends on each of them. Typically the largest amount spent on a category is for Housing.
Professional insight: The OPCE deflator is not the same as the GDP deflator because it only uses consumer spending rather than showing total business investment and government expenditures (the GDP deflator). This limitation means that OPCE deflator values are more useful when it comes to understanding a household’s inflation.
Let us consider a case where our school cafeteria keeps track of lunch prices each month during an entire year. For example, if the average price for a lunch in January is $5.00 and the average lunch price for the month of December is $5.25, the cafeteria has served an equal number of lunches throughout the year.
The difference between the January average lunch price and December average lunch price represents a 5% increase solely as a result of increasing prices. This calculation will give an overall measure of price increasing for the entire economy, as demonstrated by OPCE.
One of the key advantages of using OPCE is because OPCE factors in substitutions, such that if people stop buying a more expensive food item such as steak and start to buy more chicken, this change in consumer purchasing behavior will be accounted for in the OPCE calculation, thus improving the accuracy of the OPCE as compared to fixed-basket measures.
In addition to the price of energy and food, which can fluctuate widely, many economists also monitor “core OPCE” measures which do not include those highly volatile categories. The core OPCE calculates a cleaner representation of inflation trends for both real estate and personal consumption without noise created by highly volatile price movements.
How the OPCE Deflator Moves Stock Markets
The performance of stock prices can change dramatically based on the U.S. Labor Department's Producer Price Index (OPCE) report , which helps investors make informed decisions about where the Fed will be taking interest rates. For example, when the OPCE comes in higher than expected, stocks generally drop in price as investors anticipate that the Fed will increase interest rates. Conversely, if the OPCE is lower than expected, it usually leads to a rally.
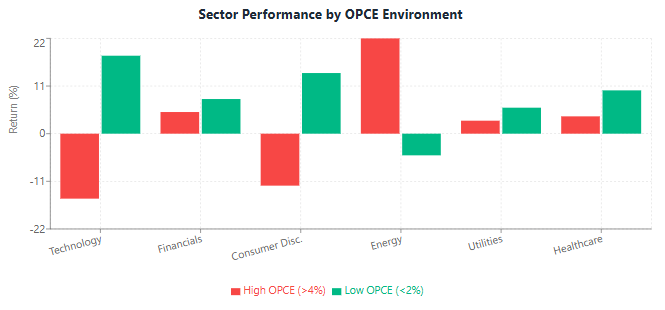
Technology sector (or Tech) stocks generally see larger movements than other sectors when the OPCE has a significant change. Technology companies such as Apple and Microsoft typically trade at higher multiples than other sectors, based on projected future earnings. If the OPCE shows a higher inflation rate, and subsequently the Fed raises the interest rate, the net present value of those future earnings will decrease. Therefore, in 2022 alone, technology stocks lost more than 30% in value because of rising OPCE and aggressively increasing interest rates by the Fed.
The financial sector (or Finance) includes banks, financial institutions, and real estate investment trusts. For banks, increased interest rates generally provide higher profit margins for the institution's lending operations. However, if inflation increases to such a high degree that it causes an economic recession, defaults on loans increase and, therefore, negatively impact the bank's profitability. Thus, the OPCE is also a tool that investors use to estimate which scenario may occur.
Consumer discretionary companies experience an adverse reaction to inflationary pressures. If the OPCE indicates that consumer prices are increasing at a faster rate than wages, consumers cut back on non-essential purchases. Therefore, companies that manufacture and distribute discretionary goods (for example, Starbucks and Nike) will see a decline in their quarterly earnings.
An easy way to illustrate this is to say that you receive $20 per week as an allowance, and then you find out your favourite snacks have almost doubled in price. Because of this, you may end up buying less or skipping movie nights altogether. As a result, the companies that sell those products will experience decreased revenue. This is similar to what happens to companies classified as consumer discretionary stocks when the OPCE spikes and indicates that inflation is running high.
Another important thing to consider is the timing of the OPCE release and trading activity around it. The OPCE is typically released monthly and traders tend to see increased trading volume when it is released. In fact, the S&P 500 Index has moved by at least one per cent up or down within hours of the OPCE being released if there has been a surprise OPCE number released. Savvy traders watch the OPCE calendar and position themselves accordingly prior to the OPCE being released.
As an example, the OPCE number for November 2023 was lower than expected (2.6% year-over-year), and the S&P 500 Index increased by 1.8% that day because traders viewed the lower number as an indication that the Fed may be able to pause its interest rate increases, therefore making stocks more appealing.
OPCE Deflator and Bond Markets
Inflation data is critical to bond investors. The OPCE Deflator tells bond investors whether their fixed interest payments will continue to have purchasing power or if rising prices will diminish the profit they earn from coupons.
When inflation is expected to rise according to the OPCE, interest rates (yields) increase because investors need a higher return to offset the risk posed by future inflation. Bond prices are inversely related to interest rates (Yields); therefore, when interest rates rise, existing bonds decrease in value, and one of the benchmarks used to set interest rates for other loans is the 10-Year Treasury yield, which usually rises between 10-20 basis points on releases of good OPCE news.
Example: If you lend your friend $100 at 3% interest for one year and the overall cost of living (or inflation) increases by 5%, then you've actually lost money because your net income would be negative; therefore, you would require a higher interest rate on the loan to receive a positive return. This is similar to the way in which bond investors respond to increasing rates of inflation from the OPCE.
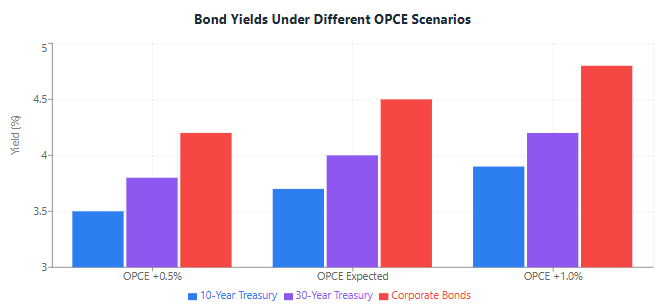
Because bond traders (professionally) are aware of the strong correlation between the OPCE and the price movements of the 10-Year Treasury bond, they will utilize OPCE outlooks and plan for them when making trades in advance of the monthly OPCE reports. If there is an unexpected rise in inflation, it may cost an investor up to seven figures (thousands of dollars) in a matter of hours after the OPCE report.
The expectation of interest rates being raised has more influence on bond prices than the actual change in interest rates. Therefore, if there is consistent upward movement in the OPCE for three consecutive months, then bond investors will start to price in the rate increase they anticipate from the Fed prior to that change occurring. As such, periodic releases of OPCE reports create volatility for bond portfolios.
Analyzing the Economic Climate of the US (March 2023)
In March 2023, the Consumer Price Index (CPI) rose to 4.2 percent, significantly exceeding the Federal Reserve's target of 2.0 percent annual inflation. This news caused the interest rate on US Ten-Year Treasury securities to experience an immediate rise from 3.5 percent to 3.7 percent. Bondholders realised that they would be experiencing less value in their holdings as prices fell to adjust to the higher yield.
Corporate bonds will take a more significant hit than Treasury securities. When the CPI indicates potential inflation, companies receive higher interest rates for new loans. Additionally, defaults will have wider spreads as investors require additional premiums for the inflation outlook coupled with the default risk.
In summary, long-term investors use CPI data to make informed decisions about whether they should keep holding on to bonds or look for other investments. As such, the CPI will guide investors' strategies when anticipating future economic conditions. For example, if the CPI indicates a prolonged period of inflation, stocks and commodities will likely outperform bonds. However, if the CPI supports a decrease in prices, bonds will become more attractive to long-term investors as a potential option to invest.
OPCE Deflator and Federal Reserve Policy
The Federal Reserve (Fed) closely monitors the OPCE Deflator compared to other economic indicators, viewing it as a principal indicator for assessing whether the Fed should change its monetary policy.
When the OPCE consistently stays above the Fed's 2% annual target, it is likely that the Fed will raise rates to slow down borrowing and spending, therefore lowering demand for goods, thereby lowering prices. On the other hand, if the OPCE falls below the target rate, it is likely the Fed will consider cutting rates to stimulate economic growth.
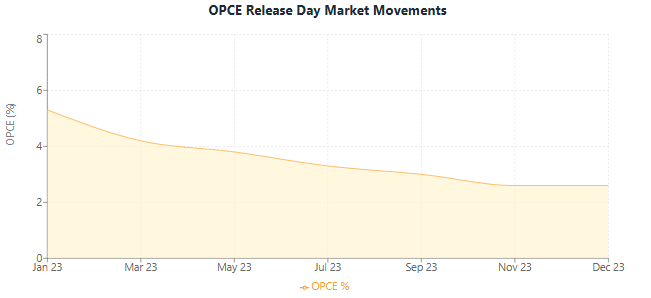
For example, the OPCE was at 5.3% at the start of 2023, which influenced the Fed's position of aggressively raising rates. The OPCE later declined to 2.6% by December 2023, providing the Fed with the opportunity to pause rate increases or consider lowering rates in the future. This shift greatly impacted investors.
To give a better understanding, consider running a school cafeteria. Suppose that lunch prices keep increasing, and that students have expressed their dissatisfaction regarding the price increases. In that case, you would likely stop purchasing the most expensive ingredients, which is like how the Fed utilizes interest rates to manage/influence both spending and inflation.
The Fed does not simply react to one-off OPCE readings. The Fed is looking for patterns in the OPCE's performance over 3 to 6 months of time. Thus, it is possible that one month of high readings could be proven false due to unforeseen circumstances; meanwhile, three consecutive months of high readings would be viewed as a persistent inflationary issue that warrants action.
The FOMC releases official pronouncements to provide information on OPCE data, and FOMC meetings result in public announcements made by the Federal Reserve covering the rationale for their monetary policy interest rate decisions (holding, increasing or lowering). In order to maximize market reaction to the Fed's monetary policy announcement, there is a lot of scrutiny of what was discussed during the meeting, specifically looking for evidence of any policy changes.
Analysts track OPCE data, looking for trends. If they see three consecutive months of cooling inflation, they start placing bets that the Federal Reserve will reduce rates, even before any announcement is made by the Federal Reserve. This provides opportunities to investors who are able to correctly predict Fed actions.
The timing of the effects of changes in Fed interest rates are also a factor in determining the timing of future monetary policy. When rates are increased by the Federal Reserve, the full effect of those rate increases won’t show up in the OPCE data for approximately 6 to 12 months after the increase. Therefore, the Federal Reserve has to make decisions on rate increases based on their outlook for inflation, not just the current environment.
Using the OPCE Deflator for Smarter Investments
Investing successfully requires following trends with the OPCE as well as knowing how each trend will affect the value of various assets.
Rising OPCE will cause an increased investment in stocks linked to value, commodities, and investments that offer protection from inflation. Increases in inflation will hinder the growth of both high-tech and growth stocks. Therefore, you should consider buying bonds with shorter maturities, as they will incur less interest rate risk.
When the OPCE is declining, the acquisition of long-term, growth-oriented stocks and bonds will become more appealing to investors. As inflation decreases, the Federal Reserve will be able to maintain lower interest rates; therefore the market will continue to push the prices of companies projecting future profits into the distant future, and attract additional investor purchases.
Many institutional investors base their strategic investment choices on quarterly rebalancing based on OPCE forecasts. An increasing trend with the OPCE may prompt an Institutional Investor to adjust their portfolio allocation from 60% stocks/40% bonds to 70% stocks/30% bonds, as an example, by investing a greater percentage of their portfolios in stocks that do well during inflationary periods.
To see an easy example, think of your monthly allowance being $50, and the likelihood that you will need to spend that $50 now if prices are increasing (high OPCE). However, if the expected prices of goods remain stable or decline, you can keep this $50 to purchase things later that hold the same value (low OPCE).
Another area of investing involves "Sector Rotation": Sector Rotation is a term that describes how to identify stocks that outperform their peers during periods of rising inflation (energy, materials), while at the same time, investing in sectors that provide defensive attributes during times of high inflation, and potential recession, (healthcare, utilities). In contrast, when the OPCE is low and stable, you will find that Technology stocks continue to perform well.
Bond Duration Strategy - In an environment of rising inflation as indicated by the OPCE, short-term bonds tend to outperform long-term bonds. Short-term bonds have less sensitivity to interest rate fluctuations than long-term bonds. Conversely, in a decreasing inflationary environment, as indicated by a decreasing OPCE, long-duration bonds generally provide higher returns.
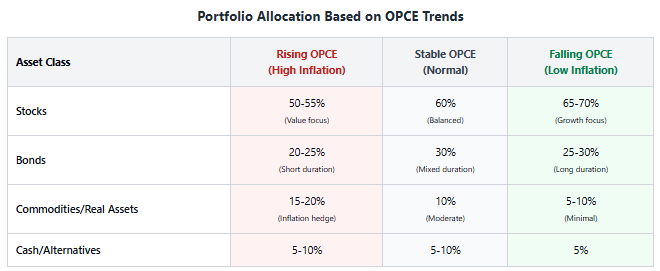
Examples of real-world application - A balanced investment portfolio may include a mix of 60% in stocks, 30% in bonds, and 10% in alternative investments. As an example, if OPCE increases for a consecutive three months, then a portfolio may reflect an increase to 65% in stocks (by adding value and commodity names), a decrease to 25% in bonds (being of shorter duration), and an increase of 10% in commodities or real estate.
Resist the temptation to make drastic changes to your portfolio based solely on one singular OPCE reading. Look for sustained trends in OPCE readings over 3-6 months prior to making significant adjustments to your portfolio. The underlying volatility of the monthly data may distort your perception if you do not allow for the time required for true trend recognition.
Historical OPCE Trends and Market Impact
Patterns identified through analyzing the historical OPCEs can help determine future OPCE trends. Since 2003 through October 2021, the OPCE Deflator has ranged between 0% (approximate) in 2008 during the financial crisis, to over 5% in 2022.
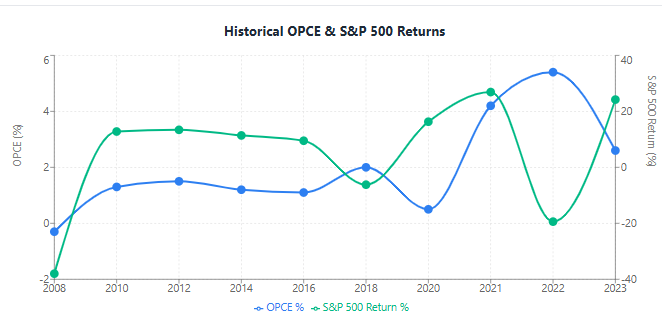
The 2008 crisis: In 2008, OPCE was actually -0.3%, which was largely due to demand collapsing during the crisis. Following the financial crisis, the Federal Reserve cut interest rates to 0% and began quantitative easing, resulting in a steep increase in stock prices beginning March 2009 and lasting for the next decade.
The 2020 pandemic: In 2020 when the pandemic was causing the shutdown of most businesses and consumers could no longer purchase products and services, OPCE was at 0.5%. Again, the Federal Reserve lowered interest rates to 0% and increased the amount of quantitative easing available to the economy by trillions of dollars, causing prices to rise rapidly by more than 4% in 2021, due to stimulus and supply chain disruptions.
The 2022 inflation surge: The peak OPCE reading of 5.4% in February 2022 was the highest reading in 40 years, causing the Federal Reserve to accelerate their interest rate rise on the fastest path since the 1980’s. As we can see from the timing of stock deliveries dropping 18% on the S&P 500, the losses for bonds were the worst in decades.
These three events throughout history demonstrate that the higher true OPCE readings over a period of time will trigger aggressive interest rate increases by the Federal Reserve and the resulting market declines. The longer-term trend of OPCE readings remaining low over the period of time will have the opposite effect on the economy and markets as the trend will lead to less restrictive policies and markets continuing to trend upward (bullish market).
Long-term trends: During 2010 - 2020, the OPCE averaged 1.5% per year, which was below the Fed’s 2% target and thus caused many companies to precisely overvalue their stock by supporting excessive valuation multiples through the inflation of stock prices and providing low bond yields. While the 10-year Treasury was consistently below 3% throughout this period, the majority of long-term meme stock buyers had to decide when it was difficult for them to purchase a stock on margin.
Simple comparison: If you have tracked your school lunch prices over several years and then compared them to food prices, you would see the majority of years had very little movement, while others were very large jumps of 10% or greater. This is similar to how the OPCE functions in relation to all industries within an economy, which helps forecast future trends.
The correlation between OPCE and stock market returns is significantly positive. In instances where the OPCE is at 1% - 2% for a year, a typical stock return will generally be between 10% - 15%. Conversely, if the OPCE is above 4%, the majority of stocks will show negative returns as the Fed continues to combat inflation.
Common Mistakes Investors Make
Many investors have misunderstandings about OPCE data, and they can incur significant costs because of those mistakes. Below are the most prevalent mistakes and how to avoid them.
Mistake 1: Many investors do not differentiate between headline and core OPCE. Headline OPCE includes the effects of volatile food and energy prices; whereas, core OPCE does not. Therefore, if there are spikes in headline OPCE due to an oil shock, that does not indicate that underlying inflation is out of control. Core OPCE is a much better measure of long-term inflation trends.
Mistake 2: Investors often overreact to on a single OPCE reading. Just because a single OPCE is hot does not make it a trend. Many investors react to one hot reading and subsequently panic; however, an informed investor should wait for confirmation from subsequent OPCE readings (2-3 months) before making major portfolio adjustments.
Mistake 3: Many investors confuse CPI with OPCE. The Federal Reserve targets OPCE; they do not target CPI. Therefore, even if CPI runs hot and OPCE does not run hot, do not assume that interest rates will be raised.
Mistake 4: Many investors trade on the day of the OPCE release. OPCE release days are often characterized by a great deal of volatility; therefore, knee-jerk reactions in the stock market often reverse themselves over the course of a few days. Unless you are in the professional trading business, it is better to wait until the market settles down.
In an unfortunate situation, if you went to buy your favourite snack one day and the price had doubled from the day before, it wouldn't be surprising if you were to panic and think that you may have to stop purchasing that product altogether. This is a classic case where an investor could very easily overlook the fact that, although one item has been affected by a temporary shortage, all of the other items have maintained their price stability.
An example of this type of behaviour occurred in January 2022 when a large number of hedge funds, based primarily on the results of the previous OPCE reading, placed large bearish bets on the overall stock market because of its recent decline. After making these trades, the overall market subsequently rallied for 2 weeks before continuing to drop again, resulting in forced liquidation of a large portion of the hedge funds that placed their trades as a result of the initial OPCE reading.
Mistake 5: Another common mistake is placing too much emphasis on one indicator (i.e. OPCE) and ignoring multiple other indicators as well i.e. unemployment, GDP, corporate earnings. It is very important to look at the "big picture". While OPCE numbers can provide a good idea about current and future inflation rates, other economic indicators are just as important in assessing the overall health of the economy. It is very important to understand that the context of the OPCE is equally as important.
Global Perspective on OPCE
All major economies have ways of measuring inflation. The U.S. OPCE gets the most attention, but understanding how these measures differ around the world helps investors with their allocation of capital in international markets (including currency).
The Eurozone uses the Harmonized Index of Consumer Prices (HICP), which is much like the Consumer Price Index (CPI), and the European Central Bank (ECB) has a target of 2 percent HICP inflation. Whenever U.S. OPCE and European HICP divergence exists, it generally provides an opportunity to invest in respective currency and international equity markets.
Japan tracks Core CPI as a way to gauge inflation, however, Japan has spent decades combatting deflation not inflation so the return on Japanese equivalents of OPCE tend to be below 1 percent and sometimes negative. This produces a vastly different investment environment compared to the U.S. since Japan has relatively few growth opportunities and resulting yield is generally very low.
For example, think of three school cafeterias in three different cities tracking the increase in price of their lunches. City 1 is raising prices by 5 percent per year, city 2 is increasing prices 2 percent a year and city 3 is having declining prices. Therefore, students in each cafeteria have different choices as to what to buy for lunch on a daily basis. Global investors also have this same type of comparison when investing in different countries.
The impact of currency: Generally, if the U.S. OPCE is higher than foreign inflation measures, the U.S. dollar tends to appreciate relative to most foreign currencies because of the Federal Reserve raising rates faster than other central banks do. This affects the total return on international equities for U.S. investors as losses from changes in the value of the U.S. dollar tend to offset gains from international equity returns.
Case study: In the U.S., OPCE reached a peak of 5.4% in 2022 while inflation in the EU reached 10%. The Federal Reserve initially raised rates much faster than the ECB, which caused the ECB to raise rates at an increasing rate to catch up to the Fed's pace. This contributed to significant fluctuations in the EUR/USD exchange rates and in European stock markets.
If an investor has an international portfolio consisting of U.S. stocks, European stocks, and Asian stocks, he/she should consider how OPCEs, HICPs, and the Japanese CPIs interact with each other and how these variables will affect the respective country's central banks as they develop monetary policies for their regions.
Key Takeaways for Investors
To successfully analyze and predict Federal Reserve policies, it is important to have a thorough understanding of inflation trends. The OPCE inflation deflator is a key tool in this effort. Here are some key takeaways:
Core Insight: The OPCE measures price changes to consumer spending more accurately than most other indicators, and the Federal Reserve uses it to guide its interest rate decisions; therefore, investors in both equities and fixed income (debt) cannot ignore it.
Portfolio Application: A rising OPCE suggests that defensive strategies with value stocks, short-duration bonds, and hedges against inflation will perform well. Conversely, a falling OPCE may favour growth stocks and longer-dated bonds.
Watch the Trends: Don't get caught up in the hype of a single month’s reading. Look for 3-6 month patterns of behaviour before committing to making significant portfolio shifts.
Keep the Big Picture in Mind: The OPCE is an important economic indicator but, of course, it does not paint a complete picture of the economy. When assessing how to allocate funds, investors should combine OPCE data with employment statistics, GDP growth, and earnings in order to gain a clearer view of the investment landscape.
Global Considerations are Important: Understanding the relationship between the OPCE, US inflation, and inflation in foreign countries provides an important advantage to those investing abroad and managing foreign currency risks.
Successful investors will utilize the OPCE Deflator as a guiding tool or compass rather than a crystal ball, enabling them to identify potential Fed actions and market consequences, resulting in better-positioned portfolios. By mastering this indicator, you will benefit from significant advantages when navigating the impact of inflation on your investments.
Ready to put OPCE insights into action? Visit TradeWill.com to access real-time inflation data, market analysis, and tools that help you build inflation-resistant portfolios. Start making smarter investment decisions today.
Disclaimer: The content of the blog does not represent any position of Trade W, does not serve as any trading-related decision advice, and does not endorse any third-party.