

 Trade W
Introduction
Have you ever seen a stock go through the roof so quickly that you have to wonder if it could keep going? That is what traders refer to as an "overbought" market - prices have gone up so quickly that the market might need a rest.
Think of it like a student doing ten practice exams in one night. Yes, they have a gained a lot of knowledge in a limited time frame, but their efficiency is about to crash. When everyone is buying for a reason, and prices are going up fast, it gets overheated, and it usually needs time to cool off.
For forex and CFD traders, being aware of overbought conditions is very important. It's not a guarantee that prices are about to crash, but it is a warning sign that they should be wise to. Whether you're just getting started with trading, or you've been doing it for years, knowing these patterns to make better trading decisions with less chance of being stuck in sudden reversals.
The S&P 500, has been overbought (RSI over 70) many times prior to large corrections. But overbought does not mean "sell everything right now." It means "be careful and think about your risk."
What is Overbought?
To break it down literally, “overbought” means totally what you think it means: Too much buying means prices have been pushed further above their "value" than they should reasonably be. It's like you are inflating a balloon too quickly – eventually, something has to give!
Markets can experience excessive buying in different ways:
Stock Market: Investors have piled into a hot stock, and the price has moved well beyond what the fundamentals suggest is its actual value.
Forex Market: Currency pairs have been bought and sold a ton in one direction, and we see dramatic - but unsustainable short term gains (probably).
CFD Market: The same - but scaled up with higher leverage. Speculative positions can drive assets much faster into overbought positions.
Cryptocurrency: Here again, sentiment and news are the drivers, leading to wild price movements. A bitcoin that stays over 80 on the RSI during bull markets is common.
Try picturing eating ten burgers in one sitting. You are "over-full" and your body is not able to process that amount of food anymore. The market experiences something similar, it reaches a point where it has absorbed too much buying pressure too fast.
The most important thing to recognize is that "overbought" is not bad. It just means the market may need to take a break, or adjust in some way. It is a natural part of market cycles, and not a catastrophic problem.
How to Identify Overbought Conditions
Recognizing overbought markets is not a mystery - there are several tools that show you when this is the case.
Technical Indicators
-
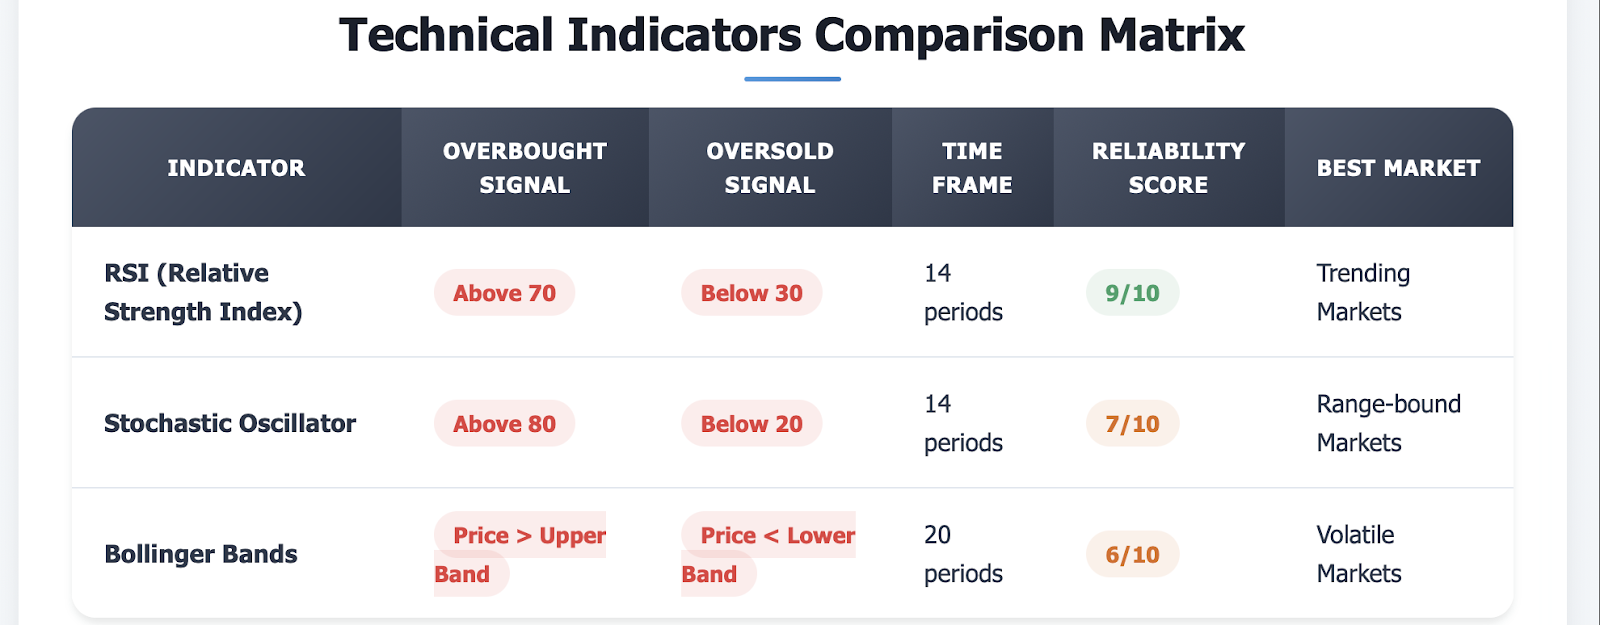
RSI (Relative Strength Index): RSI is the most commonly used indicator for most traders. When the RSI rises above 70, markets are generally considered overbought. RSI measures the speed and change of price movements between values of 0 and 100.
-
Stochastic Oscillator: Similar to the RSI, but overbought conditions are indicated if readings are greater than 80. The Stochastic Oscillator compares the closing price of an asset to its price ranges over a particular time frame.
-
Bollinger Bands: If prices pierce the upper band, it usually suggests the market was overbought. The bands widen and narrow based on volatility.
More Than Just Numbers
Technical indicators provide information but rational traders consider the bigger picture.
-
Investor Sentiment: Be careful when everyone is raving about how amazing an asset is. This is often a red flag
-
Media Hype: too much coverage can also drive prices beyond reasonable limits
-
Fundamental Disconnect: if a company's stock price does not reflect its performance, overbought conditions may be forming.
The Power of Combination
Here is where many traders make a mistake using a single indicator is dangerous, and could lead a trader to miss more significant trends and movements. For example, RSI might indicate an overbought market, but if the volume remains strong on the uptrend, the market could still push higher. It's like checking your heart rate while running. While you heart rate may be elevated - if you are in shape, you are probably still able to keep going.
Consider, for example, that EUR/USD had an RSI overbought reading when it exceeded RSI levels of 75, 2 up legs before it correct back down 5%. If a trader couple RSI with volume and potential trend indicators, they had a much clearer representation than just relying on RSI by itself. Using multiple indicators is much better. When you get multiple signals - it is more valuable to help indicate overbought conditions.
Overbought and market pullbacks
When markets are sheerly overbought, they are often going to need to take a breather. It's simply short term buying that has run out of buyers or gas. It does not mean the market is done going up - simply run out of buyers.
Types of pullbacks
Short term corrections: These constitute relatively weak pullbacks - price drops back to the mean/ moving average or price comes back to a support level meaning that prices would eventually go back up. Think of these as your taking a break on a longer trail or hike.
Longer-term Reversals: On occasion, overbought conditions signal the end of a trend entirely. Instead of pausing, the market changing habits will reverse direction.
The key word here is "often." Markets can remain in an overbought state far longer than seems logical (especially during strong bull runs). Bitcoin's 2017-2018 bull run is a great example - it remained in an overbought state for months before it crashed.
Why Do Pullbacks Happen?
When an asset becomes overbought, you can often expect several things:
-
Early buyers start to take profits
-
Late buyers become uncertain at higher prices
-
Technical traders are starting to look for sell signals
-
Market transition from greed to risk-off
It is essentially a balloon that has been overinflated too quickly; eventually, the pressure builds and needs to release pressure on the underlying asset.
Managing Expectations
Here is the important point - overbought signals are not immediate trading signal, they are risk alerts. They are telling you "hey, be careful here" not "sell everything right now". Smart traders will use these alerts to manage their risk, not take some big bullish stance or react just because of that indicator.
What Traders Do When They Are Overbought
Traders do not see overbought conditions as buy/sell signals. Traders are viewing overbought status more as risk management.
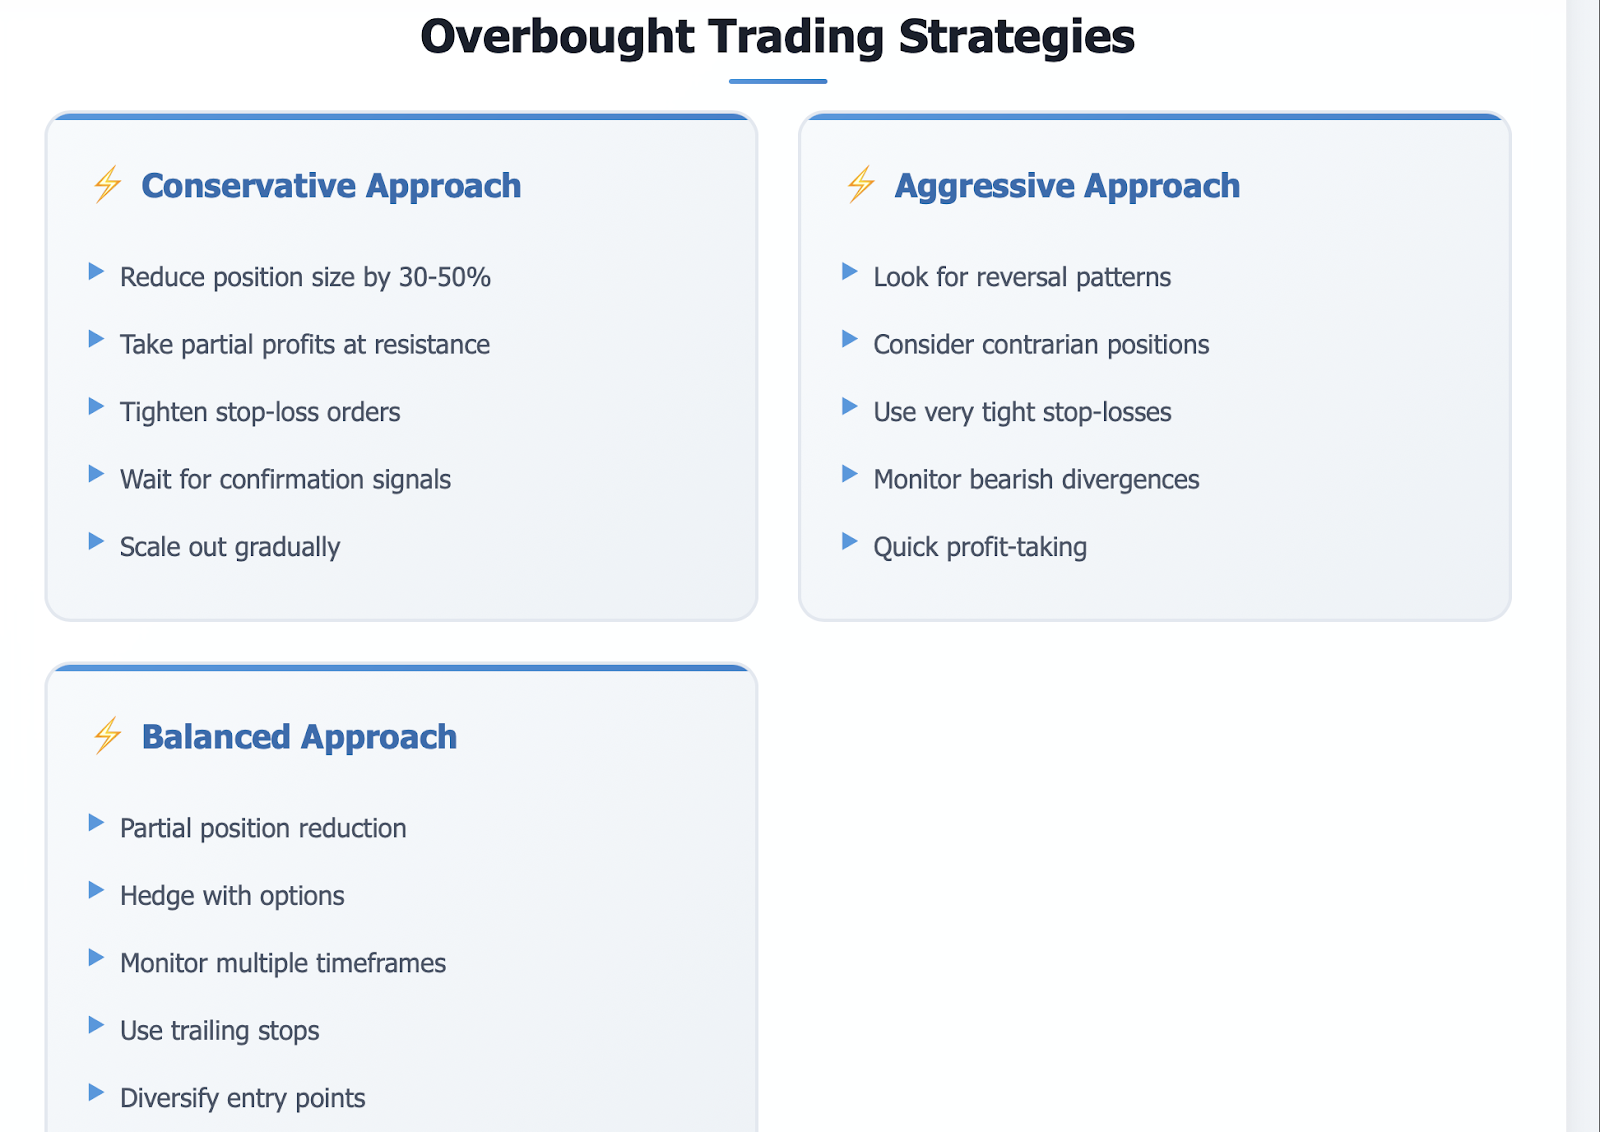
Conservative Strategies:
-
Position size: When assets enter overbought territory, a lot of traders reduce their position size. If the position is normally 5% comfortable, the trader reduces it to 3% for example.
-
Profit taking: Placing a take-profit order in an overbought territory is commonplace. The trader is effectively saying, "if we get to these levels, I'm happy to book some gains."
-
Tighter stops: Moving stop-loss levels closer to current prices is one way to guard against a sudden reversal.
More Aggressive Strategy
Some traders may utilize overbought signals for contrarian trades but are very cautious:
Waiting for confirmation: Instead of shorting an overbought market immediately, they wait for confirmations for the reversal, such as bearish divergence or a breakdown below important support levels.
Nevertheless, even with aggressive traders, using lose stops is important when they are betting against overbought markets. Markets can remain irrational longer than traders can remain solvent.
The Smart Combination
The most effective approach incorporates overbought signals with other analysis:
-
Trend analysis: Is the larger trend still in place?
-
Volume: Are people still actively buying?
-
Support/Resistance: Where are the levels of significance?
-
News Flow: Are there any fundamental reasons that would cause the price moves?
Think of a Forex trader who noticed EUR/USD was hitting RSI 75. Rather than immediately selling, they cut their position size in half and moved their stop loss closer. When the pair eventually retraced 3%, they still kept most of their gains while permitting the uptrend to advance.
It's like a teacher telling a high achieving student not to be too comfortable. The note shouldn't signal impending doom, but rather to promote good habits that extend future success.
Common Misunderstanding and Noted Caution
The greatest sin that traders can make using overbought signals? They can use them as crystal balls instead of a caution sign.
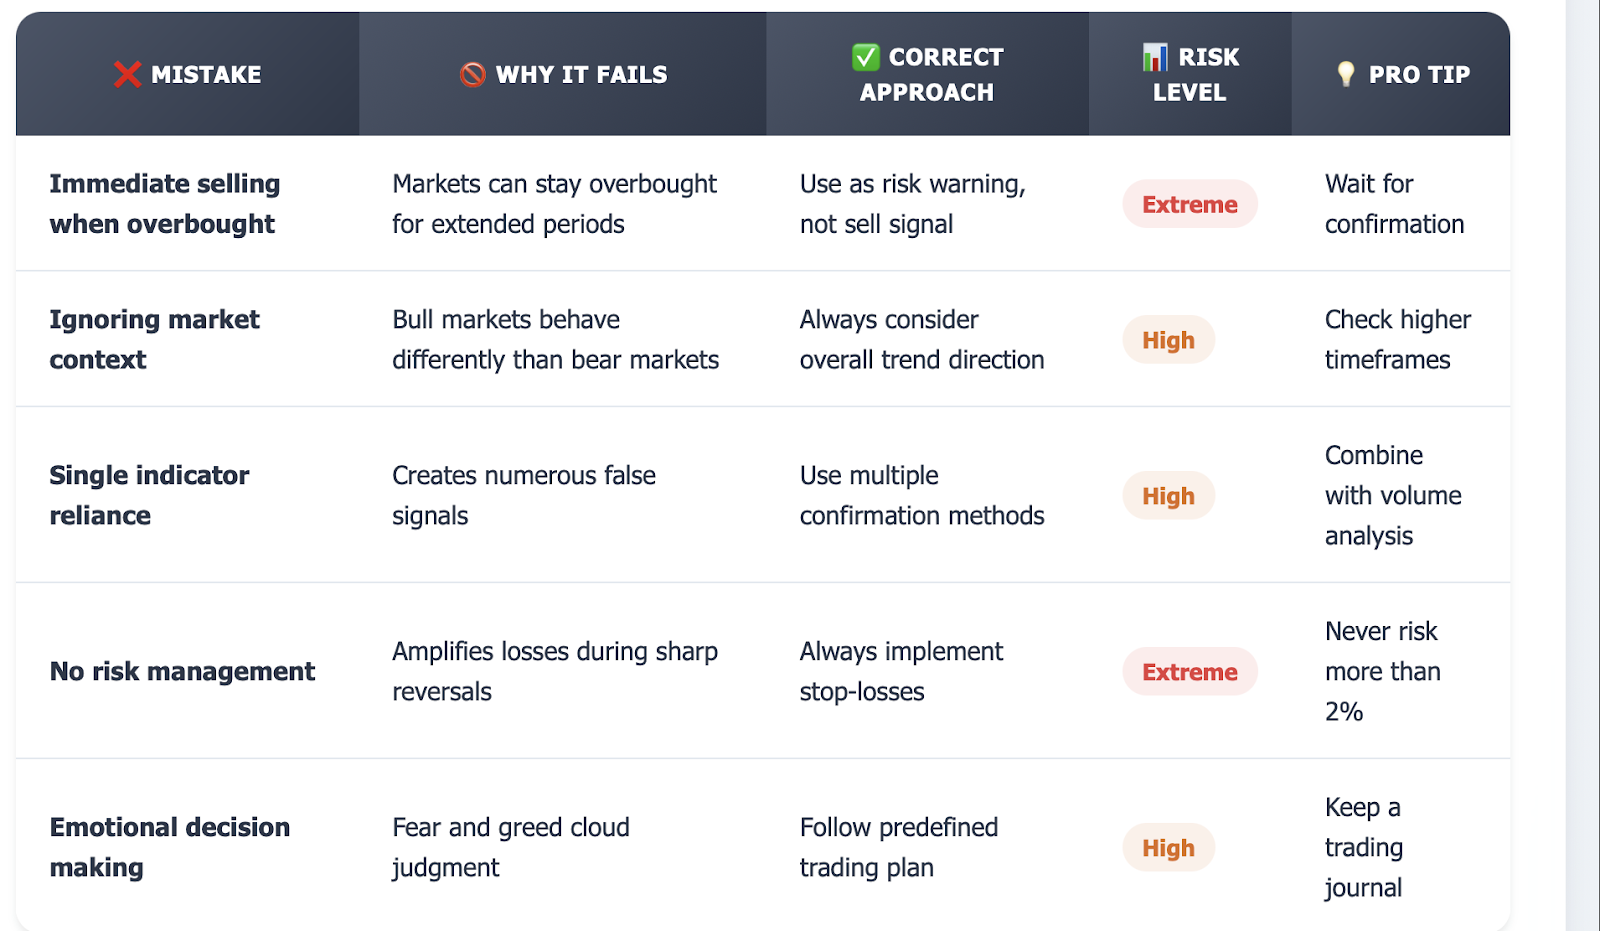
Mistake 1: Overbought Means Immediate Drop
This one is probably the biggest money loser misconception in trading. Markets can stay overbought for a long time, especially in strong trends. The recovery of the U.S. stock market in 2020 is a perfect stewardship - stocks were overbought (RSI above 70) for several months while continuing their ascent.
Mistake 2: Losing Sight of the Bigger Picture
An overbought reading in a strong bull market has a different meaning than one in a sideways or bearish trend. It's essential to maintain context. A stock may be overbought in an uptrend, but it may just be resting before it breaks higher.
Mistake 3: Too Much Single-Indicator Focus
Only using RSI, or Stochastic is like driving a vehicle and only looking at your speedometer. You need to look at the whole dashboard - volume, momentum, additional trend indicators, support & resistance, and fundamental analysis.
The Realities
Traders who are trading for a living and have experience trading understand that overbought conditions are inherent to healthy market cycles. They don't freak out when they see an overbought signal, nor do they blindly fade it. They will acknowledge the signal, manage their risk, and watch for confirmation signals..
The important thing to remember is to not treat overbought indicators as the sole picture, instead treat it as a piece of the whole. Markets are complex systems that are subject to an overwhelming amount of influences - indicators are one tool used to aid the investment process; they are not the crystal ball.
Conclusion
Knowing when an asset is overbought can really help, but only if you know how to use that information properly. Keep the following in mind: An overbought condition is simply a signal of potential risk and does not necessarily mean a market will change direction immediately. The best indications of an overbought market are RSI, Stochastic Oscillators, and Bollinger Bands, but these indicators are much better when combined with trend analysis and appropriate risk management.
Above all, just because the condition of an asset is overbought does not imply "sell everything now", it means "be very careful and consider your risk". Use the information of an overbought market to help you reduce your position sizes, adjust your stops, and make you alert as conditions change.
Are you ready to use your overbought knowledge to make money? Try trading on a demo account at BTCDana.com. Our demo account will allow you to discover the art of trading without any risk! Our trading platform incorporates all of the indicators that can help you monitor assets for overbought conditions and will help you fight back!
Disclaimer: The content of the blog does not represent any position of Trade W, does not serve as any trading-related decision advice, and does not endorse any third-party.