

 Trade W
Understanding "Overbought" in Stock and Index Trading
You have seen it a thousand times before. A stock spikes 15% in just 3 days, it is the talk of the town, and you start thinking if this would be a good opportunity to buy or if you should avoid. This is where you can take advantage of understanding "overbought” conditions.
Let’s break it down in simple terms. When a stock or index is overbought, it has simply gone up too fast and too quickly. Like a rubber band, at some point, you have to figure that something is going to break. This does not mean that the stock is bad or that you need to panic sell. It means that the price of what many traders in the market deem reasonable has been eclipsed, and a pullback or correction is likely coming.
Why do these overbought situations occur? Two words: investor psychology. When rallies commence in the markets, a growing concern of missing out happens very quickly. This is not an unreasonable feeling, as there is a lot of FOMO (fear of missing out), if the underlying in the rally is relatively justified, more leads to more. Greed kicks in, and rational analysis goes out the window, and boom, you’ve got an overbought condition on your hands!
Here's a real-life scenario that caused significant losses for many traders. In early 2021, technology-heavy areas of the S&P 500 went straight up parabolically. Companies that had doubled already were doubling again. The RSI was screaming overbought, yet the party continued—until it did not. When the pullback occurred, it happened very quickly and caught those who bought at the top off guard, producing intense pain and losses in the process.
For beginner traders, think of it this way: a popular gaming stock jumps 20% upside during a single week after announcing news about a game release. The game may very well be amazing, but did the value of the company really go up 20% over the span of 5 trading days? Most likely not. This is your red light, calling out that this stock is becoming overbought.
The main takeaway that I want you to know is that an "overbought" state is a warning light on your trading dashboard. Consideration to pay attention to, check positions, maybe tighten up the stop losses—but it is not a "sell everything now" light. Professional traders look at "overbought" as one of several indicators, as a metric to pay attention to along with trend analysis, volume, and context of the market.
If you're trading individual stocks, the Nasdaq or other major index or trading leveraged CFDs, recognising overbought conditions can help prevent you from buying at the absolute worst time. In trading, many times, preventing a bad entry is more important than finding the best one.
Core Definition: What Does "Overbought" Mean?
Let's get away from the jargon. Overbought, in the technical sense, simply means that the momentum of the price has gotten ahead of itself. Most traders will gauge this by indicators that attempt to measure buying pressure and the velocity of price.
The most common and popular tool used? The Relative Strength Index, otherwise known as RSI. When RSI climbs above 70, that's when traders start to get anxious. Not because it means the stock is going to crash tomorrow, but because it means there probably has been a high enough volume of buying in a short amount of time that a pause or even a reversal is more likely to happen.
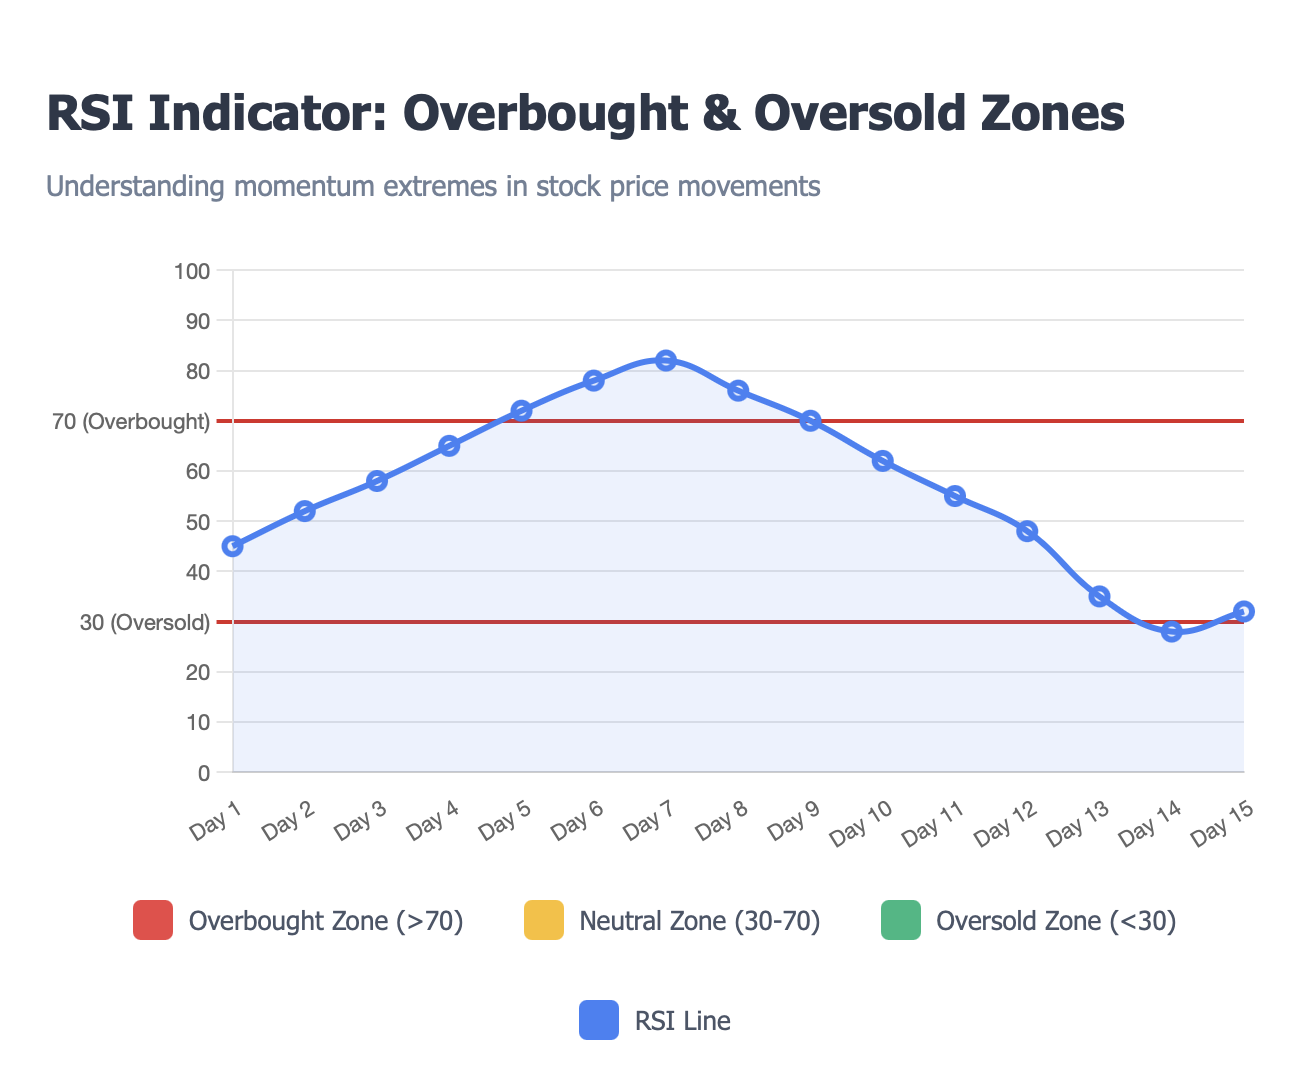
The way RSI works without the math headache is that it measures recent gains against recent losses over a time set (usually 14 days). When the gains begin to outweigh the losses heavily, they get a high RSI number, meaning that above 70 has been the traditional setting; some traders use 80 for a stronger trend to signal overbought.
An example is with Apple's stock. During a prominent cycle of a product launch, the stock may make an extremely strong rally for a prolonged period of time (duration weeks). When RSI hit a level of 78 during one of those product cycles, the pros were watching closely. Not because they were thinking Apple was a bad buy, but because the short-term momentum was showing signs of possible profit-taking. Sure enough, Apple consolidated for several weeks after that point before making a better subsequent trend.
The Stochastic Oscillator is another well-known indicator. It looks at where the current price falls in relation to the most recent range. You’ll typically see two lines (%K and %D) oscillating around one another. When they are both over 80, that’s another overbought indication. The advantage the Stochastic Oscillator has is that it can give you momentum shift indications before the price reflects that information.
The new beginner mind may be wondering, "Will this hot stock drop back down?" Yes, that is the right and good question. When a gaming stock that everybody loves jumps 25% in one week, your brain should absolutely be asking, Can this stay? The indicators give you some framework to collect your thoughts in order to bounce that thinking off data instead of just #emotion.
Here's the key to assessing overbought that most new traders miss: Overbought is a condition, not an order. Stocks can stay overbought for a period of time, sometimes weeks, while in strong uptrends. The indicator simply tells you that things are getting extreme, not that you need to sell everything right away.
It’s like looking for a fever on a thermometer. When the thermometer reads 102, you know something is not right. But you don’t just see the temperature and start treatment — you consider other symptoms, context, and trends. Same thing with overbought readings; it’s a symptom indicator that is diagnostic best when used as part of a more comprehensive diagnosis with other analyses.
The likelihood of a pullback does rise when indicators show overbought conditions. Historical data on the Nasdaq indicates that, when RSI is above 75, the index has a 65% likelihood of experiencing at least a minor correction within two weeks. That is helpful information, though not a certainty.
Overbought vs Oversold: Understanding Market Extremes
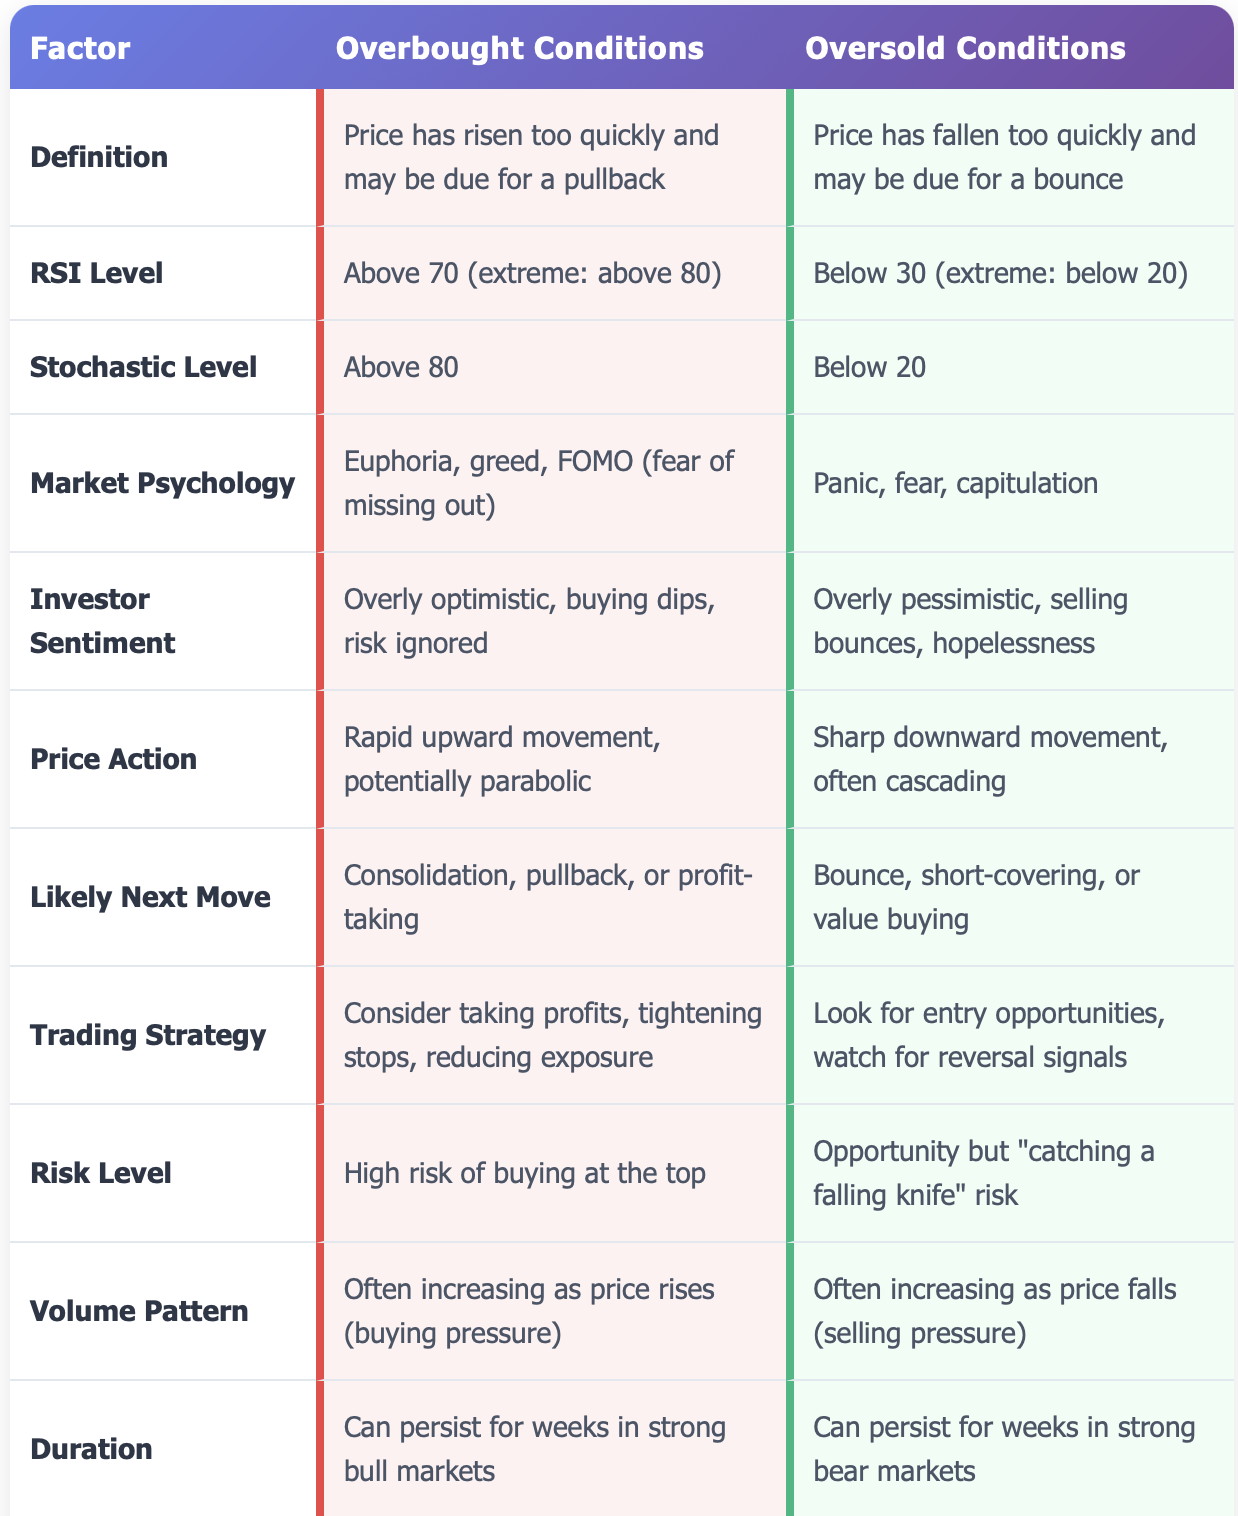
Financial markets behave like a pendulum, in that if they swing too far to one side or the other, the pendulum swings back in the opposite direction. Knowing the two sides of this spectrum, or at least two sides of it, helps you gain a great advantage in your investing.
Oversold is the mirror image of overbought, taking place as a result of panic selling, leading prices down quickly and excessively. When the stock or index price gets too low relative to recent price action, it becomes undervalued with a certain bounce expected. If overbought is an indicator of greed, oversold conditions are an indicator of fear.
Using the RSI again as a reference, readings below 30 indicate oversold conditions. Who remembers the financial crisis of 2008, when the S&P 500 seemed to drop every single day? The RSI sank into the oversold territory and stayed there for weeks. Some of the bravest investors bought throughout this period and made significant sums of money on the ride back up over the next 2 years.
Here is a recent example with some connection, if not a current memory. A popular sportswear company had negative headlines regarding some of the supply chain issues at the time, resulting in an 18% drop over 3 days. The RSI on this stock was at 25, with panic everywhere. Nothing fundamental against the stock had really changed, but the stock traders were panicked, as traders do sometimes - bear with me. A few weeks later and some buy signals were registering, lo and behold, the stock regained about half its loss after these movements.
That is oversold in action.
It is truly interesting to see the psychological differences at either extreme. When markets are overbought, the psychological environment is euphoric: dips are bought, optimism is in the air, and risk is something of the past. Conversely, during oversold markets, the psychological environment feels apocalyptic: bounces are sold into, pessimism reigns supreme, and hope feels very foolish.
Skilful traders learn to identify both market extremes and realise that they often suggest opportunity. When the crowd feels the most confident (overbought), it is to our advantage to practice being cautious. When the crowd feels the most fearful (oversold), it is usually a good idea to practice having courage.
Tesla's price history is a good example. This stock has ping ponged between both overbought and oversold conditions more than just about any major name. RSI in the late part of 2021 was over 70 on a consistent basis while the stock lifted. RSI was consistently oversold in late 2022 on sentiment decline. Traders who bought into the oversold dips and sold into the overbought peaks did very well.
The real skill is pattern recognition. Markets do not stay at extremes forever. An overbought scenario means profit-taking or exhaustion is coming. An oversold market means value buyers or short covering will come into play. The markets will revert to their means, which is one of the more reliable patterns.
One caution: markets can remain overbought and oversold for longer than you may expect in strong trends. The tech boom in 2020 saw many stocks remain overbought for months. To short those stocks solely based on a high RSI would have been a disaster. Context is critical.
Technical Indicators to Spot Overbought Conditions
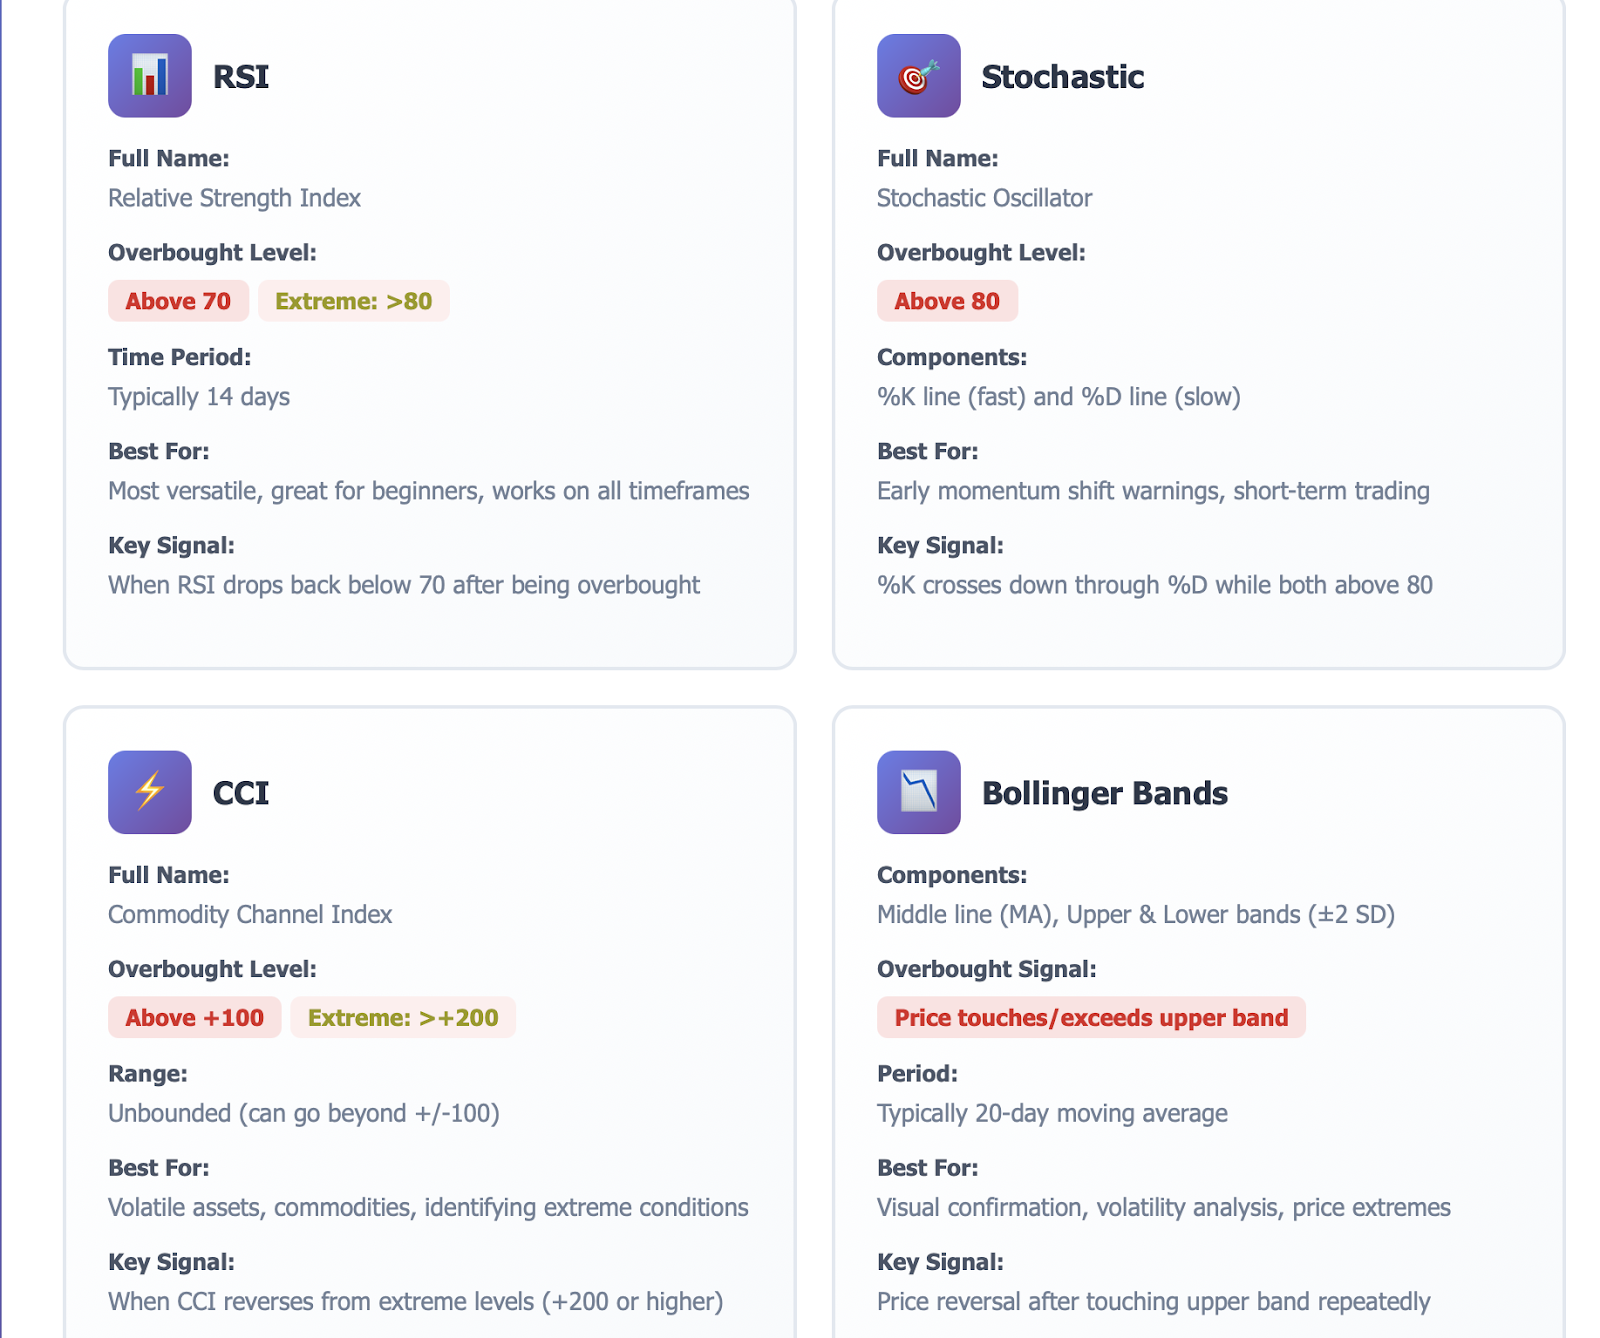
You can't trade what you can't measure. This is where technical indicators, such as RSI and the Stochastic Oscillator, play an important role by providing you with objective price momentum and potential extremes. We have already covered the implications of RSI in detail, but now, let’s discuss how to actually use RSI. Most trading platforms show RSI as a line graph below your price chart, oscillating between 0 and 100. You want to watch for this pattern: when RSI crosses above 70, make note of it. If RSI remains above 70 for multiple days while price continues to rise, the overbought condition is strengthening. When RSI returns below 70, you will have your first warning of a change in trend, if you are recognising the turn that is likely occurring!
The Stochastic Oscillator will give you a somewhat different view. It has a %K line that moves faster, and a %D line that moves slower. When both %K and %D lines are above 80, you have overbought conditions present. And here is the actionable part of this oscillating indicator: when %K crosses down through %D while both %K and %D lines are at 80 or above, you have a potential sell signal. The crossover simply means that momentum is starting to fade even while the price is still rising!
The Commodity Channel Index (CCI) is not as well-known, but it's still very useful. While CCI was originally developed for commodities, it does just as well on stocks and indices. When CCI is above +100, you are in overbought territory. Over +200? Extremely overbought. For example, during the Nasdaq's tech sector rally in 2020, we frequently saw CCI in the +150 to +200 range, which is something actively involved traders took into consideration for the possibility of corrections.
Bollinger Bands give a visual representation of overbought conditions. There are three lines here: a middle moving average line and upper and lower bands that are stated standard deviations from that moving average. When the price reaches the upper band or is above it, you might be overbought. The greater the price exceeds the band, the greater the extremes.
Here, a professional might look at the Nasdaq today; if you looked at RSI, is it above 70? If yes, then what does Stochastic look like when you have both lines elevated and a possible crossover? Look at CCI, is it above +100? Check if, price is hugging the upper Bollinger Band? Intriguingly, if three or four of these are all pointing in the same direction, confirming multiple indicators, to prove a point, the price is probably overbought.
To start off, for beginners, keep it simple. Choose one indicator—most users find RSI to be the easiest—and then just watch it for a couple of weeks. Pay attention to it in relation to the price, and you will begin to see patterns. There are many free charts and YouTube videos that will teach you, in about 30 seconds, how to add RSI to your charts.
Let's consider examples you have experienced. In 2020, because of its run, Tesla’s RSI was above 70 for weeks on end. Stochastic was in overbought territory for weeks on end. CCI was above +200 multiple times. Were any sell signals - no. The stock kept going up. However, when these indicators all went to the top at the same time and started pointing down, a subsequent correction of 15-20% was quite rapid.
Amazon has similar examples. With Prime Day hype or strong earnings reports, you can see all indicators flash overbought. Options traders who understood this would either exit all of their positions or, at the very least, tighten their stop losses to lock in some profits.
The takeaway - there is a long lesson to learn - don't just base your decision on one indicator. In the end, price can do whatever in the shorter time frame; you just want as many "pieces of evidence" pointing in the same direction as possible. You want to think of it like a jury; you just want several unbiased witnesses agreeing on the same story before you render a verdict.
Applying Overbought Signals to Stocks, Indices & CFDs
A theory is no good unless you apply it. Let's talk about using overbought signals in different markets.
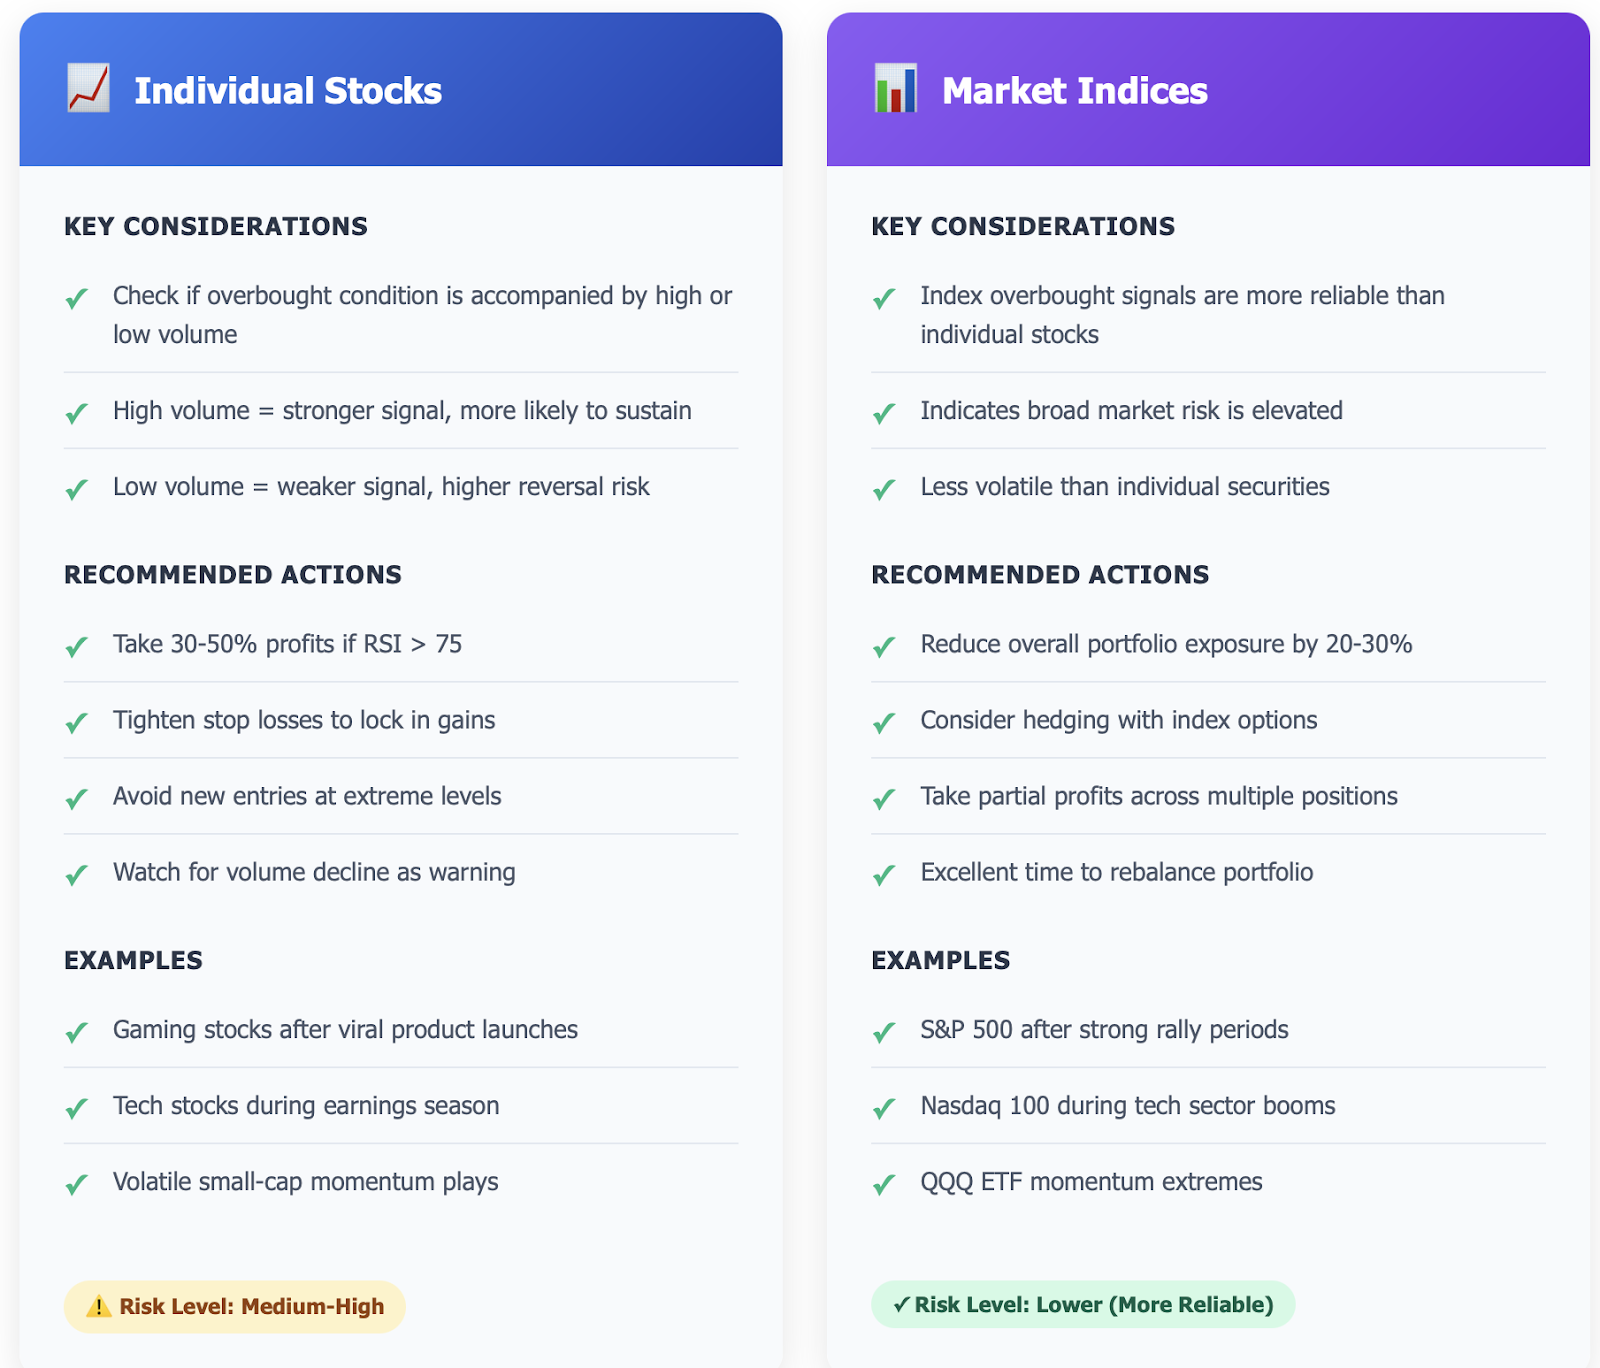
Individual Stocks: When a stock is reading overbought, always take a look at the volume associated with it. Is the price being propelled by heavy volume? Or is the price just "floating" on lighter volume? Overbought conditions developed on heavy volume are inherently more bullish because there is clear buying pressure taking place; we do not know if the volume is light and undisturbed. In fact, if a stock has a light volume overbought condition, the odds are much greater that it can reverse quickly, and if the RSI hits 75 with conviction on heavy volume, or even if it and the price moves with heavy volume, that would definitely be considered a more valid signal than RSI at 75, or even better if there is heavy volume and the volume is declining.
Market Indices: The S&P 500, Nasdaq 100, or Dow Jones typically do not move as wildly as individual tickers, or otherwise for large-cap stocks, do; therefore, overbought conditions are more valid on any major index than for some stocks. Especially when the overbought conditions happen on a major index, it really tells you that the risk of the whole market is elevated. This is your sign to either reduce position sizes across the board with each of your positions or to hedge with options on some positions. The same goes for the indices if you are measuring investors’ re-entry after a correction, as indices will show signs of short-term overbought/bullish moves. This is a perfect time to take partial profits on those positions.
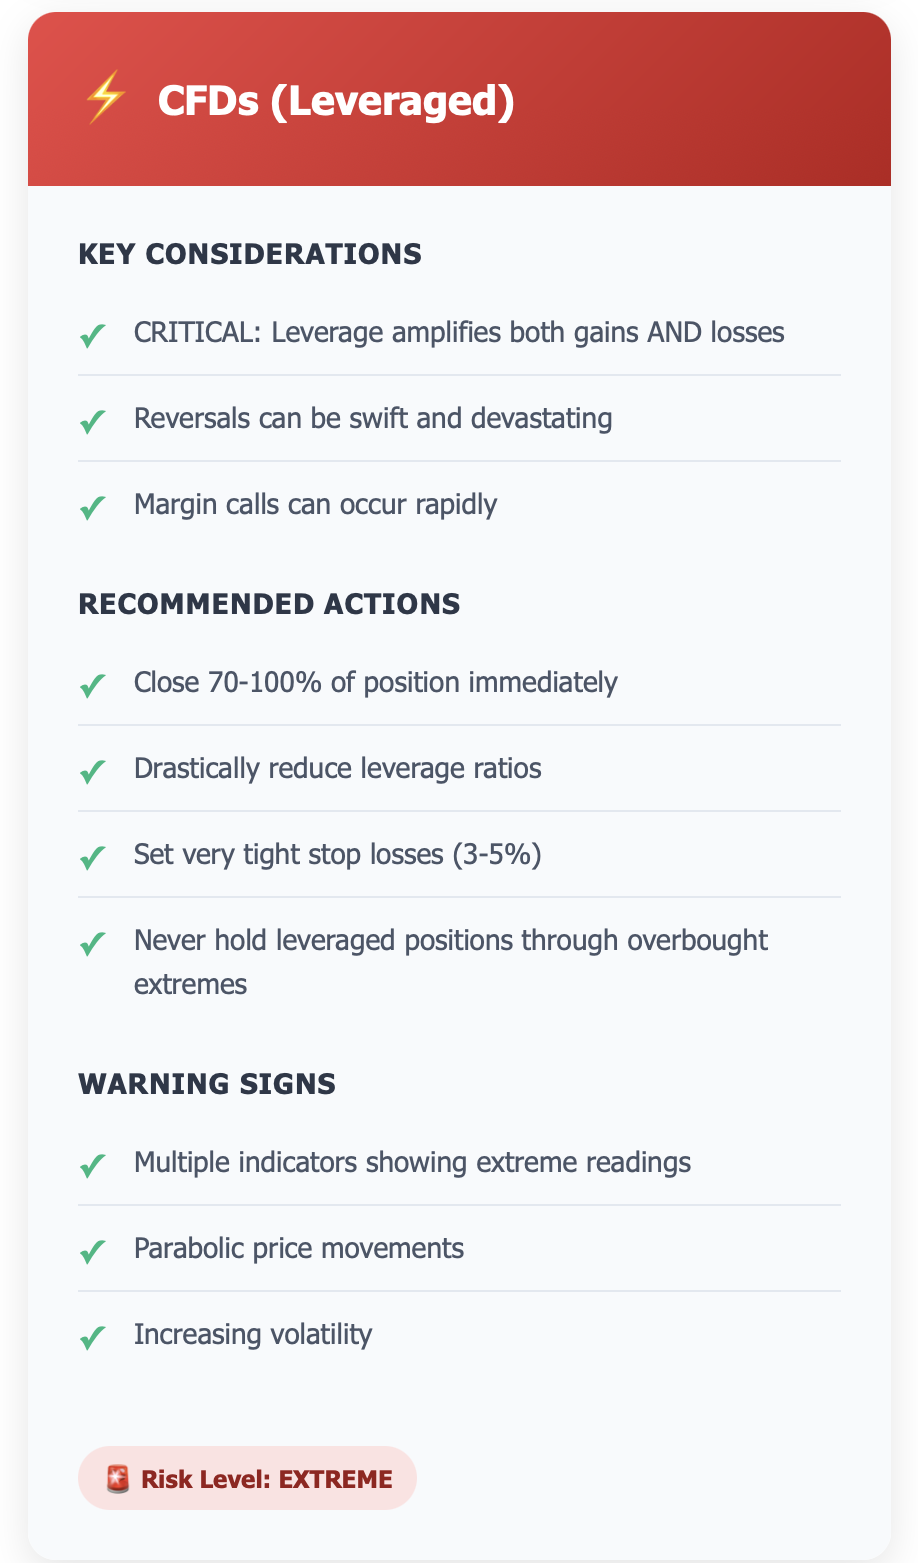
CFDs (Contracts for Difference): This is where overbought signals become important. CFDs are highly leveraged, where a 5% move against you can quickly wipe out 50% or more of your position. When trading a CFD on an overbought asset, you need extreme precision and management in your trades. Most CFD traders use those signals as automatic triggers to reduce their leverage or lock in profits instead of simply hoping the overbought asset will continue to rise. The nature of CFD trading brings significant volatility and, therefore, the reversals from overbought conditions can be fierce and swift.
Let's look at a practical example. The QQQ ETF (which tracks the Nasdaq 100) has moved up 8% in two weeks. Your indicators are all glowing: RSI at 72, Stochastic > 80, price at the upper Bollinger Band. What do you do?
If you already own a position in QQQ, you might lock 30% to 50% profits and let the rest ride with a trailing stop loss. If you are trading the QQQ CFD with some amount of leverage, you probably want to close the entire position or at least move to a very small leverage position. If your intention is to enter new positions on the QQQ, this is the completely wrong time to enter; you want to wait for a pullback or at least a consolidation.
The type of asset is incredibly significant. A conservative dividend stock that shows overbought on RSI is completely different from a volatile tech stock, or an equity that is related to crypto that has overbought readings. The tech stock is going to reverse faster, more sharply. You need to be flexible in your response.
Then there is sector rotation. In 2021, for example, tech stocks would become overbought, correct, then energy stocks would be overbought, correct, then financials, and so on. Realising which sectors are overbought allows you to rotate capital into sectors that have a greater risk-reward.
If you are practising on demo accounts (which you should do!), then just spend time watching overbought over the course of a few weeks. When you see an indication that it seems overbought, then look to see what happens over the next 1-2 weeks. You will build the intuition for how your chosen assets behave under extreme circumstances.
One last thing to note is combining an overbought signal and trend analysis. In strong uptrends, the overbought designation is less important because the stock will take a small pause and then continue higher. In weak or uncertain trends, however, overbought designation usually leads to bigger corrections. Context is everything.
Common Misconceptions About Overbought
Let's clarify the misconceptions that can result in financial losses for traders.
Misunderstanding 1: "Overbought" means you need to get out right away. This is the largest trap that beginners fall into. They see that the RSI hit 72, panic, and sell. Then, the stock continues climbing for another 15% the following month. Overbought is a warning light, not a stopping point. Many of the strongest trends remain overbought for extended periods of time. Tesla spent months being overbought during the biggest rallies in its history. Selling simply because the RSI was high would have lost the total amount of gains.
Misunderstanding 2: "Overbought" means the stock will rapidly decline. Stocks can correct by going sideways instead of down. After being overbought, the price may consolidate for possibly a few weeks; this allows the indicators to cool and the price to create little movement. A sideways action is healthy and could lead to another leg being higher afterwards. Not every overbought condition results in a significant reversal.
Misunderstanding 3: All of your indicators must confirm the trade before taking action. If you are waiting for perfect agreement across five totally different indicators, you will almost never take action. The markets are not perfect, and neither are the signals. It is okay for the RSI to show it is overbought and the Stochastic to show it is neutral. What you are looking for is the majority of indicators to agree on the direction rather than total agreement.
Misunderstanding 4: Overbought signals behave the same in any market condition. Overbought signals are acceptable and healthy during a strong bull market. In a bear market or a choppy market, overbought signals should be given more respect. A gaming stock that shows overbought in a bull market may consolidate for a couple of days to weeks and carry on higher. An overbought RSI reading during a bear market correction would typically signal further drops.
So how do you want to play it? I want to incorporate overbought signals with trend analysis, volume patterns, market conditions (E.g. good news versus bad news) and my time frame. If you are a long-term investor, a short-term overbought reading doesn't really matter if you are taking a long-term view. If you are a swing trader, they matter a great deal. If I have a strong overall trend that is bullish, why fight it just because my indicators say overbought?
Let's look at a real example: A trendy gaming stock increases in price by 30% in a week after a viral product launch. An RSI reading of 85 is achieved. All indicators say overbought. Social media chatter is building, and mainstream media has not yet even covered the event, and the volume is still climbing. In that case, knowing that it is overbought may mean "watch out" rather than "sell everything", and there still could be another 10-20% upside before exhaustion comes in.
The bottom line - overbought is information that is useful and valuable, but is just one data point. Your job as a trader is to mesh together multiple data points into a coherent decision that fits your strategy and risk tolerance.
FAQ: Most Common Questions About Overbought
What does overbought mean in trading? Overbought refers to an asset, such as a stock or index, that has moved up too quickly and could be priced above its fair price over the shorter term. Usually, when discussions of overbought conditions occur, technical analysis indicators like RSI, Stochastic, or CCI are utilised to discover overbought conditions by looking at momentum and price extremes.
Is overbought always a signal to sell? Not necessarily. An overbought condition can be a signal that conditions are extreme, but it does not mean to sell. Strong trends may remain overbought for weeks and months. For professional traders, signals of being overbought are just one component. There are many reasons to sell.
How might I determine overbought stocks or indices? The easiest and most common way to know is using the RSI indicator and looking for an RSI over 70 to identify an overbought condition. The Stochastic Oscillator is another option (if the Stochastic Oscillator is over 80,, it is typically considered overbought). In addition to this, another common tool is the CCI indicator (typically over +100 is considered overbought) or if the price touches or goes past the Bollinger Bands upper band. All of these indicators are available on most trading platforms at no charge.
What technical indicators are good for spotting 'overbought' conditions? RSI is the classic, both in its uncomplicated simplicity and in its reputation for reliability. The Stochastic Oscillator provides early warnings of shifts in momentum. CCI works particularly well for more volatile assets. Bollinger Bands provide visual context. Most traders will use two or three of those together rather than relying on just one.
Can we use 'overbought' signals in CFD trading? 100%, and especially in CFD trading! Due to leverage, 'overbought' signals can initiate sharp reversals that are much faster than preferred, or quickly eat through margin. Many CFD traders rely on 'overbought' signals as a trigger for risk management, either reducing position size upon initiation of 'overbought', or profits when an 'overbought' signal is determined.
Using Overbought Signals Wisely
You now possess the knowledge. The question is, will you use it wisely?
Knowing when a market is overbought won't make you a millionaire tomorrow, but you will see what mistakes could cost you a lot. You won't be chasing stocks at the worst possible time. You'll take your profits when everyone else is still being greedy. You'll manage your risk when you are trading with leverage.
Remember the most important lesson: overbought = pay close attention, but does not = you must sell it immediately. Look at the big picture. Look at the trend. Look at the volume. Look at the context of the market and then disengage emotionally, and assure yourself that you are making a decision to further your trading strategy.
The best traders always look at technical indicators in the same way we look at the overbought, in the case of loaded mining toolbox, even if somewhat different, technical indicators can be helpful, and sometimes simply offer a beneficial perspective, it isn't a magic bullet. A carpenter doesn't swing every tool at every nail; you have to pick a specific tool for a specific nail.
You will have numerous chances to practice your ability to recognise overbought conditions in the market. Some will result in rapid reversals. Others will settle into sideways consolidation. And still others will simply continue to rise up despite every indicator that says they should not. The diversity of outcomes is part of what makes trading challenging and interesting.
Your edge will be in identifying these types of patterns, knowing the context and responding appropriately to your individual situation and your goals. That is not something a blog post can teach you completely; it is an experience you create as you observe and practice purposely.
Ready to put your knowledge into action? Start identifying overbought conditions in real-time on Tradewill's demo platform, practice reading the signals, test your strategies without risk, and build the confidence you need before trading with real capital.
Disclaimer: The content of the blog does not represent any position of Trade W, does not serve as any trading-related decision advice, and does not endorse any third-party.