

 Trade W
Why "Oversold" Is a Key Concept in Stock & Index Trading
If you've spent some time looking at stock charts or reading market commentary, you've probably heard the term "oversold." What does it mean and why should traders be aware?
Simply stated, oversold is a condition in the market where prices have dropped too quickly or too much, in which case an asset may be considered temporarily undervalued. An analogy might be to envision a spring. If you push down a spring too quickly or too far, it will most likely bounce back. The same applies to stocks, indices, and CFDs. Buyers can face excessive selling pressure forcing prices down below their relative fundamentals, creating an opportunity for traders to capitalize on.
The concept of market psychology also weighs in heavily. Panic selling and herd mentality often push prices down faster than what any reasonable fundamental analysis might suggest. One investor sees one or two red numbers and sells, causing additional panic in other investors. Before long, everybody is rushing to the exits causing a price plunge. The emotional aspect creates the oversold condition in the market.
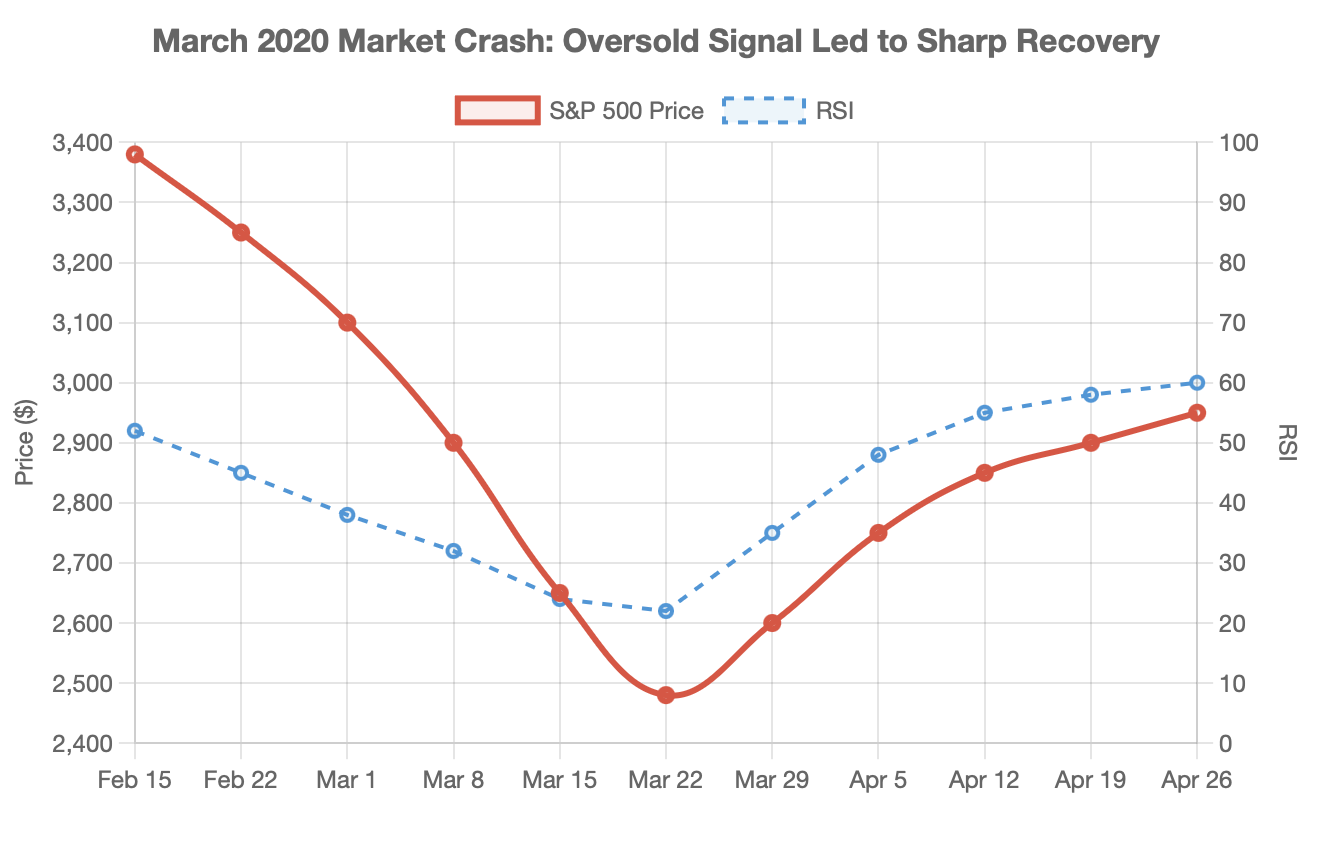
For an example from a professional setting: during the market panic of March 2020, the Relative Strength Index (RSI) of the S&P 500 dropped below 30, a classic oversold reading. What happened? The market rebounded sharply in the following weeks. Traders who recognized the oversold reading and had the stomach to get long were in a good position to profit from the ensuing recovery.
If you are just starting in the market, consider a popular gaming stock that has been going down for several days in a row. It is down roughly 20% from recent highs but the underlying company fundamentals have not changed, just negative sentiment. It is possible that the stock is now oversold and temporarily undervalued.
This is where it gets interesting: oversold signals are risk-averse signals or a heads-up, not an automatic buy signal. Just because something is oversold doesn't mean it automatically goes back in the opposite direction, possibly it does not go up at all. There could still be downward pressure, especially if the overall market is deteriorating in a negative direction, or if there are real problems with the fundamental piece of the financial asset.
It is important to recognize that oversold signals can be relevant across any trading instrument. Stock traders can use it to identify companies that are in oversold territory and likely preparing for a mini-recovery. Index traders can leverage oversold signals as an indicator of overall sentiment in the market or an entire sector. CFD traders, due to their customary trading with leverage, must pay particular close attention to the consequence of oversold signals and the potential volatility and risk of oversold positions.
It is valuable to consider that this concept is rooted in technical analysis and market sentiment. In other words, identifying an oversold signal is simply recognizing an occurrence in which selling pressure is likely extreme. The follow-up question is: is the extreme truly supported by real events, or have emotions forced the price move well beyond reasonable valuations?
Core Definition: What "Oversold" Really Means
From a technical perspective, oversold can be determined through specific indicators that measure momentum and price extremes. These indicators assist traders in quantifying what may otherwise be subjective judgments about whether prices have declined "too much."
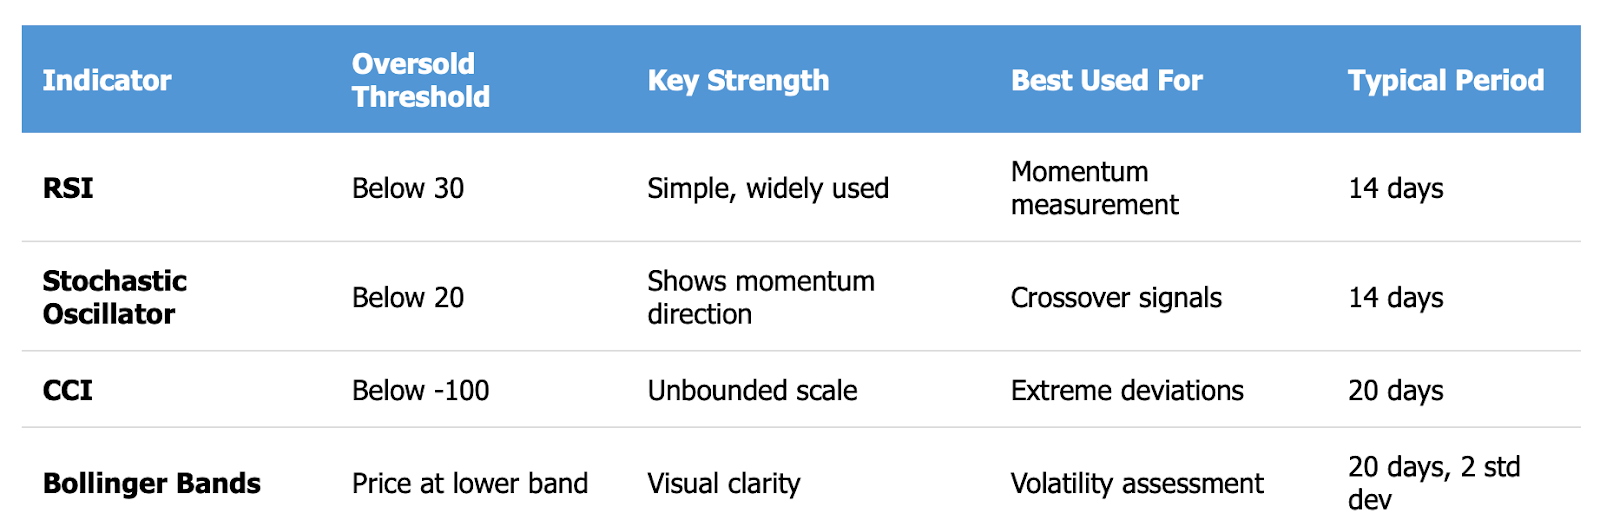
The Relative Strength Index (RSI) may be the most popular indicator for identifying oversold conditions. The RSI measures the magnitude of recent price changes over a scale of 0 to 100. Typically, when the RSI is at or below 30, the asset is considered oversold. The calculation compares average gains to average losses over a given timeframe (usually 14 days), and gives you an idea of whether buying or selling momentum is in the driver's seat. For example, an RSI of 25 indicates that selling pressure has been strong and may be getting tired.
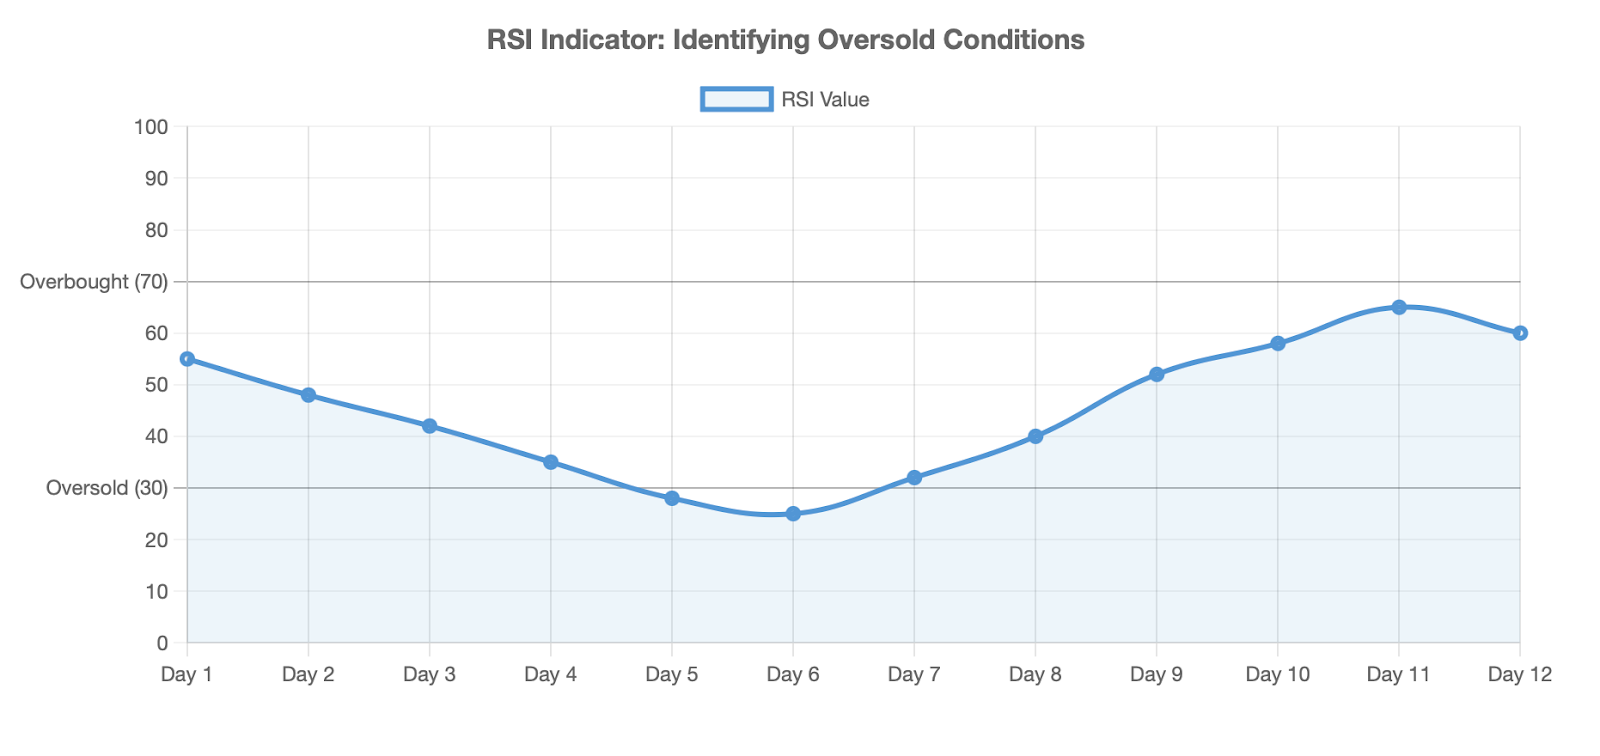
To illustrate, during periods that correspond to weakness in technology across the board, Pins have dropped-on occasion-to 25 or lower on the RSI. More often than not, these periods of intense selling pressure have led to short-term rallies as bargain hunters scuttled in. The key word, as in overbought, is "short-Term". In terms of market signals, oversold signals tend to be more relevant for near-term price movement versus long time horizon investment decisions.
The Stochastic Oscillator is a different perspective. This indicator compares a security's closing price to where it has traded over a specified time. It has two lines, %K and %D. When they both fall below the level of 20, the asset is oversold. Stochastic readings can be useful precisely because they do not merely show that prices are low compared to recent history, but how much momentum is behind that downward movement.
The Commodity Channel Index (CCI) gives us yet another perspective. CCI measures the extent to which prices are away from a statistical average. When CCI readings fall below -100, it suggests its prices are unusually low compared to price movement typically. CCI can denote rotations or oversold conditions, especially when used with other concepts.
Bollinger Bands also help visualize extremes in price action. These bands fluctuate in width depending on volatility, and create an envelope, or area around price action. When prices come into contact the lower band, it adds to the idea that price is oversold. As price comes close or touches the lower band, it looks more like price is extended to the downside.
The best way for beginners to become comfortable with these indicators is to practice. Open a demo trading account, and then observe a trending ETF over several weeks. When you notice a decisive drop, check the RSI, Stochastic, and Bollinger Bands. You will begin to see periods where all of the indicators are showing oversold conditions, and in the majority of these instances, they preface at least a temporary bounce, and sometimes more.
It helps to review some of the historical examples to further clarify these concepts. The tech rout of 2022 for the Nasdaq was a year when price declines were repeatedly characterized by oversold. The index fell for practically the entire year, but certainly there were multiple occasions that traders could have made profits by trading the bounces out of oversold.
Tesla has been another great example of security that has generated dozens of oversold signals over several years. Some of the oversold signals resolved quickly with sharp moves up, and other oversold signals tractor trailers moving down, but remained oversold the entire time.
The key take away from the above examples is that all indicators are simply references and there is no guaranteed crystal ball. Context is absolutely crucial. In a dominant downtrend, an oversold signal might simply be a pause in the downtrend. In a range-bound market, or by contrast, a general trend upward, an oversold signal carries a different level of resolve. It is also very important to be cognizant of the real-time context surrounding the trading environment of the oversold condition—was there a gap up or down, did the stock trade on extra ordinary volume, or is the oversold condition developing in a vacuum?
Overbought vs Oversold: Understanding Market Extremes
In order to understand oversold conditions well, you must understand the opposite of oversold conditions, which is overbought conditions. When a market is oversold, it means prices have dropped too far too fast—and when it is overbought, it means prices have risen too quickly and it is likely due for a pullback.
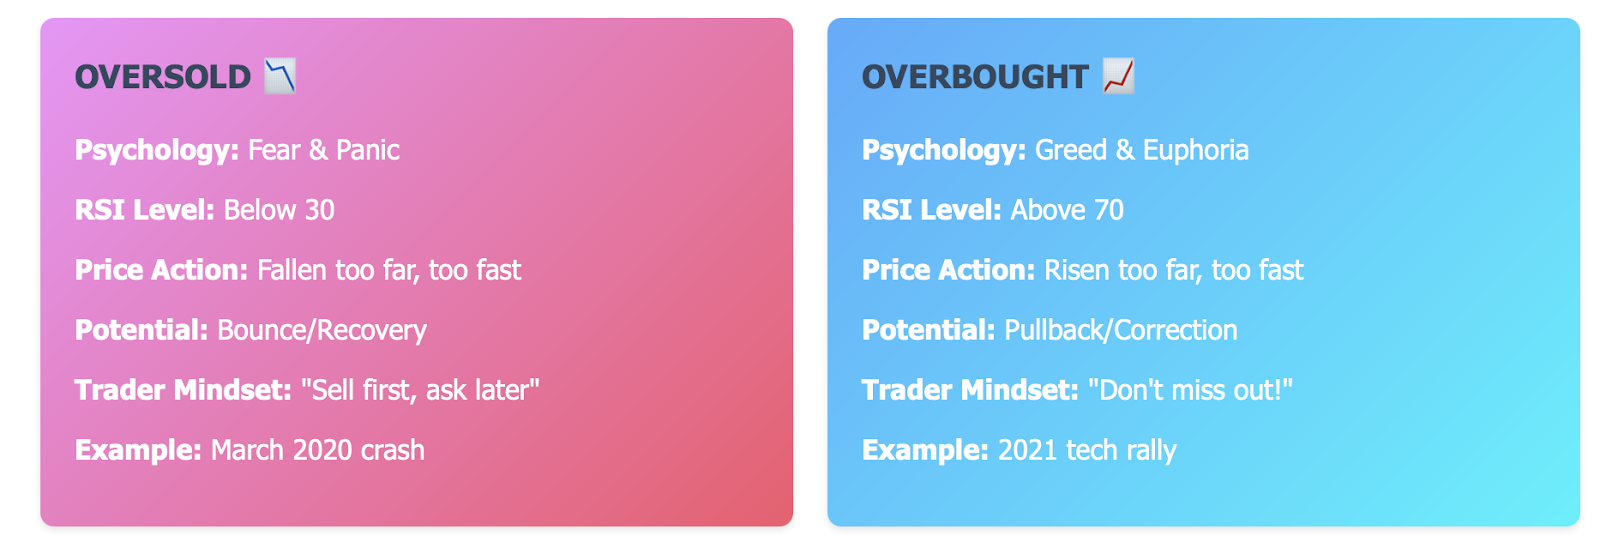
The psychology behind oversold and overbought are opposite sides to the same coin. Oversold markets are driven by fear and panic—investors sell first and then ask questions later. Overbought, on the other hand, is driven by greed and euphoria. Everyone wants a piece of the action and in this emotional frame, the prices can rise well above sustainable levels. Recognizing this emotional dynamic is very helpful to make a determination on when the market may be approaching a turning point.
When applying the Relative Strength Index ("RSI") as a follow-up measure, readings above 70 indicate overbought conditions and readings below 30 indicate oversold. In the contradictory of strong trending moves, both ranges risk being closer together than one may expect. Good strong trends become an 'outlier' and assets can be overbought for a long duration in a strong bull market. The same is true for oversold conditions in any bear market—quantitatively speaking, extreme oversold conditions can last weeks or months.
The S&P 500 at the beginning of 2009 is an illustrative example. During the financial crisis' apex, the S&P 500 became incredibly oversold. RSI readings were in the 20s. Sentiment was apocalyptic. But for traders that recognized this extreme and had the courage to take action, the accompanying market rebound offered significant opportunities.
The market wasn't going to come all the way back in a single day, but the oversold extreme created a generational buying opportunity. A second example would be a popular sports brand stock that gets a 40% rally in a few weeks due to strong earnings and positive guidance. The RSI reading has now crossed above 75. The stock is considered overbought. Do we know that it will go down?
Not necessarily, but it does mean that easy money may be over and profit taking will be underway in the weeks or months ahead. Historically, stocks that are overbought or oversold begin to revert back to the mean. The market is like a rubber band – it can only be stretched so far from the mean in either direction before it snaps back. The trick is finding the right snap back time line. For example, some rubber bands naturally stretch further than other rubber bands will before they break.
Both extremes are illustrated by Tesla’s activity. The stock is often in an overbought state during explosive rallies and it can also show oversold conditions during its often equally dramatic corrections. Simply buying the stock on every oversold signal and selling it short whenever it is overbought would yield mixed results for traders. The ones who succeeded in their trades took these signals and examined the broader trend, using risk management strategies.
The story with Amazon is quite similar. The stock was in a decline in 2022, and it went from a little over $170, to below $85 in several months. As it drifted lower, it became oversold many times. On each of these oversold signals, it bounced up briefly, but the trend remained down for months. Seeing the market extreme was helpful, but respecting the downtrend was more important.
The main learning here is simply identifying the extreme gives you an advantage, but not an absolute answer. The signal of overbought or oversold conditions is best when other components align, such as trend change, volume patterns or catalysts from fundamental analysis or broader market changes. There are pieces of the complete signal, there is not a complete signal.
Technical Indicators to Spot Oversold Conditions
Let us explore more deeply how you're going to apply these indicators in practice and their limitations.
As for the RSI, the straightforward approach is easy: below 30 means oversold, 70 above means overbought. However, it is common for experienced traders to adapt those thresholds depending on market conditions. For example, in a strong downtrend, you may want to shift your oversold threshold down to 20 to avoid being misled by potentially false signals. During a ranging market, the traditional 30 oversold level is generally still fairly reliable. As for the 14-day period, it is the standard, however shorter periods (for example 7-days RSI) will increase the responsiveness of the indicator, and longer periods will smooth out noise.
The Stochastic Oscillator adds another dimension to the mix by reflecting both the position of prices within recent ranges (%K), and the smoothed average of that position (%D). When both lines are below 20 and %K crosses above %D, it is often considered a bullish signal that denotes the oversold conditions are being resolved. Make sure to pay attention to those crossovers occurring before reaching normalization of the indicator. They may provide some of the earliest warning of potential crossovers than using RSI alone.
When CCI goes below -100, it signifies a departure from a normal price range. The unbounded nature of CCI means it can go all the way to -200 or -300 during a severely excessive price action. The further CCI goes below -100, the more exhaustion in the move is present. However, "exhaustion" does not mean that the price might not continue the move. After all, these markets can stay irrational longer than you can stay solvent.
Bollinger Bands have a certain visual plainness that seems to be palatable to traders. So when price "touches" or "pierces" the lower band (especially with a spike in volume that may propel the price below the Baulkier Band), the indication is that price is potentially oversold. A few traders then look for what is termed "walking the band," usually implying the price touches or even continually hits the lower band during a strong downtrend. However, this could also just define strong excessive selling, as even this pattern, while typically indicative of capitulation near, is not a certainty.
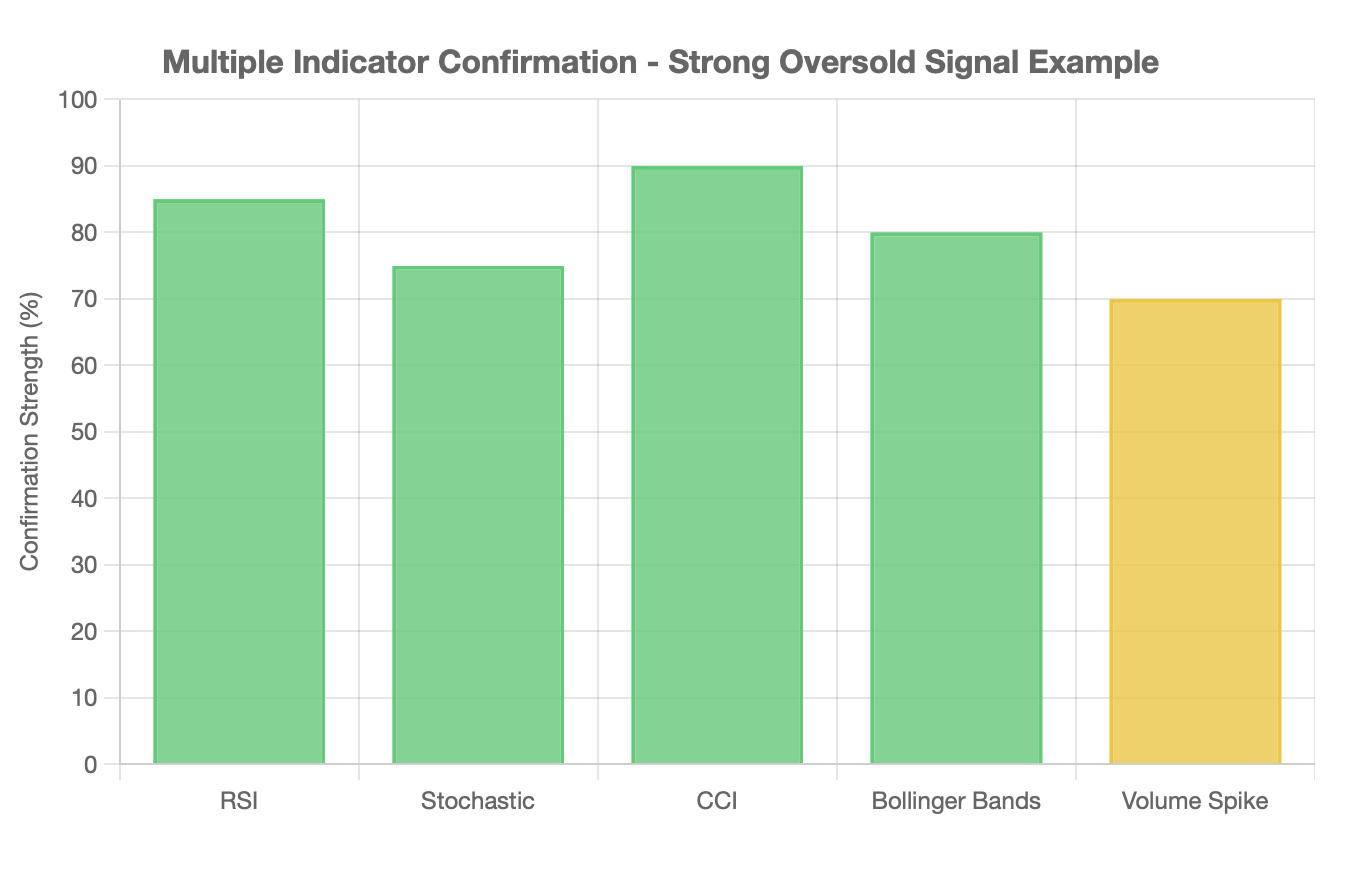
The real power, of course, comes when these signals combine. For example, while analyzing a Nasdaq tech stock, suppose the RSI drops down to 28, the Stochastics fall below 20 with both lines "down," and then the CCI indicator reads -150. So now you have price touching the lower Bollinger Band too. Ah! And then you notice a spike in volume, indicating panic selling at some extreme volume. When you combine these signals, you can increase the probability (significantly) of a short-term bounce compared to using just a single indicator alone.
As an example, in October 2022, several Nasdaq technology stocks gave these combined oversold signals at the same time after months of falling prices. A couple of stocks like Meta and Amazon had RSI below 30, Stochastic in the oversold area, and prices at their lower Bollinger Bands; a combination of oversold signals, and accordingly there was a bounce over a series of weeks for the stocks, or part of them, gaining 20-30% before the long term downward consideration returned.
For the beginner, keep it simple and operate within a demo account. Pick a popular Exchange Traded Fund (ETF) such as QQQ (Nasdaq 100) ETF, or SPY (S&P 500) ETF. Add RSI and Bollinger Bands to your chart. Over a couple of weeks or more, observe how the price reacts when the RSI drops below 30 and touches the lower Bollinger Band. As you analyze the price action, you will see that sometimes stocks will bounce sharply after an oversold signal but most of the time they will just drift sideways or continue to fall.
It is critical that you understand this risk - that a RSI will give an oversold signal but will remain oversold and a stock will just keep going lower. Stocks can definitely suffer from fundamentals that will ignore any past shows of support from any technical indicators. Perhaps the company has horrible earnings, something about their business model is disrupted, or the entire economy is in slower mode. Unfortunately, no technical will save you from missing the reality that is fundamental.
This is exactly why context is so important. Are we seeing oversold conditions in a stock that is in a long-term uptrend but has a temporary pull back, or are we seeing it during a bear market where stocks are grinding lower month after month? The same RSI reading of 25 results in very different conclusions in each of these scenarios.
Volume is also something that should be watched closely. If you see an oversold signal, along with declining volume, that should suggest that the move may be losing some of its momentum. Conversely, an oversold reading on increasing volume could indicate capitulation, which is the last wave of panic selling before a market reverses its present trend. Continue to watch volume patterns closely, as this can help generate possible opportunities and potentially avoid traps.
Applying Oversold Signals to Stocks, Indices & CFDs
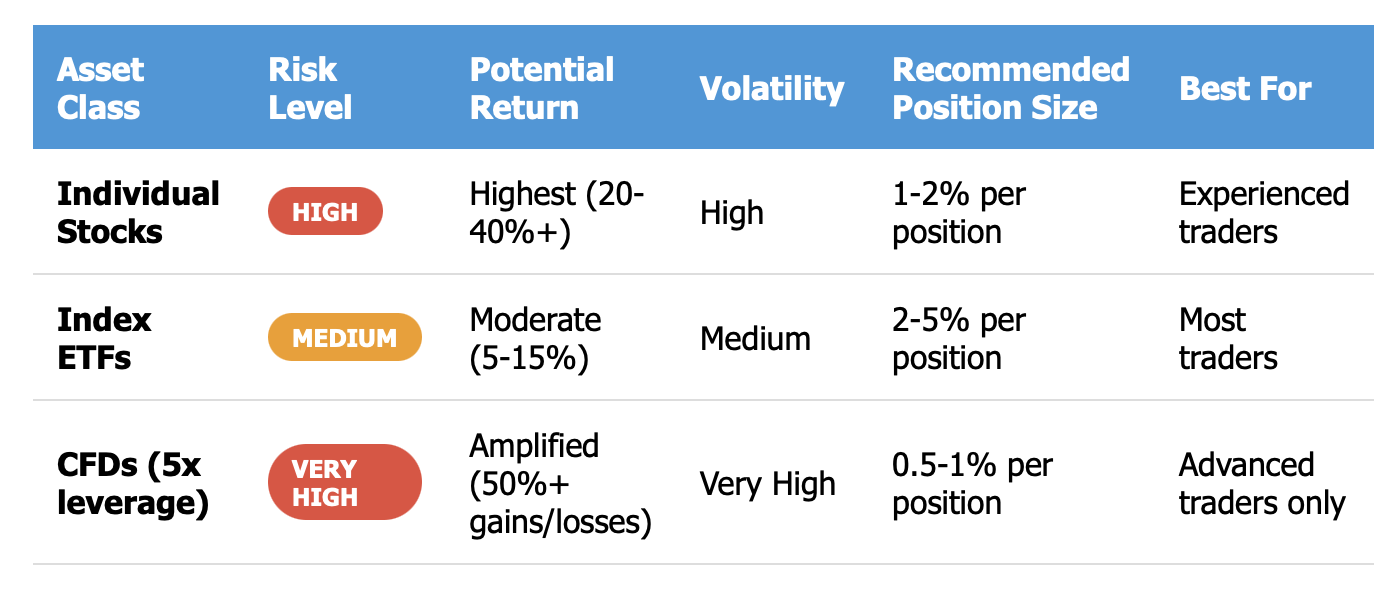
Various asset classes necessitate different tactics when utilizing oversold signals. In the case of single stocks, oversold events point to a short-term opportunity for value. When an exceptional company with strong fundamentals sees substantial selling pressure and technicals suggest an oversold scenario, one may experience a buying opportunity to enter at a discount. The crucial part is to confirm the stock's decline stems from an emotional reaction and not a potentially permanent deterioration of the company's business model.
Now, picture observing a large-cap pharmaceutical company with great earnings and market expectations. A study on one of its drugs does not result in the efficacy that it expected, and the stock is sold off by around 15% one day in two days. And the Relative Strength Index has dropped to a reading of 23. Additionally, the Stochastic indicator has also dropped to a reading of below 20. But you know the company has other drugs in its pipeline that have potential, and the selloff appears to be broader market sentiment. Hence, a perspective oversold buy opportunity, assuming you are comfortable holding through short-term price volatility.
A larger picture is presented when discussing indices like the S&P 500 or the Nasdaq 100. When an entire index, or at least a substantial percentage of the index, is in an oversold state, market risk is typically broad-based and not specific risks to individual companies. Market corrections, geopolitical uncertainty, or economic uncertainty usually translates into periods when a vast majority of the index is in oversold areas. The upside to these situations is that indices share the idiosyncratic risk associated with individual companies.
In March 2023, when regional banking apprehension caused a market pullback, the S&P 500 dipped into oversold territory. The RSI dipped below 30, Stochastic confirmed oversold, and the prices were at the lower range of the Bollinger Band. The index rebounded roughly 10% over the following month as fears dissipated. Traders who recognized the oversold extreme and positioned themselves accordingly captured nice gains.
When you add in trading CFDs, it is another layer because of the leverage. When you're doing a CFD on a stock or an index, the same price move results in a bigger gain or loss because of the exposure you have with that same price move. Thus, oversold signals become more valuable but also more dangerous. Valuable because you can spot a reversal and take advantage for a quick payout; dangerous for the same reason because if you're wrong, your exposure eliminates your capital.
Let's say you day traded a CFD on Tesla's stock and had a 5x leverage ratio through the CFD. After a rapid decline, the price of Tesla becomes oversold. You go long and put $1,000 of actual capital at risk but control $5,000 of exposure. It bounces back up and levels off, resulting in a roughly 10% gain. You made $500 back after a 10% upward price movement (50% return on $1,000). However, if it went the other way, and it opened 10% lower after it had gone oversold, you would lose $500 when it hit that mark (50% of your capital). The mathematics work in both directions, and this is why risk management becomes absolutely important when trading oversold conditions with leverage.
This strategic process includes several steps. First, you want to identify the oversold condition with a technical indicator, like the RSI. Second, you will want to see if the larger trend supports the decision-- is this a pullback in an uptrend or a bounce in a downtrend? Third, you want to look at the volume to see if it is signaling capitulation (in the case of a pullback) or distribution (in the case of a bounce). Fourth, you will want to review your risk appetite and size your position accordingly.
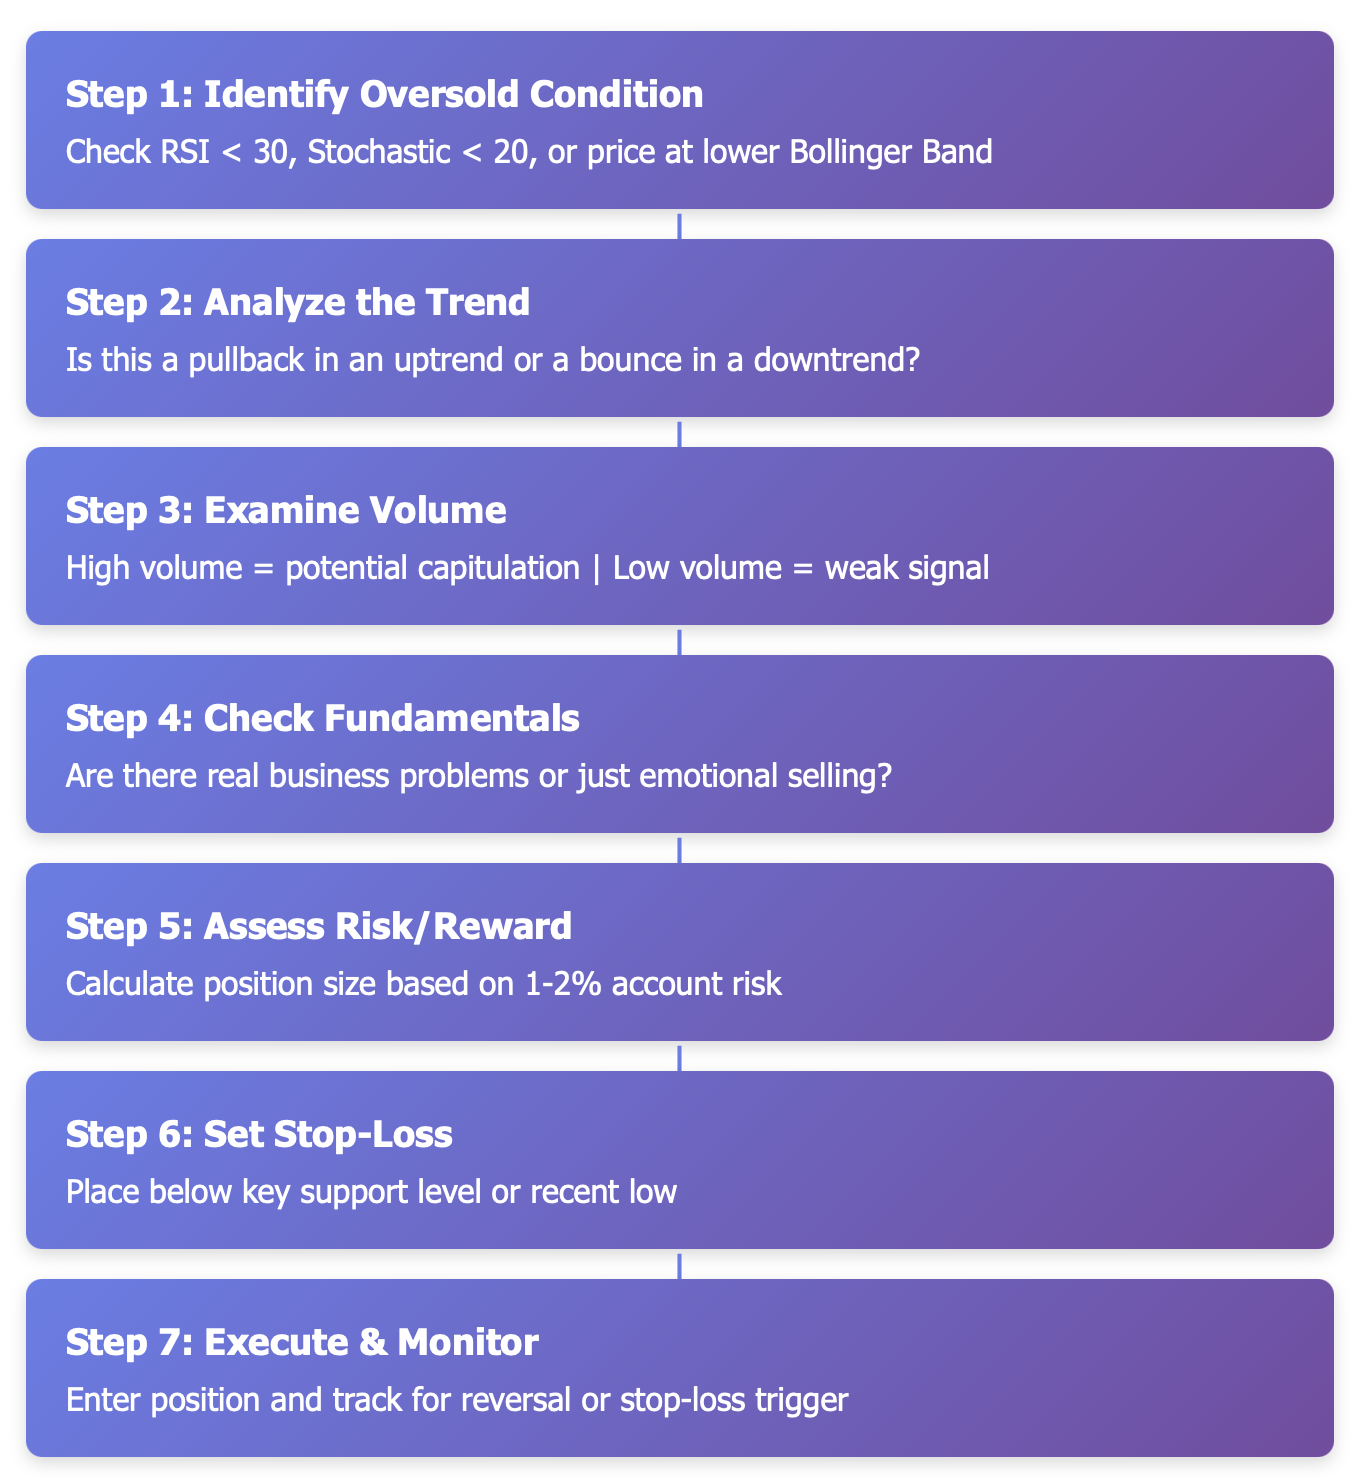
To illustrate this with an example that beginners can relate to: you have been paper trading SPY (S&P 500 ETF) in your demo account. The market sells off hard for 3 days. The RSI is down to 28. You notice that this is a pullback in a longer-term uptrend. Day 1 confirmed volume is below average, which suggests that there is not a lot of conviction behind the selling. You take a small long position, while placing a stop-loss at 3% below your entry. Your position size is only 2% of your demo account value. You are testing the oversold signal with very little risk.
The next week, SPY bounces 5% and you take a profit on half your position, letting half of your position run with a trailing stop. You have now traded an oversold condition while managing your risk. And even if you got stopped out, it would have been a small loss.
With ETFs tracking sectors or a specific index such as the QQQ, you can use oversold signals to identify potential areas of rotation. If technology stocks within the QQQ ETFs have become oversold while defensive sectors remain neutral or slightly overbought, it can indicate a potential buying opportunity to enter the technology sector. Oversold signals can identify strong sector-rotation plays that can provide excellent returns when timed correctly.
It also matters to compare across asset types. The most exaggerated upside rebounds occur after an oversold condition, with stocks being the highest risk single security. Indices trade with smoother more stable behavior but moves are smaller in percentage. CFDs will magnify everything using leverage while increasing opportunity and risk. Your recommended trading product type should be consistent with your experience, risk tolerance, and timeframe for trading.
Risk Management When Trading Oversold Conditions
No exploration of oversold trading can be comprehensive without talking about risk management. Even the best signals will not work sometimes and it is essential to prioritize the protection of your capital.
Stop-loss placement is your first line of defense. If you feel that the market has entered a position based on oversold signals, then find and identify a clear support level at which you'll capitulate that you are wrong. The prior low, a key moving average, or an important technical level could constitute "support." If the price exceeds that area, your premise is invalid, and you must exit.
As an example, say a gaming stock goes oversold at $45 after declining from $60. The prior low is $42 and there is a 200-day moving average at that price level as well, which adds significance. You might go long at $45 with a stop-loss at $41.50, below the technical support level. This gives the position room to breathe and defines your maximum loss.
Position sizing allows you to mitigate the impact of any single trade on your trading account. A general rule is to never risk more than 1-2% of your total overall capital on any one trade. If you have a $50,000 account and you're willing to risk 2% ($1,000), then your position size is based on where your stop-loss is located. For example, if your stop-loss represents a 5% loss from your entry point, you would position size at $20,000 (5% of $20,000 is your $1,000 risk limit).
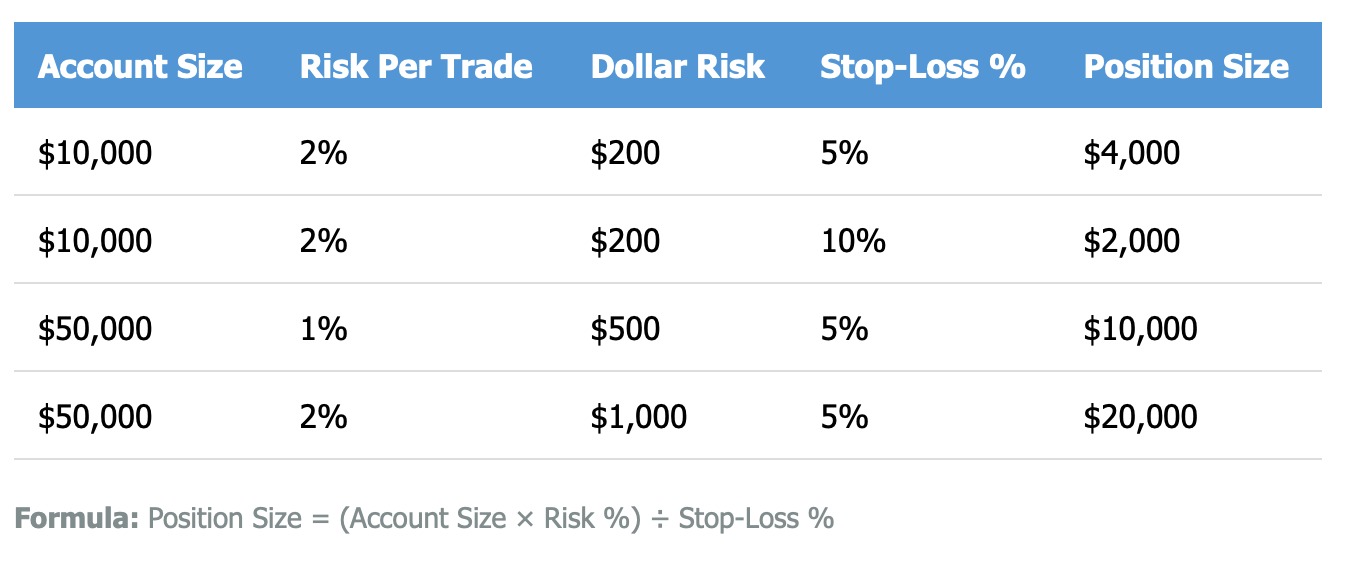
This is even more important for when you are using CFDs and leverage. If you are trading using 5x leverage, remember that a 2% move against you would represent a loss of 10% of your capital. Therefore, you should size your positions in accordance, as well as not be tempted into overleveraging if you see an oversold signal.
Lastly, but surely not least, is the concept of trend confirmation to help reduce the number of false signals on the market. Before you pull the trigger on an oversold signal, look at longer-term moving averages such as the 50-day and/or 200-day moving average, ask yourself if the asset is in a bullish trend that is pulling back while maintaining the uptrend, or is it in a bearish trend and the oversold condition is just part of a longer-term pullback? Tools such as MACD can assist you in confirming if the momentum is actually shifting or if it is temporarily oversold in a longer term downtrend.
A professional note of caution: in late 2022, Tesla constantly flashed oversold signals while it dropped from around $300 to below $110. Traders that bought every oversold signal without regard to the dominant downtrend lost repeatedly. THE RSI dropped below 30, they bought, the price stalled and bounced 10-15%, then the downtrend pushed the price lower past the previous lows. Without stop-losses in place all the actual value gained temporarily was converted into larger daily losses.
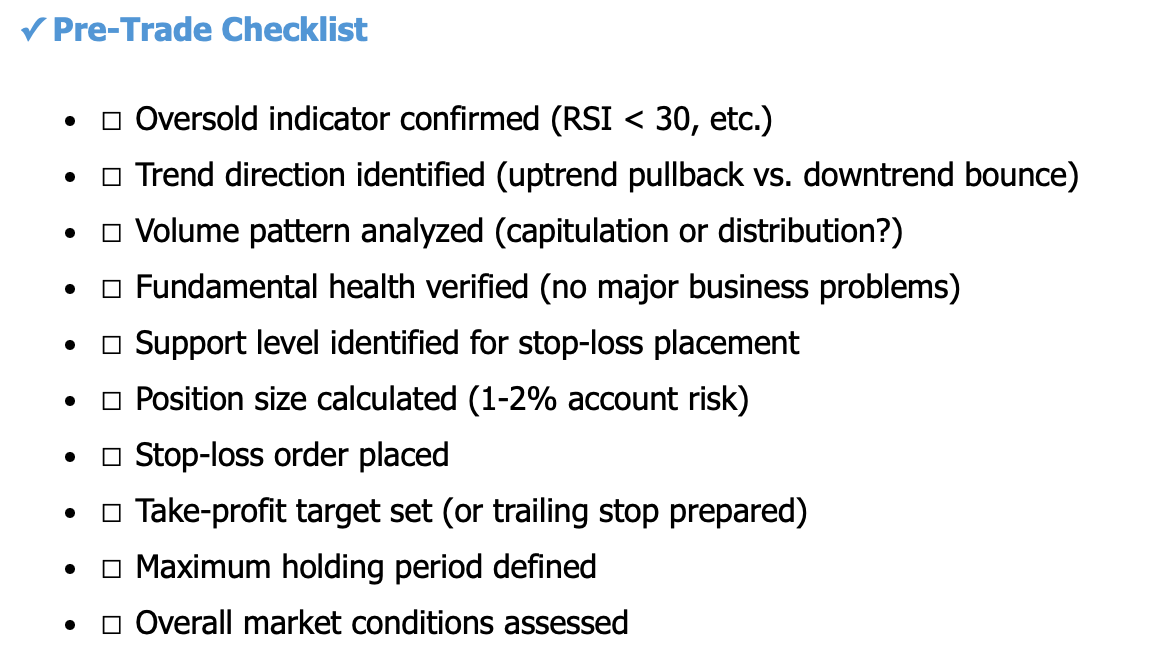
For new traders, consider the following practical example. You are reviewing stats on a popular gaming stock, and the RSI drops down to < 28 you know that means the stock is overbought. Instead of buying all in, you decide to enter at roughly 2% of your demo account. You work through where you'd place a stop-loss and decide you're ok with minus 5%. After your purchase and take profit and stop-loss are established, you follow the stock closely. Just because a stock is oversold does not mean it will lead to a reversal. If the trade works, great! If it doesn't you have only lost a small amount and you have learned about how to behave in the market.
You can also apply this thinking to portfolio construction and the diversification approach for a number of stocks that appear oversold. While you obviously don't want to put all the capital in play for one oversold stock, you can identify a number and pls small equivalent positions over a number of these oversold signals. For example, you may find three different stocks that are flashing oversold signals. You decide to risk 1% of your actual account on each of these 3 stocks. If two work and one does not, while it may be you lost, but you did not lose on every stock.
Timeframes matter as well. Ordinarily, oversold signals are the most effective for short-term moves (e.g., days to weeks, not months). If you've established a position based on an oversold time reading, and the trade hasn't worked out within your expected timeframe, it could be time to close out of the position, even if your stop-loss hasn't been hit. Your capital has been tied up in a position that is not working, and cannot be deployed for better opportunities.
Common Misconceptions About Oversold
Let's eradicate several harmful beliefs that hinder traders, particularly new traders.
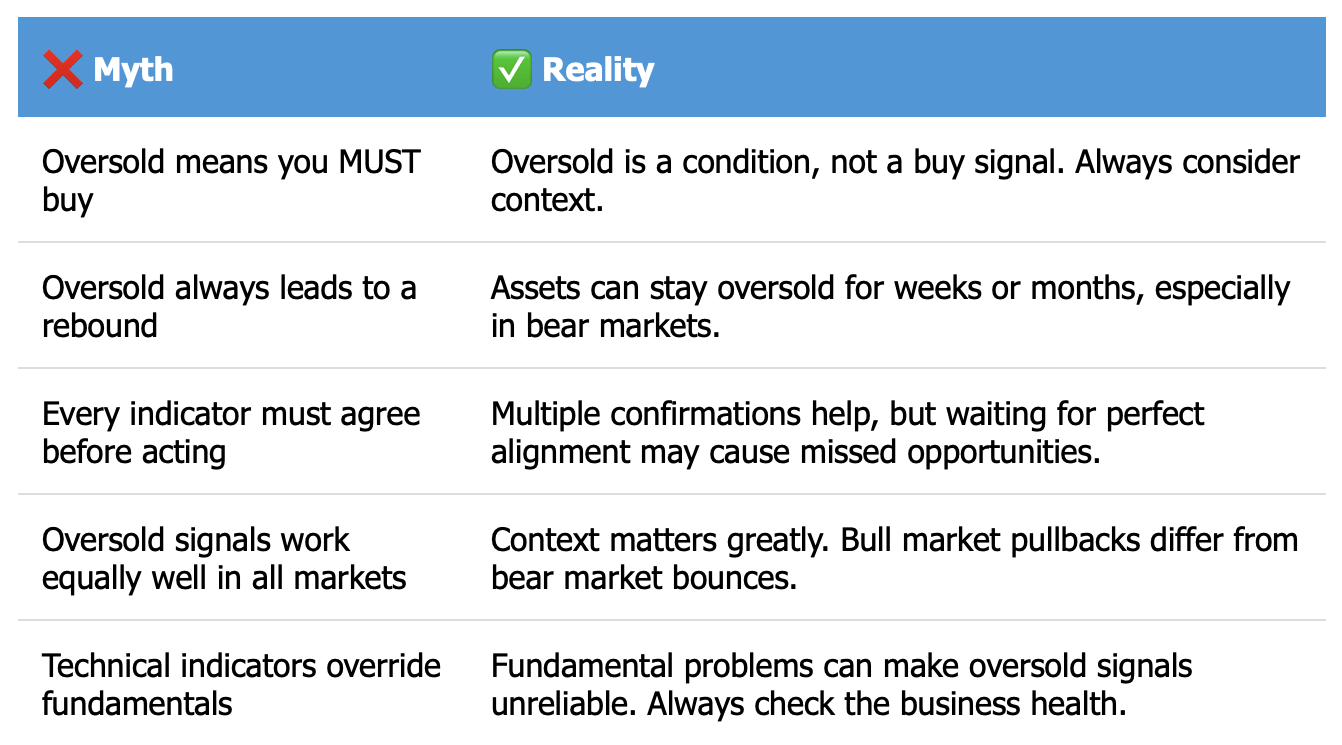
Myth 1: Being oversold means you should buy. This is the most destructive and damaging form of error. Oversold is a condition, and not a position. The fact that the RSI has hit 25 does not obligate you to go long. There may be a clear downtrend in the broader market. The odds are six to one that there are fundamental issues brewing. You may not have a good risk-reward profile (or simply a good setup) for getting long. Residual negativity regarding stocks in the index is merely a piece of the puzzle along with what you know - it is not a massive red arrow flashing "BUY NOW" on the screen of your brokerage account.
Myth 2: Being oversold must lead to a rebound. If only trading were this easy! All things considered, individual assets can be oversold for considerable amounts of time, particularly during sustained and substantial downtrends, including and especially during crisis tendencies. As a case in point, during the 2008 financial crisis - many individual equities spent months in oversold territory before ever bottoming. You could have awful results taking on oversold positions from the moment oversold readings began. Markets have a way of remaining irrational, much longer than most traders anticipate they can remain, and self-sustain that dysfunctionality.
Myth 3: Every indicator must agree before you act. While putting multiple signals together is certainly the smarter thing to do because it adds reliability, waiting for every indicator to line up perfectly can lead to you missing opportunities altogether. It's completely possible you can have an RSI that shows oversold, and the Stochastics is not yet at the extreme. If other things are lining up for the trade (the trend, volume, fundamentals) you could still have a legitimate trade set-up. It is preferred that all indicators would line up, but that doesn't mean you have to do that every time.
Myth 4: Oversold signals are equally effective in every market scenario. A lot is going to depend on the context. You will want to really understand the market circumstance. Overall the success rate for an oversold trade signal during a bull market pullback, is going to be markedly higher than an oversold trade signal that can be later proven, if the stock trades lower or further aggravates a bear market. Think back to the tech rally in 2021, during that event, most times the oversold reading in growth stocks led to sharp reversals higher in stock prices. Conversely, when we entered the bear market in 2022, most stocks declined to greater lows and oversold readings provided little assistance to the stock price, because they kept getting ground lower.
The right way to think about trade set-ups is about as follows: "You see an RSI that shows the stock is oversold, well that's good, now let's check the trend, are you in an uptrend, a downtrend, or the range?" "What about the volume, do you see any signs of capitulation or a consistent seller?" Then think about or consider the fundamentals, is the company healthy or has it had real problems trending toward bankruptcy? And finally, what is the market condition? Is the stock market rally strong or weak overall?
Once again, Tesla is a valuable cautionary tale. In 2021 and 2022, Tesla had quite a number of oversold signals. Some of them led to incredible bounces—30% or better in some cases within a few weeks. Others just fell apart as the price continued to decline and accelerate generally. None of this difference was due to the readings of the indicator; it was all about context. The traders who bought every single oversold signal without passion got crushed. Those who considered the trend, volume, and the market overall were much better off.
For people placing trades in demo accounts and more beginner traders, the takeaway is straightforward: do not look at oversold indicators as total answers. When you see RSI below 30, think to yourself: why is this stock oversold? Is the selling emotional or a fundamental change? What are the overall results? What am I willing to risk if I am wrong? This kind of questioning helps minimize the losses of buying dips for oversold indicators or following an indicator blindly.
Another practical takeaway is various timeframes may tell different stories. A daily chart may look oversold and a 60-min chart may downtrend while a weekly chart explicitly shows a clear downtrend. Always zoom out and look at different timeframes before committing capital! What one timeframe may look like an opportunity may simply be a small pause during a larger decline.
FAQ: Most Common Questions About Oversold
What is oversold, exactly? An oversold market is one where the prices of an asset have declined quickly and/or too much, to the point that it might be temporarily undervalued. Technical indicators like RSI below 30 are commonly used to flag oversold situations. Think of it like a spring that has been compressed; a spring can be compressed but not change in value, and may revert back, although it is not guaranteed.
What separates oversold from simply a fast decline? A sharp decline is literally just a price movement. Oversold is a technical label based on a specific indicator reading that suggests the price action has gone too far or too fast. Not every decline puts the market into oversold conditions, and an oversold condition does not necessarily come from a fast decline. The difference is important, because oversold suggests reversal potential, while a decline may simply mean the assets they are becoming repriced in the market.
Does a RSI reading of below 30 mean I should buy then? Absolutely not. RSI under 30 indicates overbought conditions, but it does not make a buy signal. You need to also consider trend, volume, fundamental issues, and the rest of the market. During a really strong downtrend, prices are likely to continue declining, while the RSI stays below 30. If oversold reading has value, it will come from taking as one of several decisions to make.
How do I combine trend and volume when assessing oversold signals? First determine the overarching trend, using moving averages. Is the asset in an uptrend and just in a temporary pullback, or did it trend down? Oversold readings show up better in an trending asset. Then, examine volume. While high volume on the decline could indicate capitulation (potentially bullish), if the selling is on average volume and persists, that may provide better opportunity for additional downside. Ideally, you will have oversold readings occurring in a well-defined uptrend, along with declining volume on the selloff.
Why is oversold important for CFD and index trading? In CFD, the monetary risk of getting the reversal wrong is equal to magnitude of the reward for getting it right and leverage establishes that. If you get the reversal signal right, you can realize compelling returns quickly but if you wrong, that result is equally less than favorable. For indices, in oversold conditions would rather reflect stress in the overall market rather than some condition associated with the specific stock. Although you might be getting trapped buying an oversold security, you could potentially trade on a reversal in the overall market which eliminates the risk of idiosyncratic events dragging down the stock.
Can fundamental issues nullify oversold signals? Absolutely. For example, if a company reports horrible earnings, loses a major contract, has a regulatory issue, or there's been deterioration of the fundamental business, technical oversold signals can become unreliable. Price may fall based on actuality, not emotional oversold. Commenting on oversold conditions, always check before assuming it is going to bounce.
So how long do oversold conditions last? Again, broad range. In strong market uptrends, oversold conditions could be fixed in days as buyers enter the market. In bear markets or crashes, assets can be in oversold for weeks or even months. There is no time standard for beating oversold conditions, which is a good reason reasons to have time exit strategies for oversold setups.
Conclusion: Mastering Oversold Signals for Smarter Trading
Learning to understand oversold conditions is a useful skill that will enhance your trading outcomes in stocks, indices, and CFDs. Oversold signals show instances when selling pressure may have been extreme, therefore, for traders who know how to decipher and react to them effectively, opportunities populate themselves in oversold readings.
What is most important is balance. While oversold readings can be an important indicator of extremes and likely reversal points, like all signals, they are a reference tool. Profitable outcomes stem from the combination of these technical signals with trend analysis, volume patterns, fundamental considerations, and disciplined risk management. The best outcomes tend to be bolstered by multiple confirming factors all in agreement.
Each asset is approached differently. Individual stocks offer the greatest potential return from an oversold bounce, however, you are subject to single security risk. Indices offer a smoother behavior and greater diversification and CFD's amplify everything via leverage and warrant more caution and risk control.
Like all skills practiced practice is important! Before risking any capital, spend time observing oversold signals in demo accounts. Really watch how indicators compare during stressed or volatile markets. Observe how combinations of signals precipitated the eventual reversal versus false starts. Practice building your pattern recognition skills.
Bear in mind that even seasoned traders do not catch every oversold bounce and do not sidestep every false signal. The difference between consistent winners and losers is how well they manage risk. Good position sizing, smartly placed stop-loss orders, and discipline will prevent you from losing money on the trades that will inevitably go against you.
Ready to put your oversold trading knowledge into practice? Create your free demo account on Tradewill today and start identifying real market opportunities without risking a penny. Practice with professional-grade tools, test your strategies across stocks and indices, and build the confidence you need before trading with real capital.
Disclaimer: The content of the blog does not represent any position of Trade W, does not serve as any trading-related decision advice, and does not endorse any third-party.