

 Trade W

Pin Bar trading involves a great deal more than spotting a single candle on your chart that has a long wick, then taking immediate action by either buying or selling. Each Pin Bar represents an ongoing battle for possession of the market between large segments of institutional-level traders and smaller, retail-level traders. The difference between consistent profits made by a trader and losses incurred by another trader is often due to their understanding of the battle of trading. Here is a complete guide to the anatomy of a Pin Bar, as well as specific Pin Bar execution strategies for use in real-world trading.
What Is a Pin Bar and Why Does Its Structure Matter
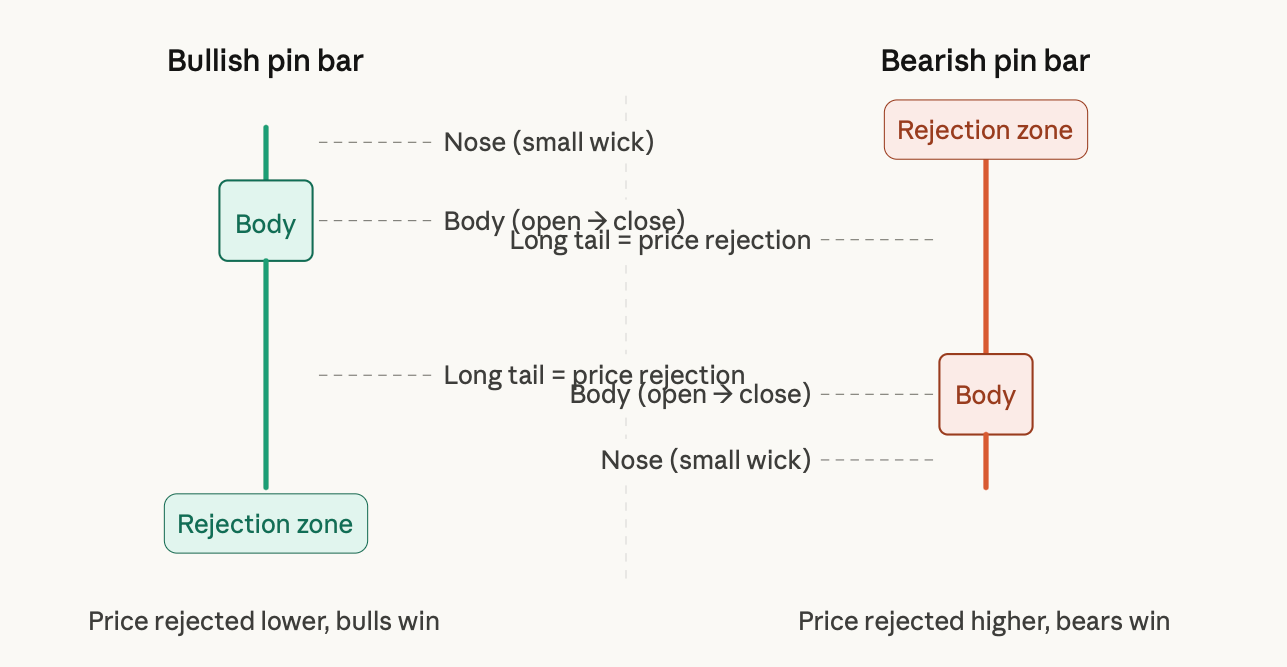
In a pin bar candlestick, there is a large amount of price movement called the very long tail. The open and close of that candle is represented by a very small body, or visual aspect of the candle, and these two elements can be found at opposite ends of the pin bar.
The most significant part of the pin bar is the big move down or up to the point where most of the buying and selling activity occurred, meaning this will have created a wall of opposing orders that caused the price to move back to the original starting point before it finally closed.
The three components of a pin bar are: The nose, which occurs at the bottom of the candle, and the open and close, also known as "the eye", and the tail.
There are two types of pin bars. The bull pin bar is formed when the tail of the pin bar is at the bottom or lower end of the candle; sellers overwhelmed buyers and forced the price lower; therefore, buyers now have control over the price.
Also, a bear pin bar is formed when the tail of the pin bar is at the top or upper end of the candle; this indicates buyers overwhelmed sellers after a push higher in price, meaning sellers now have control over price.
The crucial thing to understand about a pin bar is that it is not simply a visual pattern or mechanical memorisation; instead, the pin bar is evidence of price rejection from the market; thus, this rejection created a print on the chart for you to be able to read. Understanding the method in which to read this print will lay the groundwork for the remainder of your trading strategy.
Most traders confuse a pin bar with the other two candle types, the doji and hammer candles. The doji candle has a very small body compared to long wicks on either side that show a total lack of decision-making ability and do not indicate a rejection of price action.
The hammer is often mistaken for a bullish pin bar because of its shape; however, it tends to form at the bottom of a downtrend and has less exacting body placement and more wick length than the pin bar does.
Unlike the hammer and doji, which show indecision, the pin bar indicates a very clear direction, rejection, and reversal from a price level.
The Institutional Logic That Makes Pin Bars Work
To be able to comprehend the occurrence of a Pin Bar on the chart, and why they are almost always present in the same area on the chart to trigger a reversal of price, one must first understand how institutional money trades within the financial markets.
Unlike retail traders, who can simply enter trades by pressing a button to place a trade for them, large financial institutions are unable to do so. An example of this would be if an institution wishes to buy hundreds of millions of dollars worth of EUR/USD, an equivalent amount of sellers must exist in order to fill the opposite side of that trade.
This is why the concept of liquidity is crucial to the understanding of Pin Bars. When retail traders trade, they generally put their stop losses below visible support and resistance levels, as that is a common teaching within the trading education system.
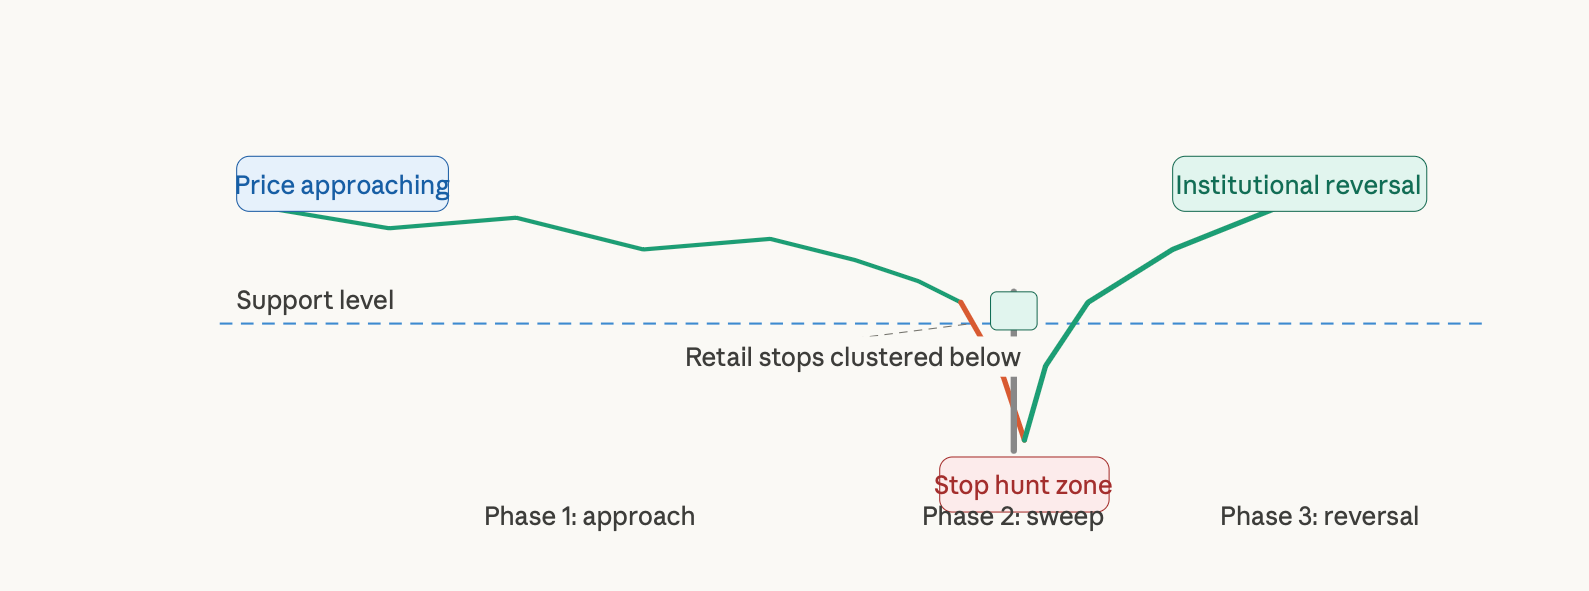
On the other hand, institutional traders have knowledge of the location of all the clusters of retail stop-loss orders, and subsequently purposefully drive price into those locations, thereby triggering the stop-loss orders.
This action results in an influx of sell orders while the price is being sold down, whereby institutional traders would ultimately utilise the sell orders to fulfil their own large buy orders. The engineered price movement, which then immediately reverses, is a liquidity sweep, and the resultant candlestick on your chart is, more often than not, a Pin Bar.
In summary, when you see a Pin Bar form at a prominent or key area of support, you are actually observing the institutions, or large financial firms, hunting the stop-loss orders that were placed by retail traders who had gone long from the zone of support.
The sweep occurs quickly, the stop-loss orders of the retail traders are filled, and the price then reverses and moves in the direction the institution anticipated on trading. The long wick remains the indication of that manipulation, and the PIN Bar can no longer be thought of merely as a pattern; it has become much more than that.
You can predict where the next Pin Bar may be formed. This is because the majority of excellent Pin Bars do not show up randomly on your chart. Instead, they tend to cluster near key support and resistance price levels, psychological price gaps, rounded numbers, and where large groups of limit order traders have historically been located.
By learning to identify these types of patterns in price behaviour, you will gain the ability to identify locations for future Pin Bars instead of simply reacting to them after they form.
How to Trade Pin Bars: Entry Strategies That Actually Work
To understand why pin bar patterns happen in the market, you must develop a systematic way of trading based on defined actions. This includes establishing guidelines for when you're going to enter a trade, where you're going to place your stops and how high a return you're looking for.
The two main entry strategies used for trade execution from a Pin Bar are the 'At-Close Entry' and the '50% Rest Entry'. The 'At-Close Entry' allows for entering the trade as soon as the candle closes. This is the more aggressive method, ensuring that you are already in the trade; this method typically compromises some quality of the risk/reward ratio.
The '50% Retrace Entry' would use a limit order placed at the midpoint of the entire range from the top of the tail to the bottom of the nose, allowing you to wait until the price retraces to that level before you enter. The '50% Retrace Entry' results in tighter stop-losses and provides for a far greater risk-to-reward ratio, the best metric for determining long-term profitability over win rate.
Always put your stop-loss outside the tail of the Pin Bar candle with a buffer of 5-15 pips on Forex or a similar percentage on other instrument types to cover spreads and fluctuations in price. As a beginner, putting your stop directly at the tip of the tail puts you at risk of having a minor wick always stop you out of an otherwise valid trade. The target for take-profit should be no less than the next structural level above the Pin Bar candle with a minimum risk: reward ratio of 1:2. Therefore, if you risk 50 pips, your take-profit must be at least 100 pips above that risk.
Pin Bars work best when used in association with Fibonacci levels. When a Pin Bar forms at either the 61.8% or the 50% Fibonacci retrace from a prior swing, the combination of those two signals produces a setup that has generally had a higher follow-through rate than either signal alone.
Multi-Timeframe Analysis: The Context That Filters Out Bad Trades
Traders often make the mistake of trading Pin Bars in isolation without taking the time to review the higher timeframe trends that might support or oppose their trade decision. Multi-Timeframe Analysis allows traders to use both a higher timeframe chart to identify the dominant trend and a lower timeframe chart for a more precise entry.
For example, if the Weekly Chart for EUR/USD indicates a strong downward trend while the Daily Chart produces a Bearish Pin Bar at a resistance level, then this trade setup will have a greater likelihood of being successful due to the strength of the higher timeframe trend supporting the setup than if the Bearish Pin Bar was formed when the Weekly Chart was showing an upward trend. Higher timeframes establish the Direction, and Lower timeframes establish the Timing.
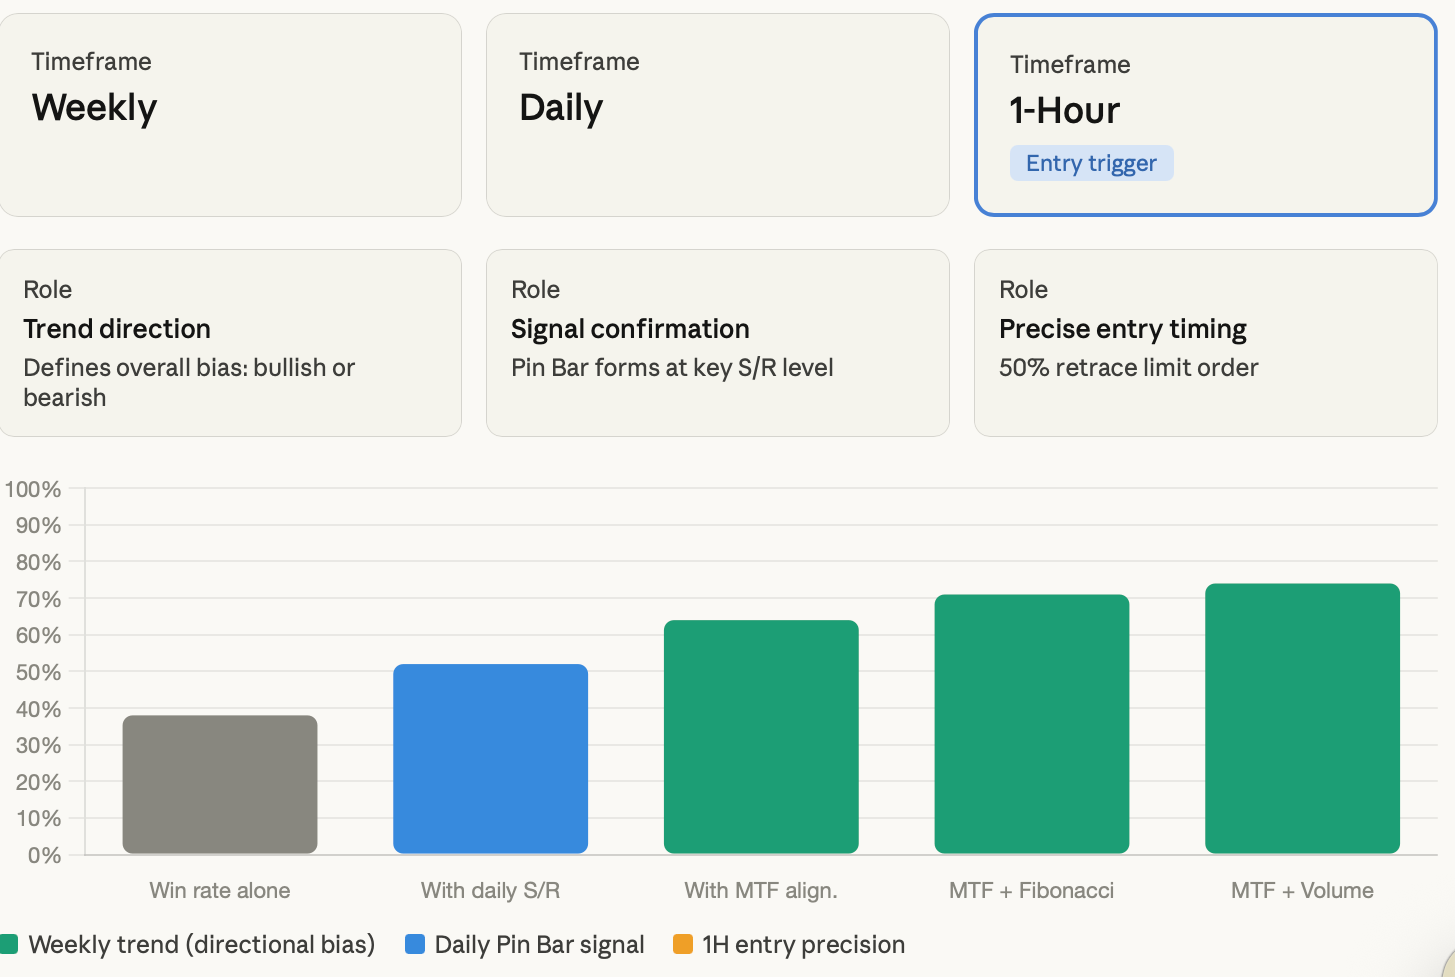
There is a clear hierarchy to the practical implementation that begins with the macro trend, which you determine on the daily chart. Determine the key levels of your daily chart and look for Pin Bars. Then, drop down to the 4-hour or 1-hour charts to refine your entry and confirm that momentum on the lower time frame will match your trade direction. When a trader enters a bearish Pin Bar on a 15-minute chart while both the daily and weekly charts are pointing aggressively up, this will lead to many losses, as this is the largest percentage of all failed Pin Bar trades by intermediate-level traders.
How to Identify High-Quality Pin Bars and Avoid False Signals
There are a few characteristics of a Pin Bar that can disqualify it from being traded. Understanding the characteristics to look for when trading is arguably one of the most important things about trading the Pin Bar strategy. Lack of applying significant quality filters to determine whether a Pin Bar is a quality trade has caused the disappointment of many traders when they lose several trades in a row due to low-probability Pin Bars.
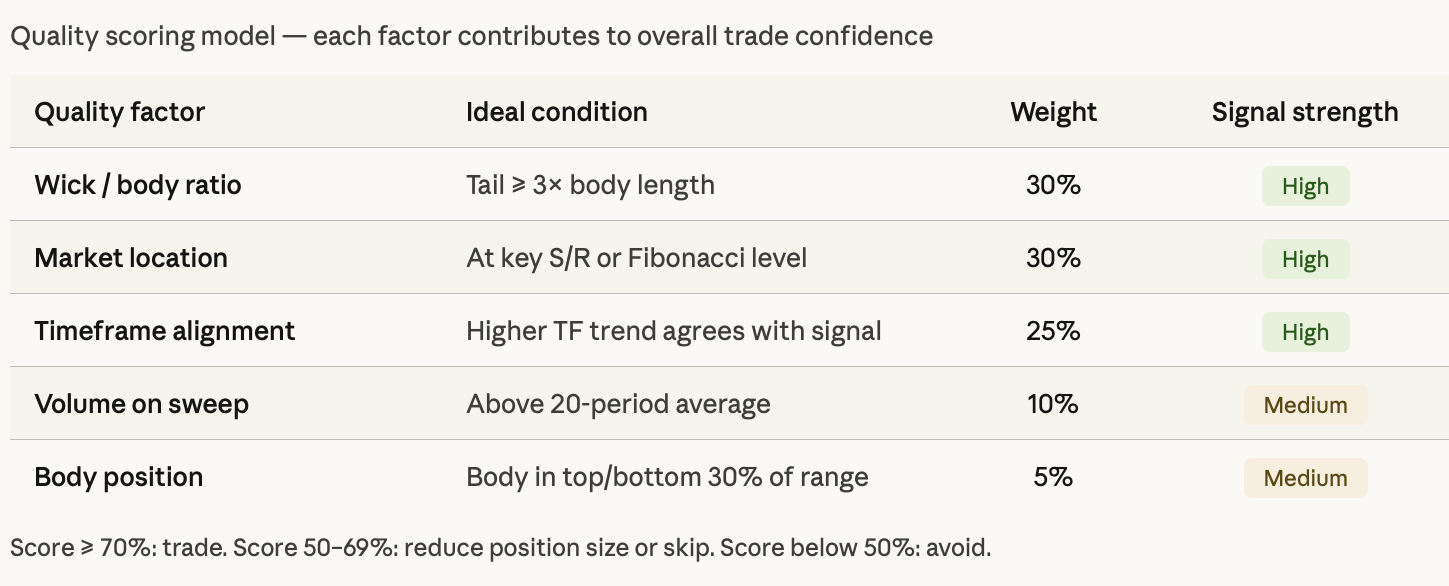
To qualify as a quality Pin Bar, consideration of the following four factors is required: Wick Length Relative to Length of the Body; Size of the Body and its location within the total range of the candle; market type; and volume context. Specifically, a quality Pin Bar should have a Wick that is at least 2-3 times the Length of the Body.
The Body should reside in the upper third for a Bullish Set-up or the lower third for a Bearish Set-up of the Bullish Candle. The pattern should appear at a significant Market Location, such as tested Support/Resistance Levels, Psychological Round Numbers or Fibonacci levels; and there should also be increased volume during the "Sweep Phase" of the Pin Bar in comparison to recent price action to support the validity of institutional participation.
A frequent mistake made by novice traders is to utilise every available opportunity for trading Pin Bars, resulting in an overwhelming number of trades during the course of one week and immense transaction costs that can quickly deplete their accounts.
On the other hand, seasoned professionals using this type of strategy often spend considerable time analysing potential trades before deciding if and when to execute them. When they eventually find an appropriate setup, they take it seriously due to the extensive amount of analysis performed on the setup to ensure it meets all of the requirements.
Risk Management: The Rules That Keep You in the Game
The discussion of any trading strategy can never be complete without thoroughly addressing Risk Management, since even with a 65% Win Rate, without properly managing position size, the potential for account damage from drawdowns will exist. Remember, Pin Bar is not a Crystal Ball; therefore, you should not treat Pin Bar as being 100% Guaranteed to Generate Profits.
The Standard Procedure for Professional Traders is to never risk more than 1%-2% of your Total Account Equity per trade. For example, with a $10K Trading Account and a 50 Pip Stop Loss, your position size would be based on the stop width and the 1%-2% risk guidelines, not on your opinion of how much you would like to make. By using this approach, you will limit the impact of any one losing trade from creating material damage to your account while enabling you to endure the inevitable losing streaks associated with every trading strategy.
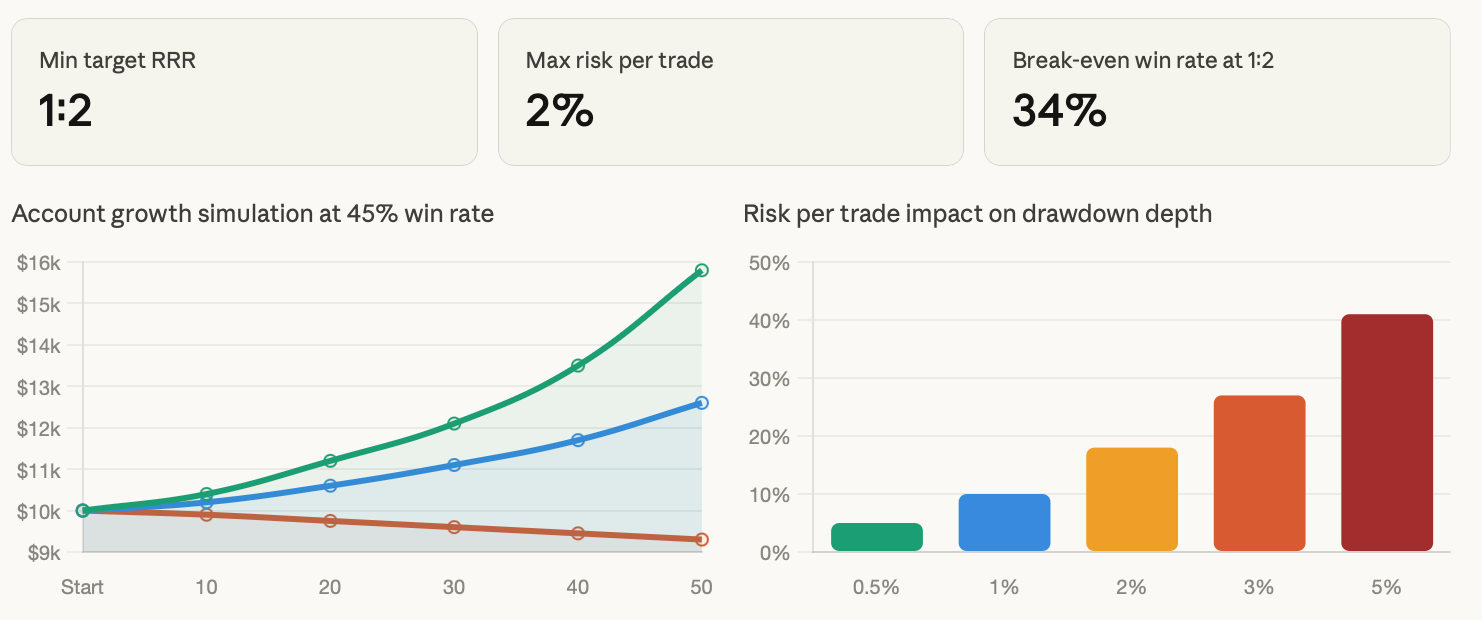
At first glance, the mathematics behind risk/reward ratios are surprising to new traders; however, indeed, a trader can still make money by only being right about 45% of the time if they are putting on trades with at least a 1:2 risk/reward ratio, while a trader with a 60% win rate who does not have a risk/reward ratio advantage will end up just breaking even after factoring in commissions, which leads directly to loss of capital. Therefore, a trader's profitability ultimately relies more on risk/reward discipline than simply being correct most of the time.
Not only is a series of consecutive losing trades the result of a lack of skill, but learning how to handle a sequence of consecutive losing trades is another form of developing one's trade management skills.
Professional traders will often stop trading after having lost three to five trades consecutively so that they can take time to evaluate their recent analysis and allow market conditions to improve. Over-trading during a drawdown period is the quickest way to change a normal losing period into a catastrophic loss.
Real Case Studies: Pin Bars in Gold and Forex Markets
When it comes to trading Pin Bars in gold (XAU/USD), there are very few comparable instruments as far as adhering to the levels set out by technical analysis over time, especially during the announcement of Federal Reserve policy changes or the release of important macroeconomic statistics.
An example of a classic setup for trading a Pin Bar in gold would be when the price falls below an established support level just after the release of important news, forming a bullish Pin Bar on a four-hour time frame. This formation occurs because the institutions are absorbing the panic-selling created by retail traders having their stop loss levels just below the support level, leading to a rapid reversal in price over subsequent trading hours.
When observing EUR/USD, Pin Bars tend to form with the highest degree of reliability around psychological round number levels such as 1.0800, 1.0900, and 1.1000, where there is significant clustering of stop orders and option barriers.
When a bearish Pin Bar forms at 1.1000 after an upward price move, with the daily timeframe showing price above a 50-period moving average, this type of setup has ample institutional rationale to justify placing a trade with a reasonable expectation of success.
Executing Pin Bar Trades on TradeWill
Using TradeWill Charting Space, you can do multi-timeframe Technical Analysis across multiple instruments at once, set your limit orders in advance on the 50% retracement level for doing wick retracements, and manage your stop loss and target levels accurately. There is a significant difference between a mediocre entry and a good entry for every serious trader who trades off of the Pin Bar trading strategy, and that difference is usually in the speed of execution and precision in placing your order properly. Having a Trading Platform designed to allow you to trade from structured levels is equally important as conducting your analysis.
Stop waiting for the perfect setup to happen without a plan. Open your TradeWill account today, set your levels before the candle closes, and let the market come to you at tradewill.com.
All performance figures used in this article are illustrative models based on historical pattern behaviour and are not a guarantee of future results. Trading Forex and CFDs carries a significant risk of loss. Always trade within your risk tolerance.
Disclaimer: The content of the blog does not represent any position of Trade W, does not serve as any trading-related decision advice, and does not endorse any third-party.