

 Trade W

What Is Price Action Trading? The Clear Explanation You Actually Need
To definePrice Action Trading, it can be described as viewing pure raw Price Movement on a Chart and understanding what that movement means. It allows for a trader to realize current market behavior instead of relying on technical indicators that will give you lagging results. Instead of cluttering your screen with an endless number of oscillators and moving averages, you are able to focus on what is happening at the exact moment.
Through this trading method a trader will learn to speak the language of the market. When a trader is able to apply the understanding of how price moves, how price reacts to support and resistance levels, and how price forms Price Action based patterns that indicate the interests of Buyers and Sellers, a trader can analyze a market with the utmost clarity.
Price Action Trading can be utilized in every trading environment including Forex, Gold, Cryptocurrency, Index and on any Time Frame, and this is why so many traders prefer Price Action Trading over all other forms of Technical Analysis. Rather than waiting for an indicator to tell you what happened 5 candles ago, a Trader is able to react to the live Price Action of the Market.
As such, the benefit of utilizing Price Action Trading is that it allows for quicker, and therefore, more effective decision-making based on clear and concise logic - allowing you to see the "why" behind the direction of price, rather than simply "what" price is doing. The Price Action Trading Guide will provide you with a full understanding of the basics of how to build a Market Structure through Price Action Trading and provide you with Real World Trading Strategies to begin using immediately.
The Hidden Logic Behind Price Action: How Market Microstructure Really Moves Price
The movement of prices does not happen in a random fashion. Every time there is an increase or decrease in the price of a security, it represents a contest between buyers and sellers for control of the market. Understanding the significance of these steps will help an investor make smarter investment decisions.
The field of microstructure refers to how buyer and seller orders interact to generate price movements. Most large institutions require a large amount of liquidity when they want to buy or sell a significant amount of contracts (e.g., 10,000 contracts). Institutions cannot simply place a large market order without moving the price down. Therefore, they must first look for liquidity pools; i.e., areas where there are many stop-losses clustered together or retail traders erroneously positioned against the liquidity pools.
It is for this reason that it is common to see prices breaking above or below a support level to capture liquidity, only to then drop quickly. Institutions move into the respective liquidity pools with the expectation of purchasing or selling their required number of contracts before they make a move in the opposite direction of the market.
When there are not enough sellers to match the number of buyers, volatility will increase, and therefore, the price will climb rapidly. When volatility slows down and the price returns to an acceptable level of equilibrium, then the market is in equilibrium.
Liquidity moves or grabs around major levels form the basis of many professional trades. An example is how gold regularly will drop below a major low level to facilitate stop-loss orders being triggered, resulting in a large number of traders causing a rapid retracement. Retail traders believe that it is a breakdown and institutions consider it an opportunity to buy when the price returns to that level.
In beginner terms, liquidity zones can be viewed as price areas where supply and demand were overwhelmed on one side by the other. When prices return to these areas, there's a high likelihood that the dominant side will return to dominate. You won't be guessing what candlestick formations will form next, you will be looking at how liquidity participants are positioned and what their next likely action would be.
How to Read Market Structure Like a Pro: Trends, Ranges, and Reversals
Every Price Action Strategy relies on market structure to guide its development. If you struggle to determine whether the Market is trending or ranged, you will be challenged to utilize all price action strategies.
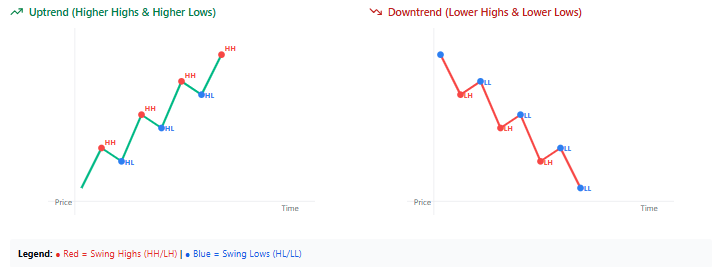
Market structure is defined by Swing Highs and Swing Lows based on Price Action. Each time Price breaks down from one swing and then rebounds to create another swing, there must have been a break above each of the previous three lower lows in a sequence (as a series of HH or HL).
When a Market is in an Uptrend, it will create a series of HH' and HL'. In contrast, Downtrends will create LH' and LL'. Downtrends occur when Sellers keep selling downside momentum which creates weaker bounces with each passing bounce. This continued weakness indicates a lack of seller strength and indicates that there may be a coming reversal.
The market structure break is an excellent signal for beginning to use the Power of Price Action Strategy and preparing for potential market reversals.
When Market Price breaks out of long-term ranges, most Professional Traders Wait for Criteria Breakouts and then practice their strategies by waiting to retest their previous continuation.
When determining whether the Market has been strong or weak based upon whether they were trending higher or lower, a strategy user must gauge Strength versus Weakness on the basis of what they see based upon how the price behaves through swing breaks before taking action.
To begin practicing, bring up a chart of the EUR/USD currency pair and identify 2-3 of the most recent highs and lows by drawing horizontal lines across them. That's how you identify whether there's a trend (higher highs) or a range (prices bouncing between two levels). Additionally, understanding where you're currently located in price can help give context on any patterns/signals you see throughout your trading career; thus, knowing where each point relates visually within the structure will also assist you in evaluating your trading decisions.
For example: if you were to identify a bullish pin bar candle during an active downtrend, then it would be considered a weak trade setup; however, if that same bullish pin bar candle appeared after a short-term pullback, that would indicate a higher probability trade setup going forward in an active uptrend situation.
The Most Reliable Price Action Candlestick Patterns
While Candlestick patterns illustrate the immediate psychology of the market, the important thing about patterns is that they're only valuable when you have the context of the market behind them.
Pin Bar - A Pin Bar is a candle that has a small body with a very long wick. The wick represents rejection by the buyers/sellers. A bullish Pin bar (a pin bar with a very long lower wick) that forms at support, in an uptrend, represents sellers trying to push the price lower, being overwhelmed by buyers. This could be a potential trade entry.
Engulfing Pattern - An Engulfing Pattern is a bullish (and sometimes a bear) candle that completely engulfs the prior candle completely. In an uptrend, a bullish engulfing pattern is a representation of the buyers taking back control of the market after a period of selling. In a downtrend, a bearish Engulfing candlestick pattern at resistance is an indication of the same.
Inside Bar - An Inside Bar is a small candle that has been formed within the candle body of the Candle before it. An Inside Bar represents a consolidation and indecisiveness on the part of the traders. Once a trader has moved out of an Inside Bar, they will often be committing to either direction/position ahead of others; this can lead to strong moves for potential trades.
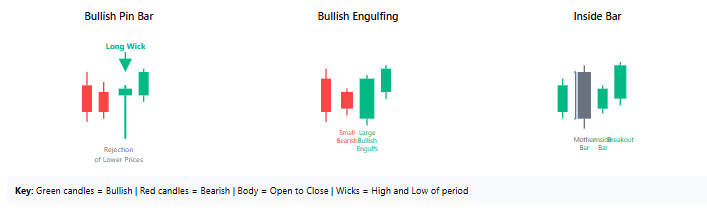
Here's why context is so important. For example, a bullish engulfing pattern in the middle of a bearish trend and far from any support is just a weak bounce before the selling resumes. Conversely, if the same pattern occurs at a demand zone after a liquidity sweep, there is a high probability of making money. Therefore, do not trade patterns based solely on their appearance.
Instead, consider the market structure and the trend direction. A mediocre pattern in a great area will always outperform an excellent pattern in a poor location.
Mastering Support & Resistance and Supply & Demand Zones
Support and resistance represent the levels at which buyers and sellers react in the marketplace. Support is the level at which buyers enter the market, while resistance is the level at which sellers become active in the marketplace.
On the other hand, supply and demand zones identify large market participants' (or institutions') zones in which they placed a majority of their orders, because the price moved military away from the zone, creating an imbalance. A support line may be tested multiple times and lose strength, whereas a newly established demand zone that has only been touched once is a powerful area. To know how strong a zone may be, find the zone in which price consolidated before making a sharp move. This is usually where all the orders were placed. When the price comes back to test the zone, many of those players defend their positions.
Every day in trading we see price moving significantly above or below established support/resistance areas before then reversing direction afterwards. Oftentimes, this reversal is done by participants that have their stops set below/below (in most cases these will be stop loss orders). This type of market activity is known as 'liquidity grabbing', 'stop hunting' and/or by other names for the same market action.
The following analogy may help you better visualize what is happening: think of support/resistance areas being similar to floors/ceilings in an office building; if there is enough force pressed onto it, it will break down.
The structural support in an office building would represent supply/demand zones and all of the various influences that weigh in positively upon those supply/demand zones, this correlates perfectly with the price patterns established through Historical Support/Resistance.
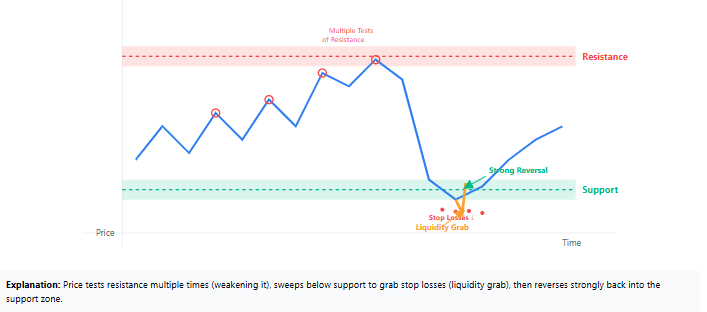
Finally, when setting up your support/resistance areas, identify those areas where there has been significant buying/selling activity – but at the majority of the areas identified through historical price action. The severity of how rapidly price reacts to either support/resistance area determines and indicates to traders how established that support/resistance zone area truly is.
The Complete Guide to Multi-Timeframe Analysis
Trading from one time frame is similar to visiting a city and relying solely on road maps without viewing the complete landscape. It’s important to get a broad view initially.
Multi-Timeframe analysis requires identifying and starting with higher time frames, identifying the Overall Trend, and then moving down into the lower time frames for exact entry positions.
Typical format: determine your long-term bias from the Monthly chart, determine the current Trend Phase from the Weekly chart, determine structure and Key levels from the Daily chart, and finally determine the best entry position by dropping to the H4 and H1 charts.
For example, assume you are analyzing the Monthly chart of Gold and notice a very strong Uptrend. You then notice that the Weekly chart just retraced to a very strong Support Zone and that the Daily chart is forming an important Bullish Reversal Pattern at that Support Zone. Now you can go to the H1 and wait for a clear entry trigger.
This process is referred to as aligning trends. When all time frames agree that price is going to move to the same place, the likelihood of your success will be greatly increased, as opposed to trying to "fight" against the price. Instead, you will be able to "ride" the current.
For a beginner, use the analogy of "zooming out" before "zooming in." A trader who only looks at the 5-minute chart may be drawn to a "perfect" trade setup, however, upon looking at the daily chart, he/she will notice that there is a strong downtrend in the market. The "perfect" trade setup can become a trap for the beginner.
So, look for direction in higher time frames; look for precision in lower time frames. Understand this and you will greatly improve your win ratio.
How to Combine Price Action With Indicators for Higher Accuracy
The use of price action does not require traders to have no indicator(s) at all on their charts. Price action is often used as confirmation, not as predictive means; however, savvy traders understand their working tools also have limitations.
Most successful traders will approach trading using price action first, confirming their trades using other tools. For instance, an uptrend shows support with the 20- or 50-period EMAs. If price is at the EMA and establishes a bullish pattern, the trader would have achieved 'confluence' (have found multiple points of support).
Trendlines can also be considered vital aspects of trading. Traders must draw trendlines directly connecting swing lows during an uptrend. When price retraces to the trendline and experiences resistance (or rejection), the breakout would be considered a viable entry. A trendline confirms a market's overall trending structure and price action confirms timing.
When traders experience low volume breakouts on their trades, they will most likely receive low levels of support from the market when price is going back towards retracing towards a full return. Nevertheless, it is advised that a trader maintain a very simplistic approach when using confirmation methods. Only one or two supportive confirmation tools will suffice.
Many rookie traders become paralyzed by indecision from utilizing excessive and conflicting confirmation signals. When this happens, it is important to implement only price action as the primary method to measure the trending direction and then confirm the action with other confirmation methods.
Smart Money Concepts: The Institutional Price Action Strategies You Must Know
Smart Money Concepts(SMC) allow you to see how Big Boys are Using Price Manipulation to Make Their Real Moves. Having this knowledge will give you a Huge Advantage over the majority of Retail Traders.
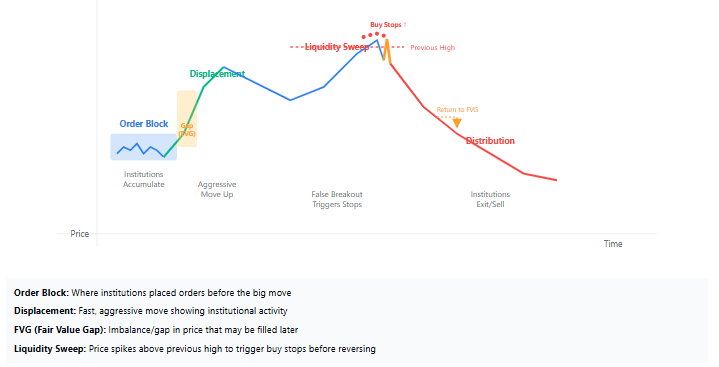
Liquidity Grab: The Big Boys require large amounts of liquidity to fill out their large positions. Therefore, they use price manipulation to push prices to areas where most retail traders stop losses. Once the price hits that area it triggers them to sell, then the Big Boys buy back soon after. This is generally seen as a False Breakout by most traders while to a Smart Trader it creates a Buying Opportunity.
Stop Hunt: A Stop Hunt operates in a similar manner to a Liquidity Grab but is much more aggressive. Stop Hunts occur when the price flies through a major Support/Resistance level triggering a mass amount of traders to get out, then reverses almost immediately. The spikes or Long Wicks through Support/Resistance are not random. They are a calculated decision made by the Big Boys.
Order Block: The order block is defined as the area in which the institutions had placed their orders prior to the price moving in the opposite direction. When price returns to an order block, it usually meets with either resistance or support from the same entities that were responsible for placing the orders there.
Displacement & Imbalance: The displacement and imbalance are defined as aggressive moves in price creating gaps, which the market can return to later as it seeks equilibrium. Traders who trade these types of events will look for a price to return to these types of events as potential entry points.
The use of SMC in combination with traditional price action completes the price picture. For example, a trader watching for price to sweep below a previous low would know there was a liquidity grab and be able to look for bullish confirmation in an order block to enter a long trade.
When beginning to learn to trade in this manner, it helps to think of institutions as being at a poker table with more cards than the average trader; therefore, following their patterns of play makes trading much easier than if traders fought against them.
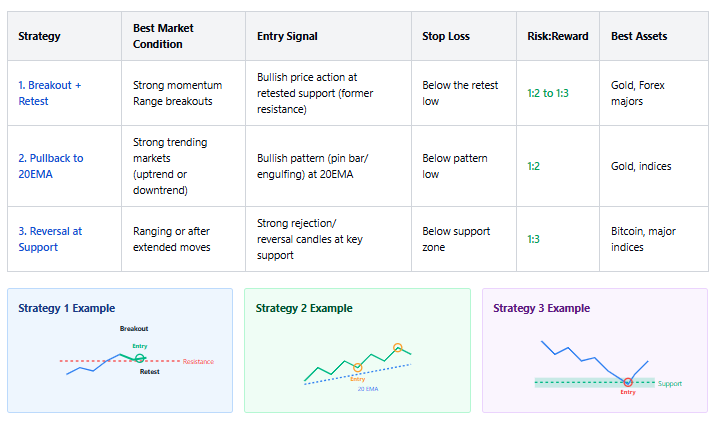
Top 3 Price Action Trading Strategies You Can Start Using Today
Strategy 1: Breakout + Retest
Do not enter immediately after getting a bullish signal through a candle that closed above a previous resistance level; wait until price retraces towards this area and confirms it has formed a new support level with bullish price action before entering.
Entry Point : Bullish action upon forming a new support level; place stop loss below the last low made off the broken level and +/- 2-3X your risk for profit.
Gold tends to perform very well with this strategy when traded with bullish momentum. The bullish price action on the candle signal + the retest helps prevent false breakouts.
Strategy 2: Pullbacks to the 20EMA in a Trend
While in an uptrend, look for pullbacks to the 20EMA on the hourly timeframe. When the price has pulled back to this level and you get a bullish price pattern (either a pin bar or engulfing candle) at the EMA, go long.
Entry Point : Bullish Price Pattern at the EMA; place stop loss below the pattern low and set profit target either at the most recent swing high or a 2:1 risk/reward ratio.
Gold performs well with this strategy during periods of strong upward price movement. The 20EMA is a dynamic support area.
Strategy 3: Reversal at a Key Support/Demand Level
Locate a strong support zone or demand area on a daily timeframe. Wait for the price to touch this zone and then show signs of being rejected through strong bullish price action. Confirm with structure that there was an elongation of the previous trend.
Entry: There is a reversal to the upside in the bullish trend at support with the stop-loss (Stop-Loss) located below the support zone. The take profit (TP) is set to reach three times the risk reward (3:1) which is also close to any previous resistance levels that existed.
Using this method with Bitcoin creates very large price reversals from the weekly support levels.
Each strategy has established rules defining how/what criteria to use when entering, establishing the stop-loss and taking profits so that each trader is confident and not left guessing at their options for trading.
Risk Management With Price Action: How to Set Stops, Targets, and Position Sizes
Without proper risk management, even the best trading strategies will not work. Risk management is what separates successful traders from everyone else!
When placing a stop loss order, consider market structure. For example, when buying at support levels, you would want to place your stop loss below the most recent swing low. This allows enough room for the trade to have some wiggle room, however, if the market structure breaks down then the trade is considered invalidated.
When it comes to position sizing, it is just as important. Never risk more than 1-2% of your total account equity per individual trade. If you have a 50 pip stop loss distance away, you need to figure out how many lots that will allow you to only risk that same 1-2% if you are stopped out of the trade.
The risk-to-reward ratio of your trades will determine if you are profitable over the long run or not. You can have a win-loss percentage of 50% with a RR of 1:2 and still be profitable, however, for best results, always aim for a RR of at least 1:2 on every trade and 1:3 when possible!
Whenever someone new to trading is starting, it is best to put it this way: You could potentially execute 50% of your trades wrong but still create a positive P&L (profit and loss) position so long as your winning trades are greater than your losing trades. BUT If your risk/return ratio is that you risk $100 in order to make only $50, then in order just to break even you must have a win rate of 70%.
What doesn't add up here is the risk/reward ratio. Professional traders will always use the Average True Range to assist them in determining their stop loss adjustment due to the Volatility of the Asset. In a highly volatile market such as that of Gold a stop loss of 20 Pips is way too tight. The ATR gives the trader a calculation of the average price action so that the trader has the ability to set realistic Stop Loss levels. Remember to always protect your capital first, then you will see Profits.
Common Price Action Trading Mistakes and How to Avoid Them
Trading against structure : Trying to pick tops and bottoms in strong trends is a sure way to lose quickly. You should trade in the direction of the trend until there is a clear break of structure.
Ignoring context : Just because a pin bar has formed, does not automatically mean it's a trade. You have to ask yourself, where did it form? Did it form in the direction of, or against the trend? It is in context that gives validity to any set-up.
Poorly marking Levels : When you draw your support and resistance levels through random bars, you are eliminating your edges; you must draw your levels off of where the market has reacted strongly to the price and not where you hope the price will react.
Entering before Confirmation: You must wait until the candle closes before entering a new trade setup. Entering a trade setup before the candle closes is being too impatient and you will not be rewarded for that behaviour.
Over Complicating: If you use 10 indicators on your charts along with price action you are creating a cluttered chart which defeats the purpose of price action trading. Stay with a clean chart and price action will help you.
The biggest mistake? Assuming that every trade setup will win. By using price action, you are only dealing with probability and not certainty. Even the best price action trade setups will fail 30-40% of the time. Your job is to manage your risk so that you have more winning trades than losing trades.
Start Trading Smarter Today
There’s no secret sauce to price action trading – no complex techniques, no pricey platforms. Simple understanding of movement of the market and acting accordingly.
You’ve now acquired the fundamentals of price action including:- market structure, key levels, candlestick patterns, multi-timeframes and institutions' behaviour. From this point forward you should be focusing your attention on applying these concepts.
Open Charts, mark your levels, identify the structure, and be patient for a clean setup.
Ready to put these strategies into action? Visit Tradewill.com to access live charts, practice on demo accounts, and trade global markets with confidence. Your edge starts here.
Disclaimer: The content of the blog does not represent any position of Trade W, does not serve as any trading-related decision advice, and does not endorse any third-party.