

 Trade W

Understanding the Price-to-Book Ratio
As you review stock screeners or analyst reports, you'll notice the P/B ratio featured with several other metrics. What is it, and why do you care? The Price-to-Book ratio essentially compares the market price of a stock to its book value per share. The book value is a representation of how much a company would be worth if you liquidated all its assets and paid off all its debts right now. So, the P/B ratio is showing you how much investors are paying for each dollar of those net assets as determined by the company's books.
The formula is straightforward: P/B Ratio = Share Price ÷ Book Value per Share
For example, imagine you're looking at a technology company with a market share price of $50, and the book value per share is $25, then the P/B ratio is 2, which means investors are paying twice what the company's assets are worth on the books. That seems strange, but there is usually an explanation for that.
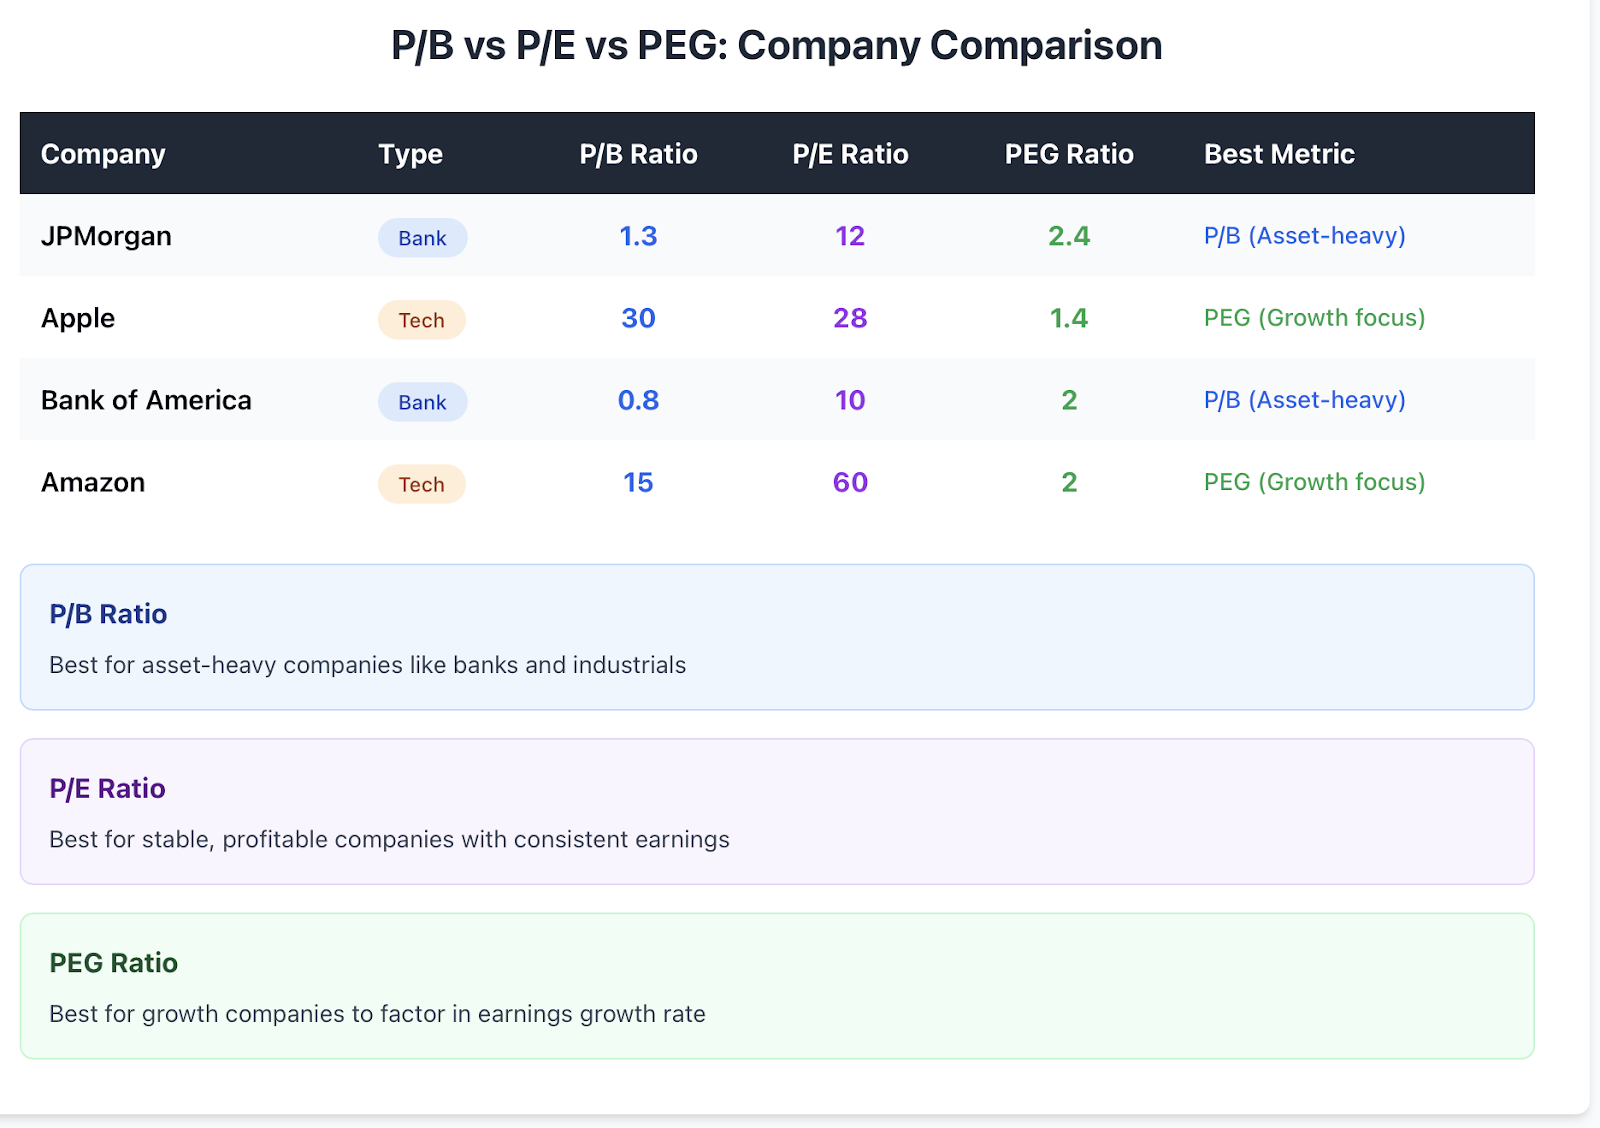
Institutional investors interpret P/B ratios somewhat differently, working to compare a firm's P/B to a broader industry average for investment opportunities. For example, JPMorgan Chase usually owns a P/B ratio near the level of 1.3, while one could argue Apple's P/B is closer to 30.
Understanding these two companies' P/B ratios raises the question of what's actually happening here, which ultimately is a reflection of who owns what and what is considered valuable. Banks like JPMorgan possess considerable tangible assets (loans, mortgages, real estate, cash, etc.), and therefore, there is considerable and reliable book value.
Apple, on the other hand, derives its value from things like brand equity, intellectual property, and future earnings potential, which do not show up to any large extent in book value calculations, resulting in a much higher income multiple than JPMorgan.
The point to be made is that the P/B ratio can be a useful ratio to assess relative value, but this ratio should not be viewed in absolute terms either. It is vital to understand the industry context of this ratio, and more importantly, to comprehend what value actually means for a particular company.
Core Concepts: Breaking Down the P/B Ratio
Let's take some time to evaluate what drives the P/B ratio specifically. Book value is a measure for a company's net assets, meaning total assets minus total liabilities, which is the amount a shareholder would receive if the company sold off all its assets today.
When you have a low P/B ratio (less than 1), it indicates that investors are valuing the company less than its assets. This can be interpreted in a couple of ways, either that the market senses issues ahead or that they think the stock represents a value opportunity. In the instance of Bank of America, the company typically trades around 0.8 times book value. Is the company struggling? Not necessarily, as banks can often trade below book value as a concern over loan losses, regulation or a shift in the economic climate.
In the case of high P/B ratios, there lies a different analysis. Amazon typically trades 15 or so times book value because the investor is not buying shares for the book value of the warehouses and trucks, they are buying into future growth, control of the market, and the associated cash flow that may arrive in the future. The company's true value rests in its ecosystem, technology, and customer loyalty, none of which reside on a company's book value.
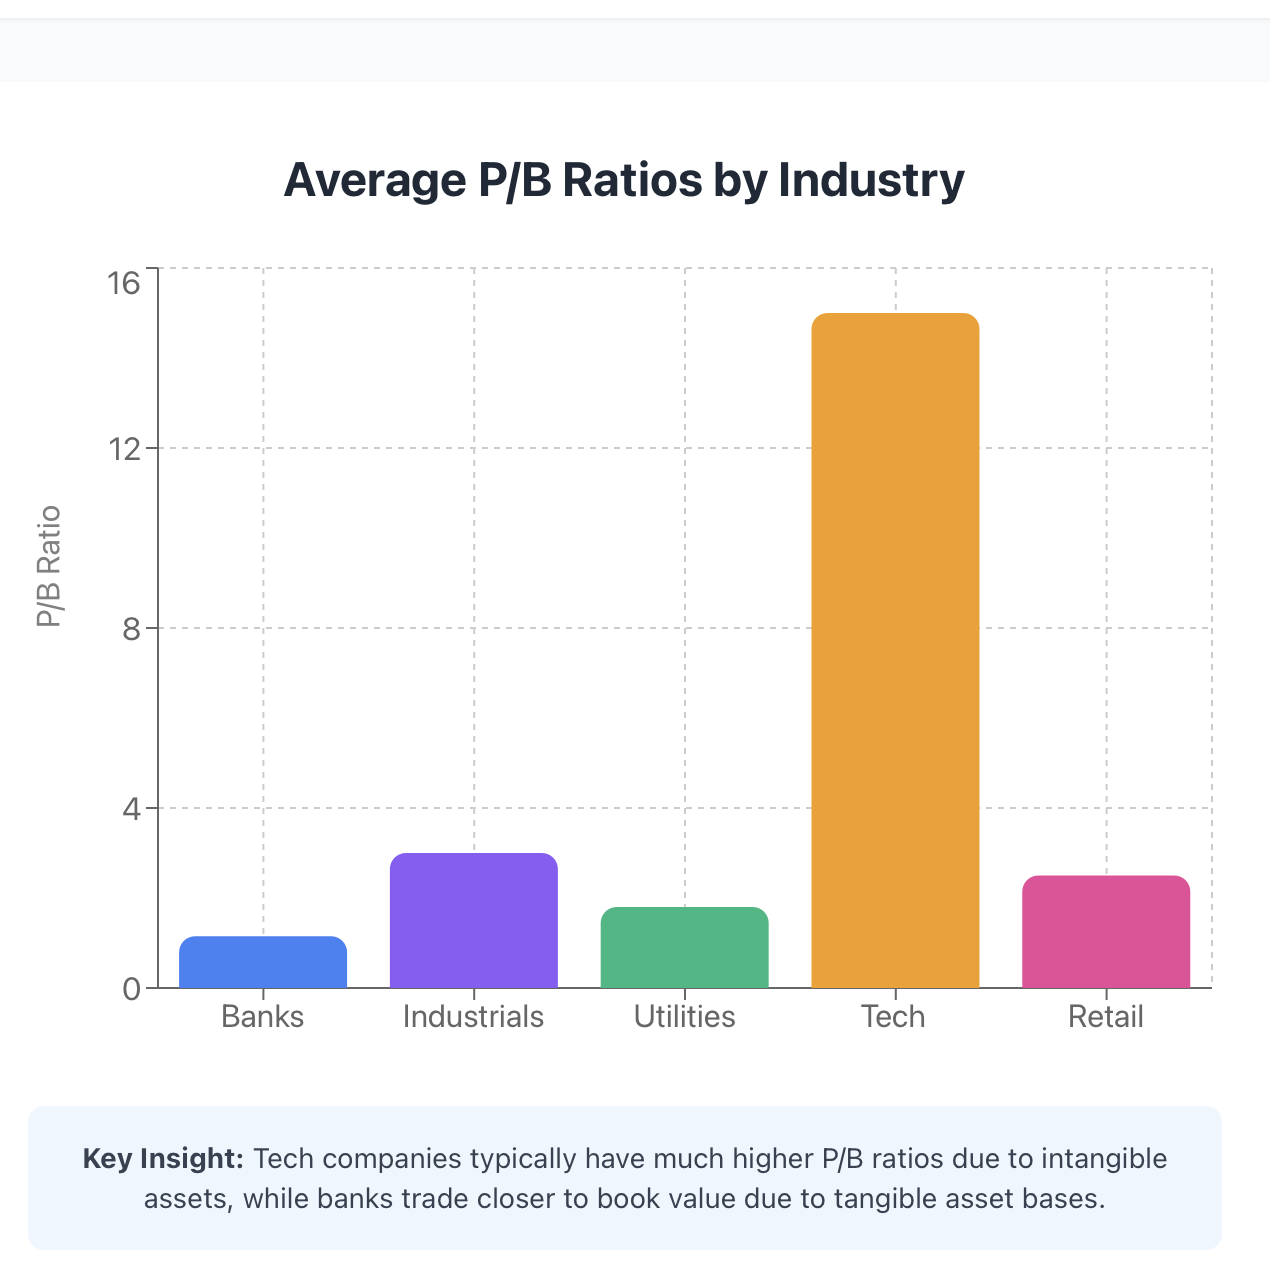
Companies with large amounts of capital, like manufacturers or utilities, are always going to have lower P/B ratios than growth companies, like tech firms or biotechs. This is largely because asset-heavy companies have greater book values, and therefore lower P/B ratios, because handedness capital is often attached to the fixed asset heavy nature of a company's operations. Growth companies will have higher P/B ratios, since the bulk of their company assets are intangible and, as result, do not appear on the balance sheets.
To illustrate, think about a retail company that trades for $30, with a book value of $20. That is a P/B of 1.5, with investors paying a 50% premium over book, perhaps because they believe there will be growth, profits generated, or their location and inventory is very valuable.
Some industries have very low average P/B ratio versus other industries, and P/B ratios can range highly among industries. For example, a bank may generally have a P/B ratio between 0.8 and 1.5, industrial companies typically have P/B ratios between 2 and 4, and you're lucky to see tech companies go anywhere from a P/B ratio of 5 to 30, or even greater. Saying that you want to compare the P/B ratio of a bank to a software company is like saying you want to compare apples to spaceships, it just doesn't make sense.
In summary, to understand how to interpret P/B ratio, you must think about what kind of business you're looking at and where the value comes from. Again, it isn't that a "good" P/B is better or worse, it might just be okay or bad compared to another industry.
History and Evolution of the P/B Ratio
The P/B ratio has significant historical context in value investing, which was popularized by Graham early in the 20th century. He is referred to as the father of value investing, and part of his philosophy was that an investor should seek out the stocks of companies that were trading for less than the intrinsic value of the business. Book value became one of the primary metrics in Graham's approach to investing because it presented a tangible and conservative measure of what a company owned. Graham's opinion on book value was heavily anchored in the traumatic experience of the Great Depression, where he witnessed the destruction of wealth from speculation and neglecting the fundamentals of investing.
Graham wanted an approach to investing that relied on metrics immensely grounded in the realities of a business, which is why he settled on book value. His book, "The Intelligent Investor," introduces investors from generations with investment ideas like investing in companies who had a stock price below their book value for a margin of safety.
Over time, the P/B ratio became common in value-investing styles of investing, where fund managers would screen for P/B stocks below the P/B value in a hypothesis highlighting that the stock was out of whack or in value territory that markets had ultimately missed or relied on flawed prevailing economic or business assumptions. Value-investing styles of investing typically work exceptionally well in financial companies, industrials and asset-heavy businesses.
Today, many value-oriented ETFs (exchange-traded funds), including the Vanguard Value ETF, indicate that they also employ the P/B ratio in part of their screening criteria. Very consistently, those funds buy stocks with lower P/B ratios than growth-focused funds. Another example is the S&P 500 Value Index, which invests in companies that have lower price-to-book ratios and lower price-to-earnings and sales-to-price ratios.
For those wanting to play along at home, you can simulate this process yourself. Consider investing $1,000 every year into the five stocks of those with the lowest P/B ratios in an index. This strategy has produced reasonably strong returns over the long run, in data, but with more volatility than simply buying the whole market. Over the course of 20 or 30 years, the benefit of compounding can be immense.
The P/B ratio has made the journey, from being just a safety metric during the Depression, to a much more sophisticated tool of value investment made by professionals across developed markets. Professional value investors will continue to use the P/B ratio for certain parts of the economy, while others declare it would be incompetent to use it for tech companies. The P/B ratio survives fundamentally because it is answering the perpetual question: what does it actually cost?
Advantages and Limitations of P/B Ratio
As with any financial metric, the P/B ratio has pros and cons that you should understand before you place reliance on it.
Benefits:
The P/B ratio provides a quick snapshot of relative value. You can look over dozens of stocks in just a few minutes and see which stocks are trading cheap relative to assets. The speed matters when you are comparing a number of investment opportunities.
It gives you a great picture for asset heavy companies. Banks, insurance companies, manufacturers, and real estate companies all have substantial tangible assets that book value captures well. For these companies, the P/B ratio gives you a real understanding of valuation.
If you use the P/B ratio alongside other metrics like P/E (price-to-earnings) or EV/EBITDA (enterprise value to earnings before interest, taxes, depreciation, and amortization), you get a more complete answer. Professional investors rarely look at just one metric at a time. They check if the P/B stock with a low value also has decent earnings, a reasonable amount of debt, and positive cash flow.
Limitations:
The P/B ratio is not applicable when evaluating companies with high levels of intangible assets. Companies will have value tied up in the content library, brand power, intellectual property, and network effects. None of this value is indicated in book value.
For example, say that Tesla trades at a high P/B ratio, that does not mean that it is overvalued just because the ratio is high, if you believe in the technology or market position. I personally think P/B ratio alone can be a misleading way to value companies. A company might have a low for good reason - it is indeed struggling, obsolete, or has undisclosed liabilities. Either way, you would be obligated to know the reasons for the P/B ratio.
You should also realize that book value can also be manipulated through accounting choices. Companies can decide to write up or down value on assets, change depreciation methods, and other techniques that have no bearing on the operating fundamentals of the business. For beginners, you want to narrow down your search to industries where P/B ratio has merit.
You can compare retail companies or manufacturers where book value has tangible significance. You do not want to use P/B ratio as a measure to value a software company or a consulting company where the assets are people and ideas.
Professional investment managers at banks such as JPMorgan Chase or Wells Fargo will often look for undervalued financials using P/B ratios. They know the business model, understand the quality of the underlying assets at valuations, and know what reasonable multiples look like. Further, they layer in an analysis of the credit, reputation risk and regulatory context and forecasts for the local economy.
The takeaway: P/B is valuable when deployed properly, and dangerous when mismanaged. Be aware of what you are analyzing and what are drivers of value in that industry..
Using P/B Ratio in Your Investment Strategy
Are you prepared to implement P/B ratio in your investment strategy? Here is one way to create a practical strategy.
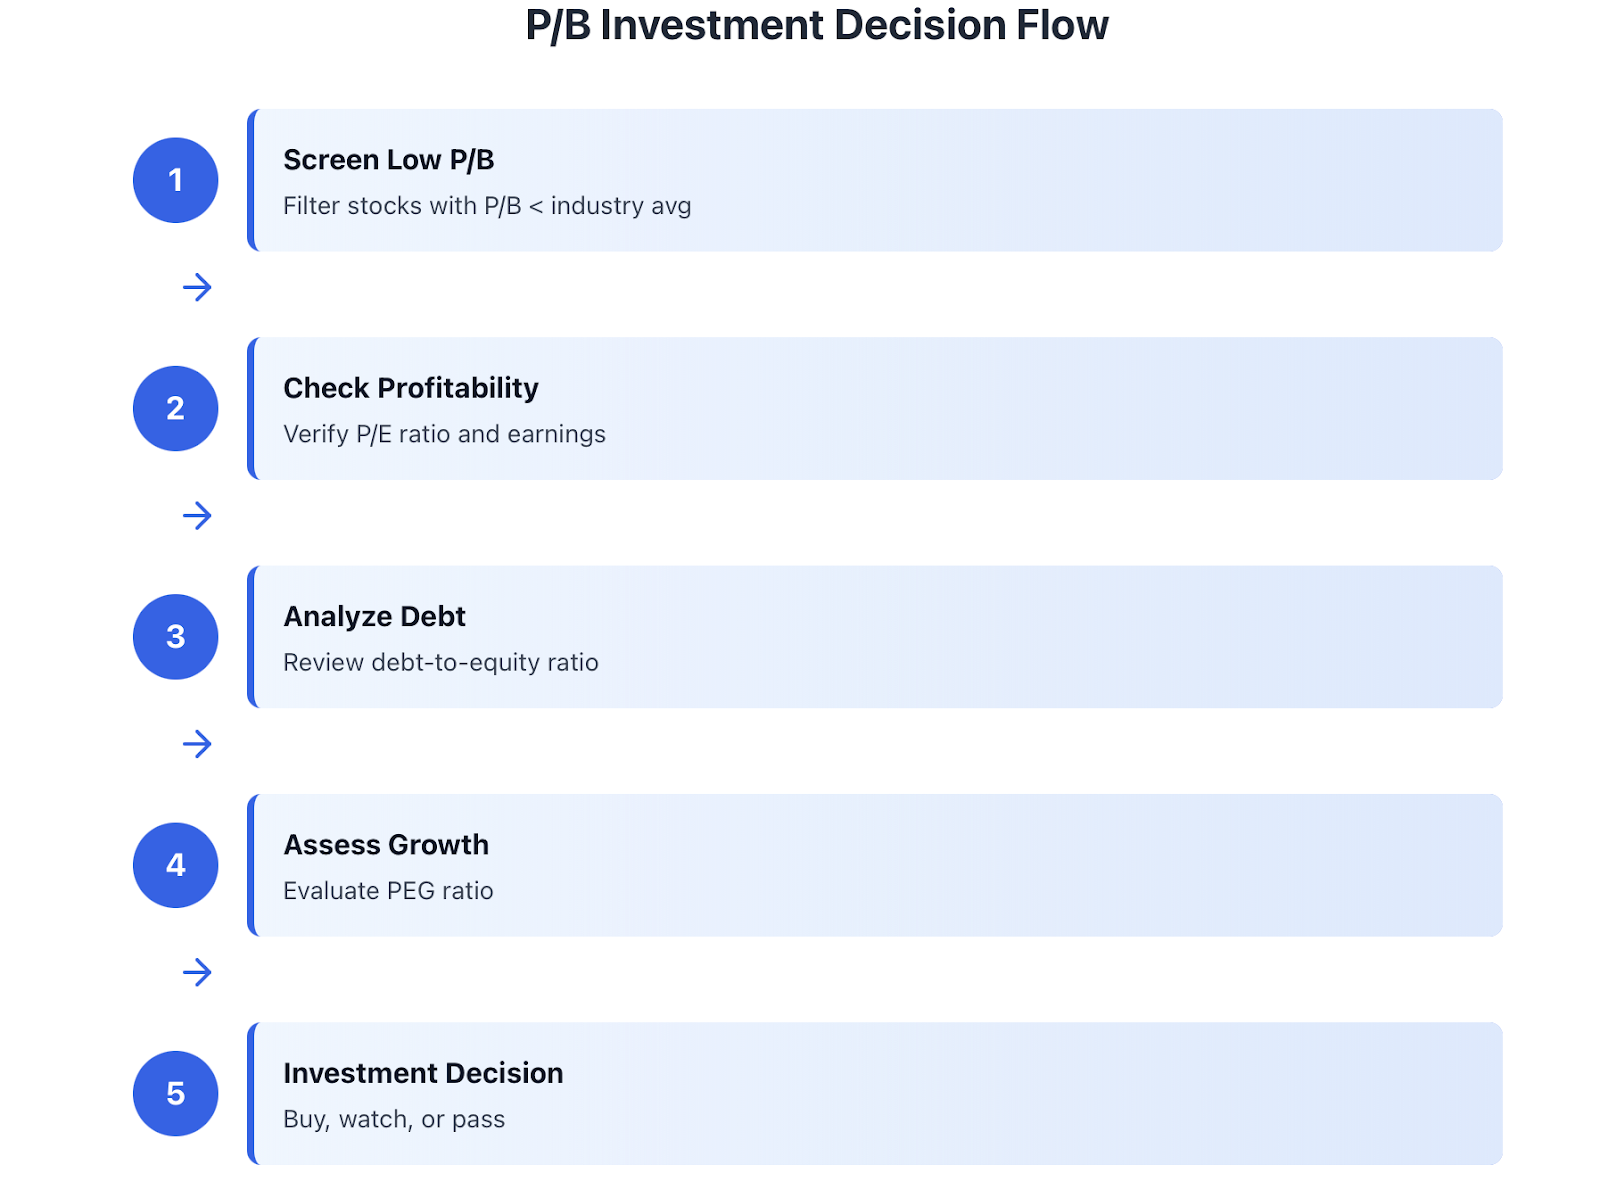
Begin your process by screening for low P/B stocks in select industry areas where P/B could be meaningful. Focus on financials, the industrial sector, utilities, and basic materials. Set your screener to only show companies listed with a P/B ratio in the lowest quartile of their industry. This yields a list of our most potentially undervalued candidates.
Now you will want to do further screening. Review the P/E ratio to confirm the company is profitable. A company with a P/B ratio below 1 but with negative earnings could indicate a company that is burning through assets. Use the PEG ratio (P/E/ by growth rate) ratio to determine if the business has growth potential as well. Examine how much debt the company is leveraging to confirm that it is not too much debt.
Professional portfolio managers will systematically blend these ratios. They may, for example, build a portfolio of 20-30 stocks with P/B below 1.0, P/E below 15, and a debt to equity ratio below .5. Then they would further diversify in separate industries to create a method of risk management. They would also look at this portfolio on a quarterly basis and rebalance if the portfolio does not perform as planned.
As a beginner, you could try this exercise: take five stocks individually having a low P/B ratio across different sectors, try to understand why it has a low P/B ratio. Was it because of a temporary weakness in the industry? Is it a turnaround situation? Or does the stock have a real problem? Create a simulated portfolio along with these five stocks, and track them for six months to see if your analysis followed through.
Value ETFs, like Vanguard Value ETF or SPDR S&P 500 Value ETF, essentially do the visible work for this transaction. You will have instant diversification if you sit back and enjoy the portfolio being systematically filled with low P/B companies. If you are just initiating, it may make sense to focus value ETFs instead of trying to pick stocks.
Going through the process of regularly reviewing your stocks and portfolio would be more important than merely making an initial decision on stocks. The market changes, the company changes, and valuations shift. A six-month stock that looked cheap at first may not be fairly valued, or the stock could now be valued high. Have a schedule to review your portfolio on a quarterly basis, and make means of adjusting your position.
The biggest mistake for beginners is for them to treat P/B ratio like it is some magical number. P/B ratio is just a tool, from the thousands of other tools available to a value investor. You'll want to utilize P/B ratio as a part of a larger strategy, along with risk management, diversification, and potentially realistic rate of return expectations.
P/B Ratio vs Other Valuation Metrics
Knowing how the Price-to-Book (P/B) ratio compares with other measures gives you insight into when to use each.
The Price-to-Earnings (P/E) ratio tells you how much you are paying per dollar of current earnings. The P/E is useful for companies earning a profit with relatively stable earnings, but not as useful for companies that have not generated profits. The P/B ratio will work in the case of earnings that are temporarily depressed or negative, as long as the company has positive equity.
The Price-to-Earnings Growth (PEG) ratio (P/E divided by growth rate) provides the growth component. A stock might have a P/E ratio of 30, but if earnings are growing at 30% per year the PEG equals 1.0, indicating the stock is fairly valued. The P/B ratio does not inherently factor growth, which is why the P/B ratio usually undervalues companies with high growth.
When would you want to use P/B ratio to evaluate a stock? Financial stocks are the classic example of using P/B. Bank earnings can be volatile and impacted by one-time events, whereas book value is generally stable. Professional fund managers evaluating JPMorgan Chase, for instance, would analyze both P/B and P/E, but would lean heavily on P/B, because it incorporates capital adequacy and asset quality.
P/E ratio and the PEG ratio is far more useful than the P/B ratio. The companies are generating enormous inflows of cash from their intangible assets (software, service, ecosystems), and as such, the book values have nearly no importance!
The following example is oversimplified: assume I have three companies with a valuation of $100. The first company (a bank) has a book value of $80, $10 in earnings, and a growth rate of 5%. The second company (a manufacturer) has a book value of $50, $8 in earnings, and a growth rate of 3%. The third company (a technology firm) has a book value of $20, $5 in earnings, and a growth rate of 20%. Using the P/B valuation, the first company scores the highest (P/B 1.25).
With the P/E ratio, the second company scores the highest (P/E 12.5). With the PEG ratio, the third company scores the highest (PEG 1.0 for a high growth business). In reality, what is considered a "good" score for any of these metrics depends on what is important, for that business, for that investor.
Investors that are investing smartly are more sophisticated than simply looking at one metric. They may screen for potentially undervalued candidates using the P/B ratio, then confirm profitability using the P/E ratio, and lastly, check for growth using the PEG ratio. Each metric answers different questions, and you want to have all the answers.
Global Market Case Studies
Let's examine how P/B ratio applies in real world markets around the world.
US bank stocks are excellent examples for the concepts of P/B investing. Both Bank of America and Citigroup traded almost at 0.5 times book value at some point after the 2008 financial crisis. Investors that purchased shares when the P/B ratio was both below 0.5 or 0.6 may have limited risk seen outstanding returns, when they held their investments during the 2010s recovery due to the company stock earning back toward the historical trading premium or in excess of 1.0.
European industrial companies like Siemens and insurance companies like Allianz display European examples of investing on the basis of P/B ratios, particularly at some point when the P/B ratio was below 1.0 and usually even less than that discount. All of these mentioned corporations had very large, separately reported, tangible asset bases, and the prices of these assets were often entirely understating the future potential and value of the P/B ratios due to some prevailing uncertainty in Europe, making those stocks excellent valued investments.
Long-term studies do show P/B portfolios have produced better risk-adjusted returns than higher P/B portfolios over time in developed markets. Academic research in the US over multiple decades in the US stock market suggests that if you create candlestick portfolios of the stocks trading below 0.50 or 0.60 P/B ratios, then held for 3-5 years received achieve higher average returns than holding high P/B portfolios.
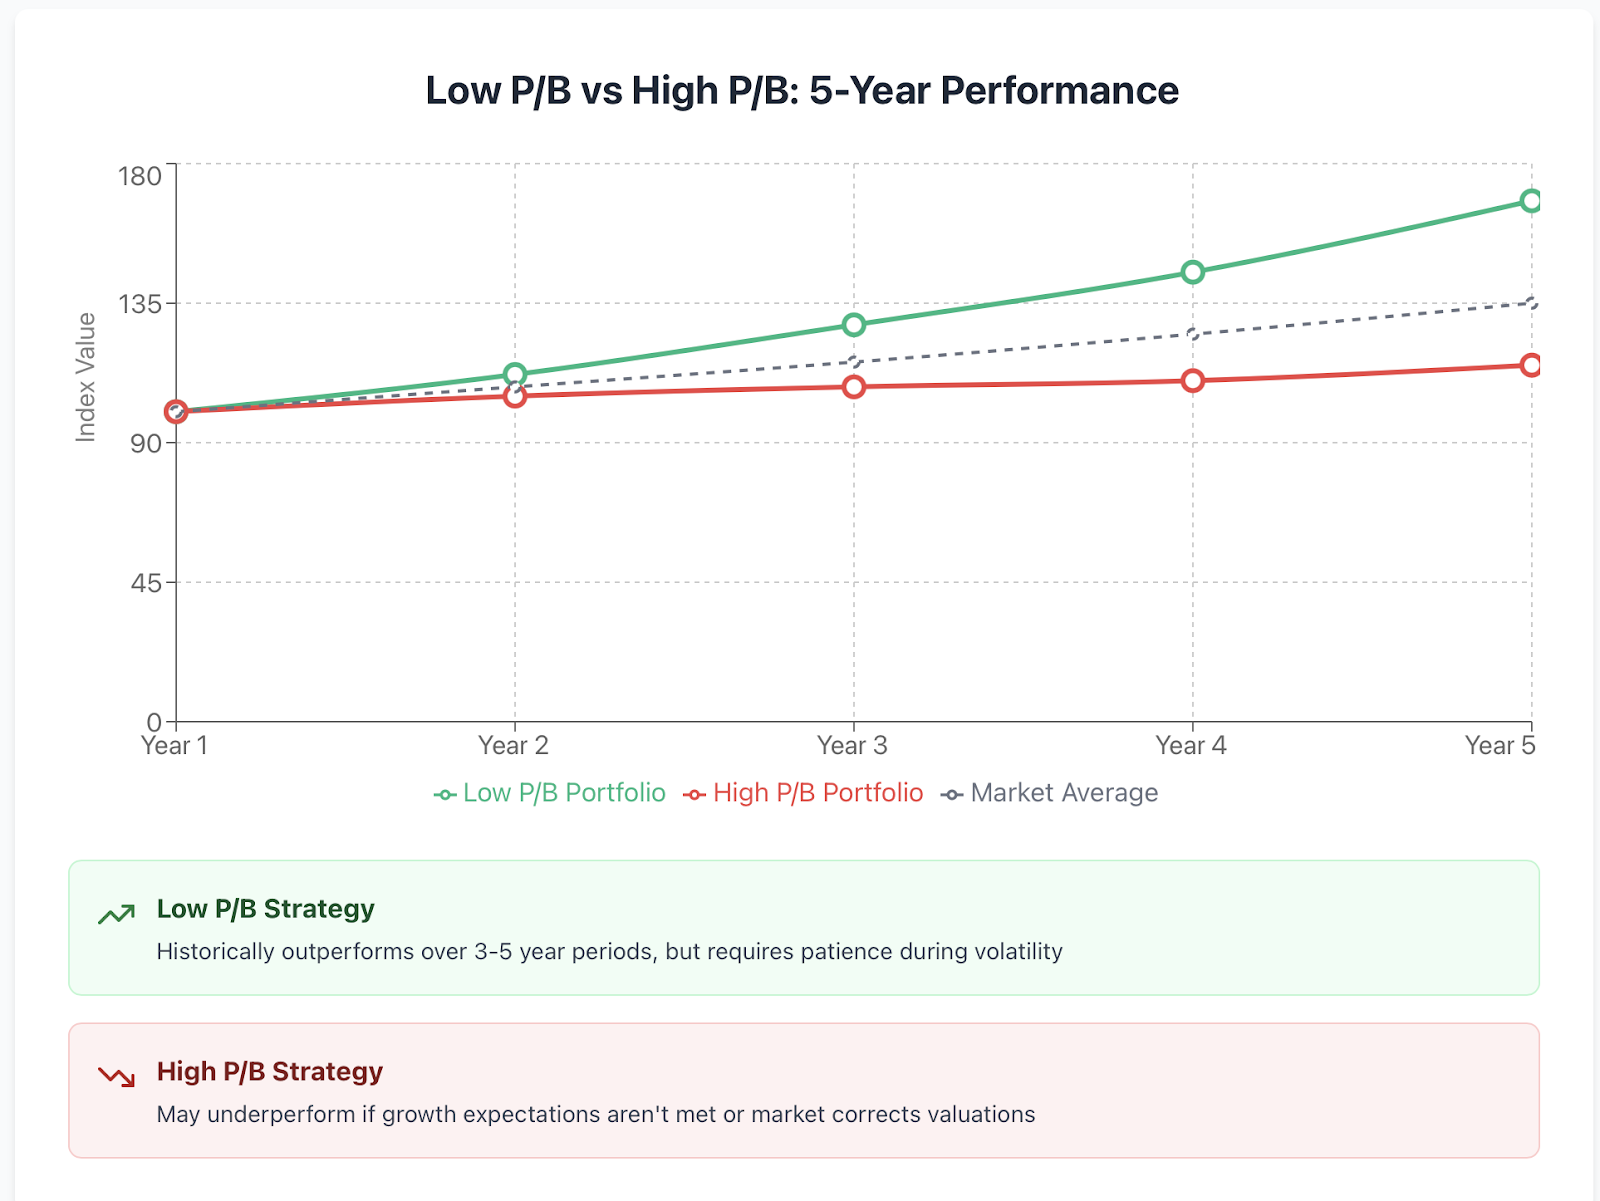
This trend appears to be consistent worldwide. Academic research on stock returns in European, Japanese, and emerging market convincingly supports this conclusion. Low P/B strategies outperform stocks (and markets) regardless of geography or time period, hinting that it is, in fact, a real phenomenon and not merely a product of data mining.
For novice investors, you might put together a global low P/B portfolio. You could select two bank stocks in the United States, two industrial companies on the continent of Europe, and one utility company from Asia, each with P/B ratios below their industry averages. Then, keep track of how this diversified value portfolio does as a stand-in for simply investing in a global index fund.
The downside is that low P/B investing requires a lot of patience. The stocks won't immediately appreciate if they are undervalued; they can remain engaged in a cheap valuation for many years while the market universalizes the value of the investment. You may experience a few years period of underperformance before the strategy dresses well. Truly professional value investors endure this wild rollercoaster ride because at some point they believe there will be some mean reversion.
There are also different average P/B ratios in some equity markets. For instance, Japanese stocks have historically traded at lower P/B ratios than U.S. stocks, which can be a product of accounting practices or different investor expectations. Similarly, stocks in developing or emerging markets may trade at low P/B ratios due to perceived future higher risks (not necessarily better values).
What we learn from global case studies: The P/B ratio is a successful value investing strategy that has worked in different markets and timeframes, though requires discipline, patience, and a knowledge of local market conditions.
FAQ: Common Questions About P/B Ratio
What industries are a good fit for P/B ratio? One that works well is financials (banks and insurers), industrial companies, utilities, and real estate. In short, any company with significant tangible assets. As a general guideline you want to stay away from tech, consulting, or asset light businesses and not use P/B as your main valuation metric.
Is a high P/B bad? Not necessarily. Generally, what a high P/B ratio tells you is that the market is anticipating better growth, rare or valuable intangibles, or superior returns on equity (ROE). The example of Amazon: it had a high P/B ratio based on market share and the possibility of growth ahead and not because it was necessarily overvalued. The question is whether the high P/B that is being priced, is based on strong fundamentals.
How/when do I combine P/B with other valuation metrics? Starting with P/B is a great way to evaluate potential value opportunities. From there you can follow that up with P/E to confirm earnings / profitability, review debt levels as your proxy for financial health and then look at earning momentum. A company might have a low P/B, and in this case your first concern should probably include P/E and cash flow rather than look at P/B alone. If you find a company with low P/B, reasonable P/E and healthy cash flows, it is going to be more interesting than one with truly low P/B.
Is it appropriate to periodically review my portfolio based on a company's Price-to-Book (P/B) ratio? Yes, but don't get overly stressed. You should periodically review your holdings quarterly to semi-annually. If any of your holdings P/B ratio has increased significantly because the market has finally recognized the company's value, it may be time to lock in those gains. If any of your prior holdings P/B ratio remains depressed and there is no improvement in the fundamental business metrics, either market competitors are improving, you're wrong on the underlying business thesis, or the market is correct and you need to reevaluate the investment.
Does the P/B ratio work for long-term investing? Absolutely. Many successful value investors have made a career of buying stocks with low P/B ratios and then holding them for 3-5 years. This works best when you're patient and hold a diversified portfolio of selected low P/B ratio stocks. You will simply need to determine those that are currently cheap for good reasons, and those that are simply undervalued.
Conclusion: Making P/B Ratio Work for You
The P/B ratio is an excellent indicator in evaluating stocks, particularly in industries where tangible assets are important. You have learned that the P/B ratio measures the amount you are paying per dollar for a company's net assets and P/B ratios are useful for financial and industrial companies while they are of little use for asset light companies.
Smart investors will utilize P/B ratio but only as one of many tools in their toolbox for investing. Use P/B ratio in conjunction with valuation metrics such as P/E, PEG etc. Always consider the industry when analyzing valuation metrics. Questioning why a particular metric is relatively high or low is more important than simply recognizing the value. Most importantly, be sure to analyze the actual business model of the company before investing.
Value investing is ultimately about taking advantage of assessing valuation metrics, including P/B ratio, and has proven to be a successful strategy for decades and in various markets, because it is based upon the simple fact that in the market, there will always be a price at which a market undervalues a good company. However, identifying these instances takes a significant commitment to discipline, patience, and analytical tools.
Ready to test your P/B ratio skills in real market conditions? Open a Tradewill account today and use our advanced screening tools to find undervalued stocks. Put these strategies into practice with simulated trading before risking real capital.
Disclaimer: The content of the blog does not represent any position of Trade W, does not serve as any trading-related decision advice, and does not endorse any third-party.