

 Trade W

Why the Price-to-Sales Ratio Matters
If you are researching stocks, then you have likely heard of the price-to-earnings ratio. However, there is another metric often not discussed, especially when you are analyzing high growth companies or unprofitable companies: the Price to Sales Ratio, or Price to Sales (P/S) Ratio.
The Price to Sales Ratio looks at how much an investor is willing to pay for every dollar of sales. It calculates the ratio by taking a company's market cap (market capitalization) and dividing it by the company's annual revenue. As such, it considers the overall sales or revenue of a company. It is different from the price to earnings ratio (which considers profit) or the price to book ratio (which considers book value). The Price to Sales Ratio is particularly useful when looking at companies that are not profitable now, but are growing quickly.
So imagine, you own a lemonade stand that sells $100 every year. If someone says, "I will pay you $500 for it," you are looking at a 5 (the ratio) Price to Sales Ratio (or 5 times sales). Pretty easy!
The P/S Ratio is a more thorough measure of valuation in cases of earnings volatility or manipulation in professional investor circles. For example, shuffling through Salesforce's high-growth years, its comparison of P/S Ratio to competitors Oracle or Adobe gave investors a better pulse of whether Salesforce stock was repriced appropriately, even while it was reinvesting enormously and providing minimal equilibrium profit.
The beauty of a P/S calculation is the simplicity of the metric and its resistance to accounting trickery. Companies can shift around depreciation schedules and one-time charges to jack-up earnings, but revenue? That's a lot harder to goof up. Overall, the P/S Ratio is a good jumping-off point to determine whether a company is worth further research (especially regarding the tech sector), as companies are aimed usually to grow rather than produce profits at an equal level.
Core Definition of Price-to-Sales Ratio
Let us explain the math. The P/S Ratio is not complicated.
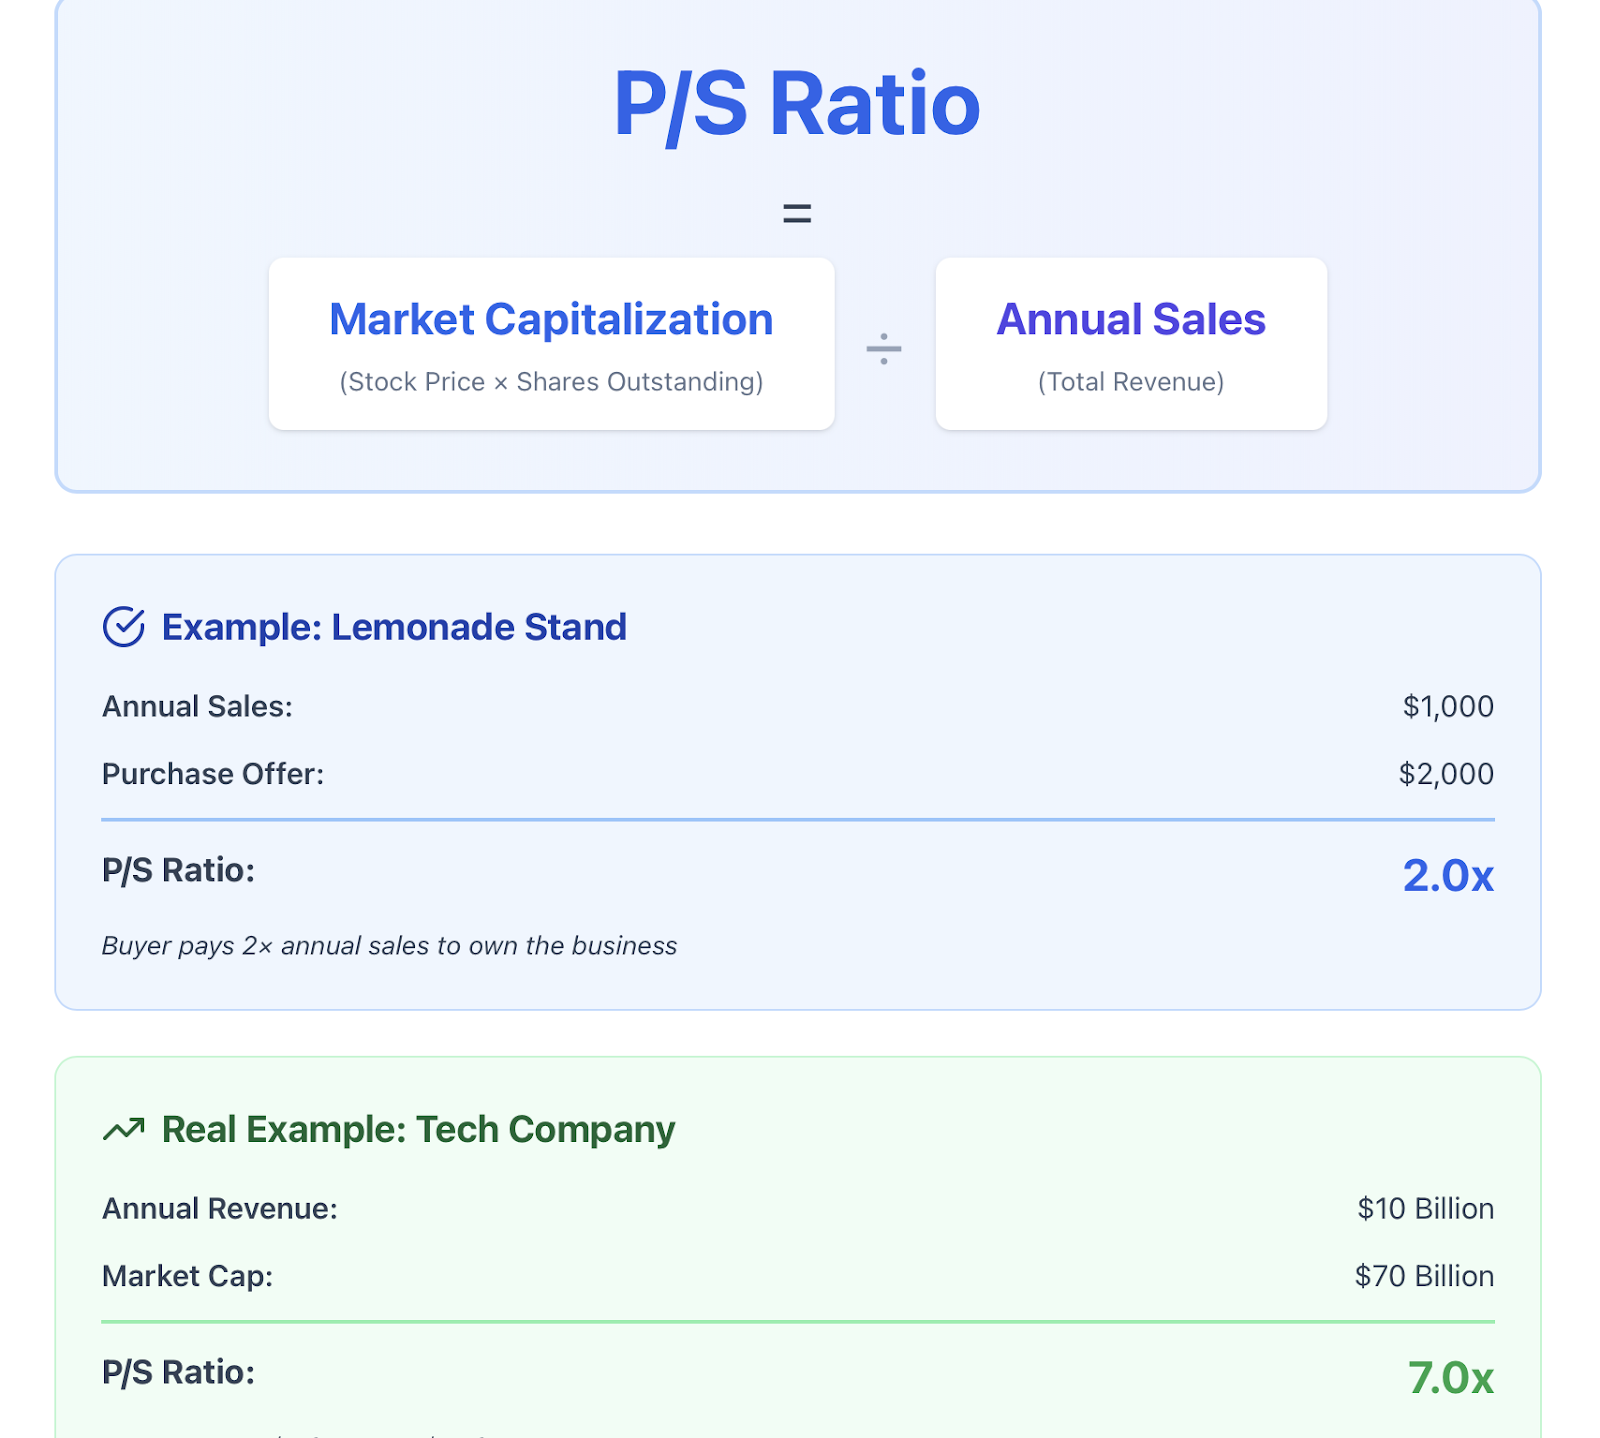
P/S Ratio = Market Capitalization ÷ Annual Sales
Market cap is simply the stock price multiplied by total shares outstanding. Annual sales (a.k.a. revenue) are the total dollars a company brings in during one year, prior to any expenses.
Here is a real-world example: if you sold 1,000 drinks at $1 last year, you had $1,000 of revenue. Somebody comes along and offers you $2,000 to buy your stand, assuming a P/S Ratio of 2, meaning that they are willing to pay 2 times your annual sales to own the business.
So what does this number really mean? Generally speaking, a lower ratio suggests the company may be undervalued relative to its sales, while a higher ratio suggests the company could be overvalued. But context matters. A P/S ratio of 3 may be expensive for a grocer, but cheap for a software company.
Consider Spotify. In 2024, Spotify's Price-to-Sales (P/S) Ratio was right around 1.8, actually lower than many of its streaming competitors, which means that even though Spotify is "king" of this market, investors are not paying a premium for every $1 of revenue, compared to many competitors. From a value standpoint, that could indicate an opportunity if you thought Spotify's profitability would improve over time or the market received revenue growth better than other competitors.
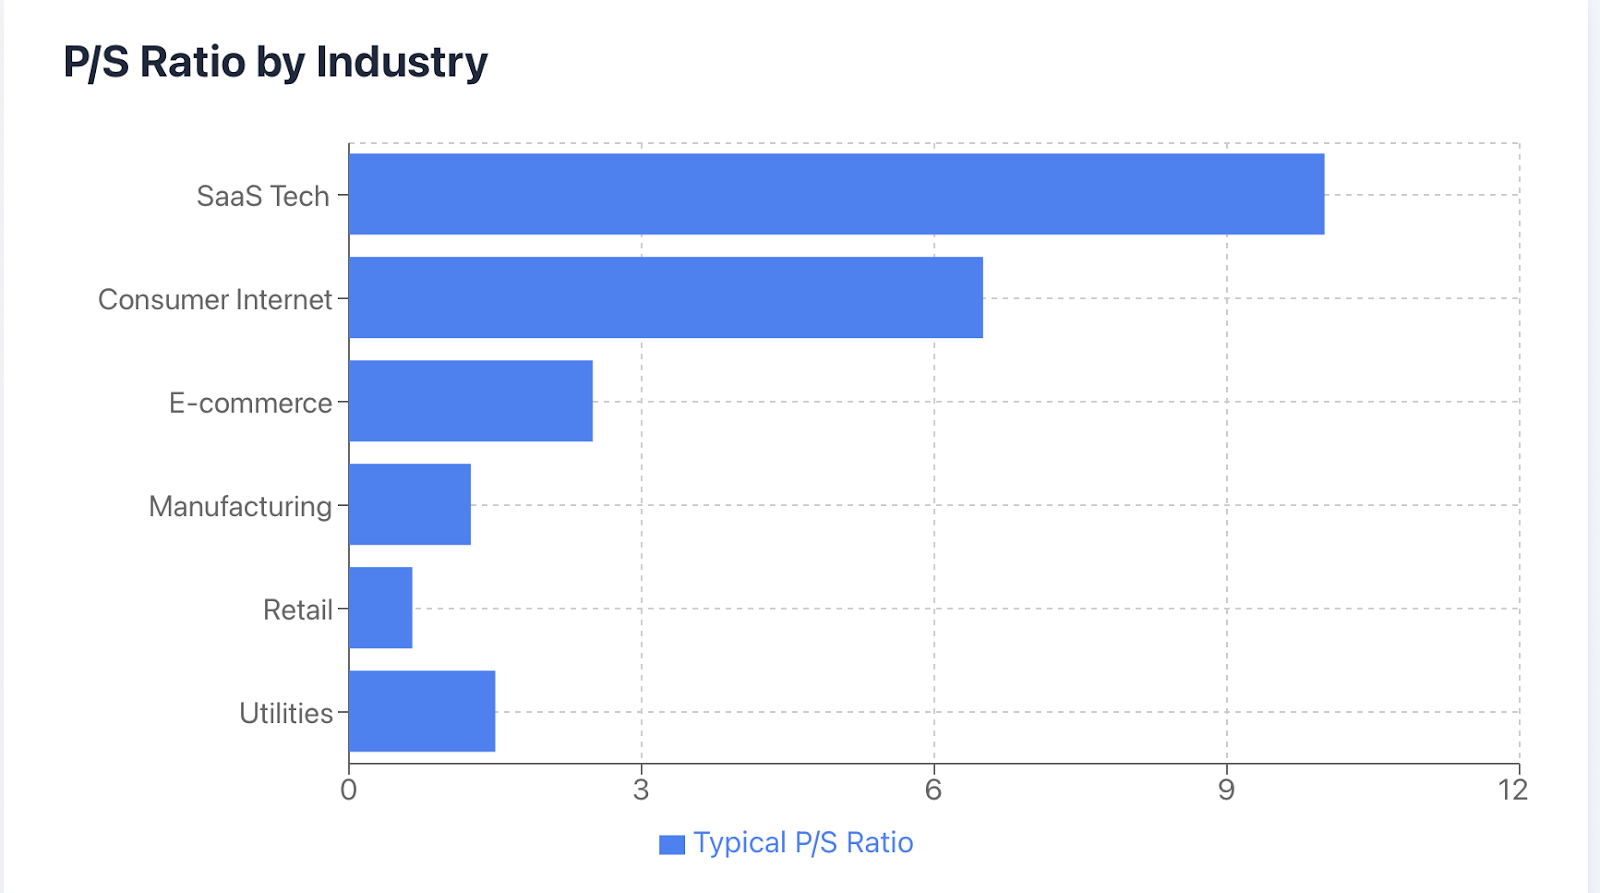
This context is important. High-growth technology companies have expanded P/S Ratios, generally from 5-15 or even greater since investors expect rapid advancement of revenue. In contrast, older manufacturing companies would trade at P/S Ratios <2 since they tend to have less growth than could be anticipated. Retail type businesses have fairly conservative growth and will range from P/S Ratios of 0.5-2, higher for the more established storefronts, and lower for e-commerce.
When comparing P/S Ratios of companies, only compare like to like. Do not compare a software-as-a-service business to an automobile manufacturer. Their business models, margins, and growth expectations would be quite different.
History and Evolution of P/S Ratio
During the 1980s, as investors sought alternative methods of valuing companies beyond earnings, the P/S Ratio grew in popularity on Wall Street. It truly became a significant force during the dot-com boom from the late 1990s into the early 2000s. A slew of internet companies were losing money and had little or no profits; thus, the P/E ratio was meaningless. However, they did have revenue, allowing the P/S Ratio to serve as a leading valuation metric.
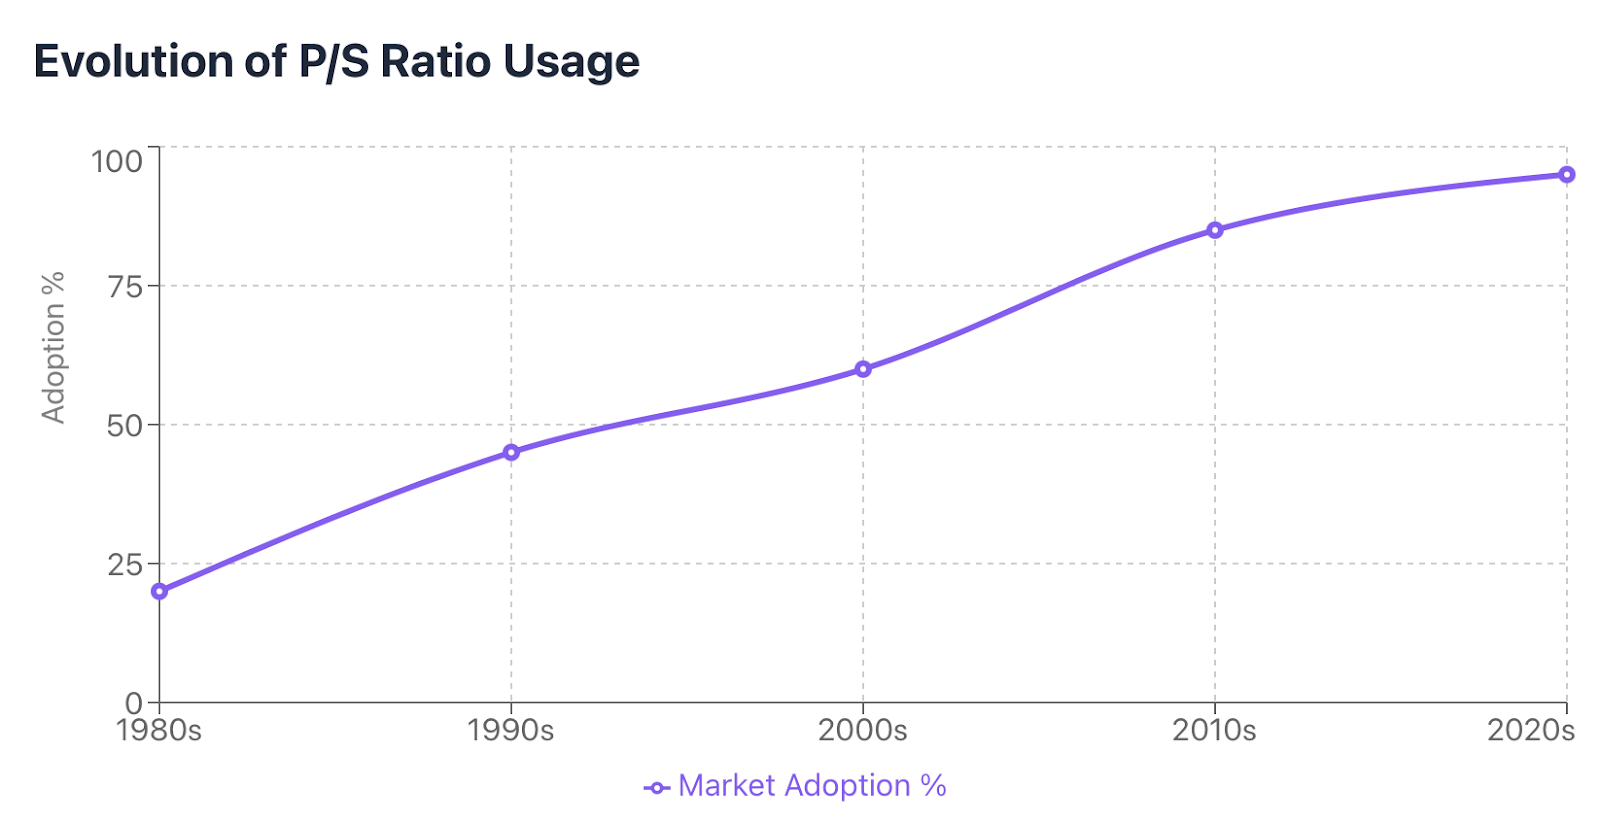

For example, during Amazon's earlier years when it went public in 1997, the company was nowhere near profitable; it wouldn't even be measured by the standard metrics. Amazon was growing revenue at an impressive rate. Investors who followed the P/S Ratio recognized that despite the inflated valuation, the company was earning huge market share. Those investors made a lot of money investing based on revenue growth.
The second wave of the P/S Ratio came in the 2010s and early 2020s with the emergence of tech unicorns entering the public markets. Companies like Zoom, Snowflake, and Spotify became publicly traded with little or no earnings but impressive revenue growth rates.
For emerging markets and growth stocks, the P/S Ratio offered a means to evaluate value while profits were still generations away.
To make the concepts clearer, think of it like this: picture a new gaming console that just came out. Sales are skyrocketing, everyone is clamoring to get one, but the company is losing money because it spent so much on development and marketing. Under these circumstances, the P/E ratio would either make the company look terrible or not work at all. However, under these circumstances, the P/S Ratio would show that investors are excited to invest in the revenue potential and were willing to pay an inflated value of multiple for the story of growth.
As we enter 2023, the P/S Ratio is now standard fair for analysts covering high-growth sectors, especially tech, biotech, and consumer internet companies. It has also become increasingly important for global markets where companies in emerging economic, often larger companies do not prioritize near-term profitability but disdain for market share and revenue generation.
Advantages and Limitations of P/S Ratio
The P/S ratio has its pros and cons, like any tool. Let's begin with its strengths.
The greatest strength of the P/S ratio is its simplicity. Revenue is revenue. Revenue appears at the top of the income statement and is harder to manipulate, than net income. Because earnings could be manipulated either through depreciation choices, tax strategies, or one-time charges, revenue is a cleaner metric to compare.
Another strength of the P/S ratio is that it will work when the P/E ratio may not work. If a company has negative earnings or very volatile positive earnings, you cannot use P/E. If a company has sales, you can potentially always use P/S. Thus it is a useful tool for startups, companies in turnaround, and any company that reinvests everything back into the business and doesn't have positive earnings.
Here are its drawbacks.
The P/S Ratio disregards profitability entirely. Two companies might have the same P/S Ratios, but one may have fat margins and strong profits, while the other may lose money on each sale. Consider two candy shops. The first shop keeps costs low and earns a profit of $0.50 on each $1 of sales. The second shop uses expensive ingredients and only earns a mere $0.05 per dollar. To compare the two shops, you would only look at sales, and they would look the same; however, you would obviously rather own the first shop.
Different business models create the same issue. It would not be fair to use P/S to compare a software company with 80% gross margins to a retail chain with 20% margins. The software company, keeping most of what it earns, might deserve a P/S Ratio of 10. However, a 10x P/S for the retailer would be absurd.
Amazon perfectly illustrates the importance of context. For years, it generated tons of revenue but had tiny margins because Jeff Bezos was reinvesting everything into growth. The high P/S Ratio made sense because investors understood that once Jeff Bezos flipped the switch on profit, the earnings would be huge. Compare Amazon to a traditional retailer with the same revenue that had no plan to improve profit margins, and a high P/S Ratio would mean the retailer was overvalued.
The point? The P/S Ratio is a great place to start, but not the place to end. P/S Ratio means nothing without a picture of profit margins, cash flow models, and the industry background.
How to Use P/S Ratio in Investment Analysis
So, how do you actually utilize these metrics when evaluating stocks? Here’s a practical approach.
Begin by determining what the industry average P/S Ratio is. If you are researching Salesforce, for example, you would check to see what Oracle, Adobe, and Microsoft, are trading at. If Salesforce's P/S Ratio was significantly higher than its peer companies, you would then ask yourself why? Are they growing faster? Are their margins better? Or are they simply overvalued?
Next, evaluate the company's revenue trend. Is it consistently rising, or is it sporadic? A high P/S Ratio is more justifiable for a company growing revenue by 30% year-over-year versus one that is growing at 5%. The trending pattern of revenue needs to be evaluated as well. Recurring revenue (subscriptions) will be more valuable than one-time revenue (dating, consulting), -even if it all adds up. In other words, a software-as-a-service company could warrant a higher P/S Ratio than a company that relies on one-time revenues such as a consulting firm that only works with clients on project basis.
Be careful not to use the P/S Ratio on its own. It should be used in conjunction with other metrics, such as the P/E Ratio (when available), the price-to-book ratio, and/or the EBITDA multiples. If a company had a low P/S Ratio, but also had terrible margins or a declining market share, it would raise red flags. It would not be a bargain, it means it will probably continue to lose value.
For instance, suppose you have two lemonade stands. Stand A has annual sales of $1,000 and a seller wants to sell it for $2,000 (P/S of 2). Stand B has annual sales of $1,000 and a seller wants $3,000 for it (P/S of 3). At first glance, Stand A appears to be cheaper. However, if sales at Stand A have been stagnant for the last three years, but Stand B just opened and is doubling sales each year, the higher P/S Ratio for Stand B becomes more appealing, because you are paying for future growth using the P/S ratio.
To use a more professional example, think about how you would analyze Salesforce prior to investing in it. You would pull up the P/S ratio and compare it to Salesforce's competitors in the CRM space, to see if there is justification for a premium for Salesforce based on revenue growth. You would also look at gross margins to be sure that the company can eventually turn that revenue into profitability. You would also look at customer retention, since losing customers prevents building future revenue. If you considered all of this, you would feel comfortable knowing if the P/S ratio was good value or a warning sign.
Industry and Market Differences in P/S Ratio
One of the most frequent errors made by investors is comparing P/S Ratios across various industries without recognizing structural differences. A tech stock with a P/S Ratio of 5 may not be expensive, but a utility company with the same Ratio likely is.
Why? The business models and margin structures are different. Software companies scale without pales of incremental costs, so for every dollar in revenue, they make a ton of profit. Manufacturing companies have to build factories, purchase raw materials, and hire laborers for every unit they sell. Retailers operate on thin margins with substantial inventory costs. As a result, a "good" P/S Ratio in one industry does not equal the same on another.
Let's consider some proximity trip necessary figures. Tech companies, especially those that make software for service businesses, are more common to see P/S Ratios between 5-15; Consumer internet companies fall in a 3-10 range, while traditional retailers are below a 1, sometimes down so low as .3 to .5. Utility companies are many times at an under 2 ratio, manufacturers may see in a .5 to 2 range, depending upon the stock and driver of the value.
Take for example, Amazon compared to a utility company like Duke Energy. Amazon's price/sales ratio has typically been a 2 to 4 range, which might seem low for a technology company, but it makes sense since the company is a retailer and has lower margins. Duke considers itself to be trading in the range of 1 to 2. At first glance, it appears to be cheaper than Amazon. However, utility companies have regulated returns, slow growth, and are capital intensive operations. While utility companies think about financing returns, Amazon's price/sales ration is higher because of its potential for growth and improved margins as its cloud business (AWS) is more fully developed.
Additionally, two companies can have a low price/sales ratio for different reasons. Market conditions will impact price/sales ratios across-the-board. In bull markets and periods of easy money, investors become more optimistic and the price/sales ratio tends to inflate across all sectors. Conversely, in bear markets or rising interest rate environments, the price/sales ratio compresses. A better way to think about a price/sales ratio, or even any ratio, is to compare the current company's price/sales ratio against its historical range or peer group, rather than an absolutist level.
If you will invest in global companies, you will also notice price/sales ratios are country-specific. Emerging market stocks tend to trade in lower multiples than developed market countermates even within under the same industry given perceived risk around governance, currency, or regulatory environments.
P/S Ratio vs Other Valuation Metrics
Although the P/S Ratio provides a lot of insight, it does not stand alone. What’s great about the P/S ratio is that you can evaluate its usefulness compared to other metrics, allowing you to form a more complete picture of valuations.
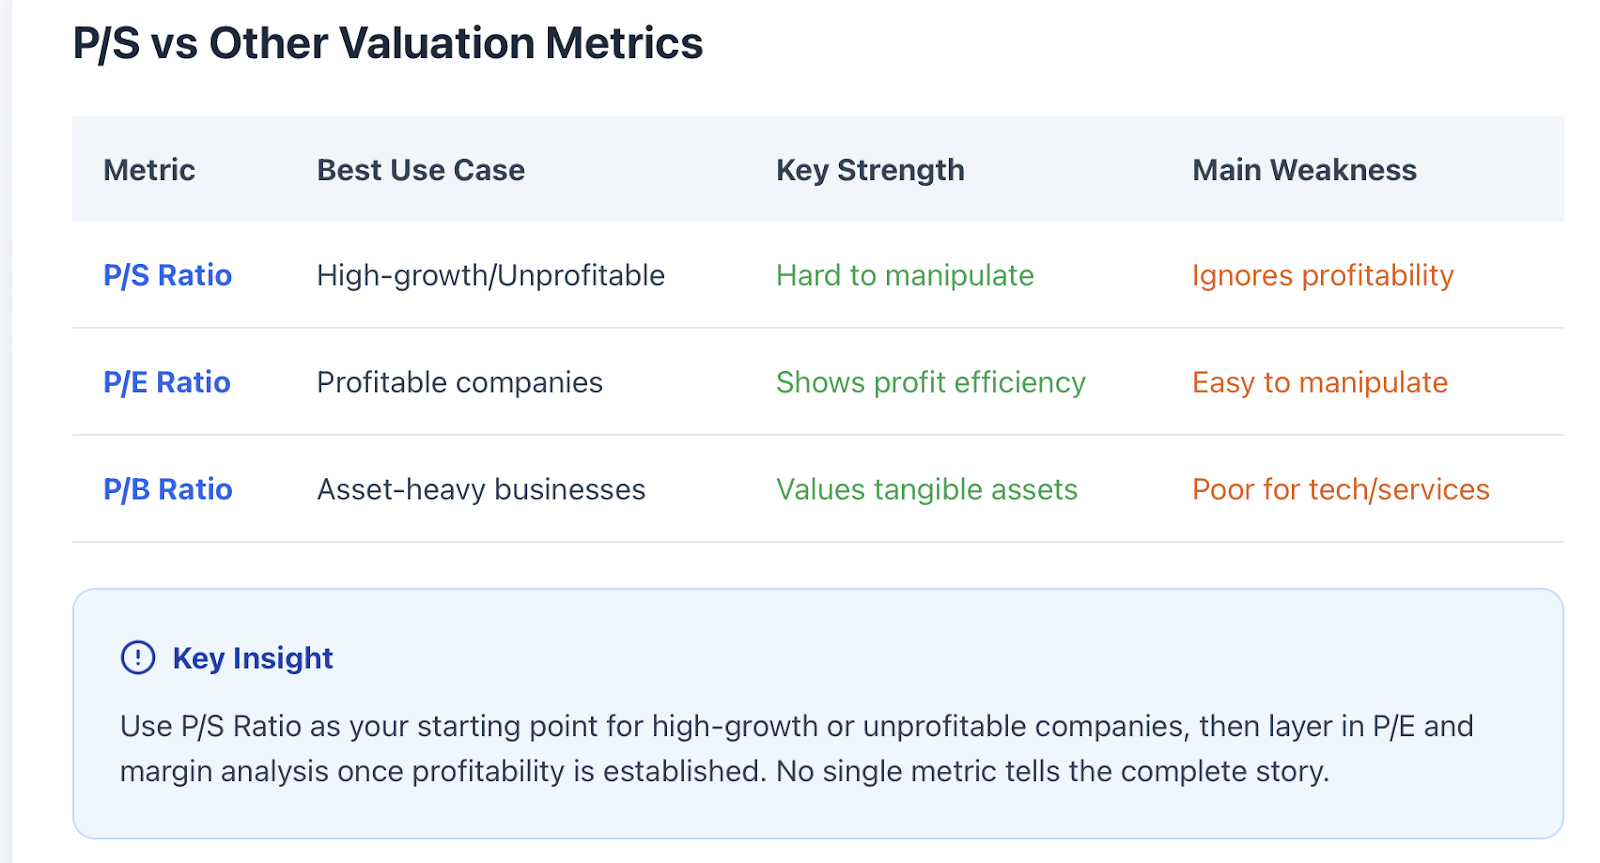
The P/E ratio (price-to-earnings) is likely the most popular and well-known valuation metric. While the P/S ratio is based on revenue, the P/E ratio is based on profit. The good thing about the P/E ratio is that it represents what investors are actually paying for earnings that drive shareholder value. On the downside, the P/E ratio won't work for all unprofitable companies and can be skewed by accounting decisions. If a company does not have earnings or you want to analyze a company's top-line growth story, the P/S ratio is a great option. If the company’s business is established profitability and growth is sustainable, only then will the P/E ratio be relevant.
The P/B ratio (price-to-book) compares the market value to the accounting book value or the worth of the company’s assets “on paper.” This is a good valuation metric for banks and real estate companies, both of which are examples of asset-based businesses. P/B is less so in cases that are significantly less asset-oriented—for example, tech or service-related companies where value comes from intellectual property, brands, or networks versus assets. P/S is arguably more useful for some of these asset-light businesses.
As an illustration, think about comparing a pair of lemonade stands. Stand A has high revenue, but very low profit because the owner pays himself a large salary. Stand B has limited revenue, but very high profit because it is run efficiently. Stand A has a favorable P/S Ratio given the revenue, which would misleadingly suggest that it is a better deal. But the P/E ratio would highlight Stand B's better success with profits. You would need both metrics to demonstrate why Stand B is a better investment if those margins are reliable.
For an example of this, think about Tesla and Shopify. Tesla has enormous revenue but capital-intensive operations, while Shopfiy has lower absolute revenue but a much higher margin because of the software it is able to provide. Using the two businesses to compare solely on the P/S would be misleading for the investor. You would also want to observe the P/E (when they are making money), their gross margins, and free cash flow, and growth rates to assess how each represents more or less value according to each business model.
The best investors will use multiple metrics like pieces of a puzzle. A low P/S Ratio with a low P/E and reasonable P/B, with revenue that is growing quickly, and with margins you can trust is worth much more than any one number could ever compare.
FAQ: Price-to-Sales Ratio for Beginners
Which business types is the P/S Ratio appropriate for?
The P/S Ratio works best with high-growth companies, unprofitable companies, and low-margin or very volatile companies. The P/S Ratio is likely applicable in the tech space and in the biotech space, consumer internet and other areas where companies spend aggressively to grow revenue versus maximize short-term profits.
Does a high P/S ratio indicate overvaluation?
Not necessarily; a high P/S Ratio can be justified when a company is growing revenue quickly, has ample margin, or operates in a high-growth industry. In other words, focus on the context over the specific number.
How does the P/S Ratio relate to profit?
The P/S ratio is not a measure of profit. A company can have a lot of revenue while having awful margins, which explains why it is important to also analyze profit margins and profitability more broadly in conjunction with P/S.
How do I think about combining P/S with other ratios or measures?
The framework starts with the P/S which tells us how the business is valued versus sales. From there, we consider and layer on the P/E ratio (to understand profit); profitability metrics or measures which often include margins of some sort measure efficiency; and growth rates to think about future potential.
What is a good way to evaluate P/S Ratio investment opportunities in global markets?
Start off by comparing companies within the same industry and region, before accounting for growth rates and model distinctions. A company may look pricey in one market, but be attractive in compared to others, reflecting the growth rate associated with segment or risk profile.
Understanding P/S Ratio for Smarter Trading
The Price-to-Sales Ratio is one of the most portable and lightweight tools in your investing toolkit when it comes to examining important growth stocks or firms with no profitability yet. It helps you sift through a lot of accounting noise, and puts real clarity around how much value investors are paying for a dollar of revenue.
Like any tool though, it is most effective if implemented well. Don't compare P/S Ratios to companies that are in very distinct industries. Don't just ignore profitability or margins. Lastly, make sure it is not the only stat you are comparing your investment thesis. Considering P/S Ratios along with debt-to-equity ratios or cash flow analysis or competitive analysis or qualitative analysis, can provide a thorough leg to your investment thesis.
What products or services appear as a cheaper P/S company today, could do extremely well tomorrow if they are in the right industry and have adequate fundamentals. Conversely, maybe there is a reason that they have a lower P/S which may be signaling real reasons for decline in revenues or margins in the future.
Before you make your next trade, take a few minutes to calculate the P/S Ratio. Compare it to industry peers. Check if the company's growth trajectory justifies the valuation. This simple exercise can save you from overpaying for hype stocks or help you spot undervalued gems that others are missing.
Ready to put your P/S Ratio knowledge into action? Start practicing with Tradewill's demo trading platform where you can test valuation strategies risk-free and access real-time market data to sharpen your analysis skills before committing real capital.
Disclaimer: The content of the blog does not represent any position of Trade W, does not serve as any trading-related decision advice, and does not endorse any third-party.