

 Trade W
Introduction: Why Quant Trading is Reshaping Global Markets
The financial industry is going through significant changes. In the past, quantitative trading was available only to large hedge funds and major financial institutions. Today, anyone with an internet connection can use these technologies for their trading activities. Using algorithmic methods, traders are able to achieve returns that were impossible with traditional trading techniques.
The Medallion Fund from Renaissance Technologies had not lost money for its clients since 1990. In fact, Jane Street places more than $17 billion a day worth of trades. These examples show us that data-driven trading and automated systems are becoming a trend for many markets, and, therefore, represent the way that the world is currently trading. Many retail traders have started to join in on this trend, and even if all you have is a basic understanding of how to interpret moving averages, you can potentially make money trading using these simple algorithms.
This master course is designed to give you an overview of all aspects of quantitative trading, including tested strategies, technical infrastructure, risk management processes, the ability to generate profits in the real world, and future trends in AI-driven quantitative trading systems.
Whether you are working with millions of dollars or just experimenting with demo accounts, you will have to have a solid understanding of quantitative trading to be successful in the financial markets.
What is Quant Trading? Understanding the Principles Behind Algorithmic Strategies
Quantitative trading is the process of automatically making trading decisions based on quantitative (maths) models and algorithms. Quants do not use their gut feeling or emotions when making decisions but rather build systems to study the data, identify trends, and place trades quicker than any human being.
The elements of quant trading are very simple. Data feeds the models; algorithms analyse the data feeds in real-time. Automation allows for trade execution without hesitation. The mathematics associated with quant trading includes the following: moving averages, regression analysis, volatility calculations, etc. This transforms market noise into signals to act on.
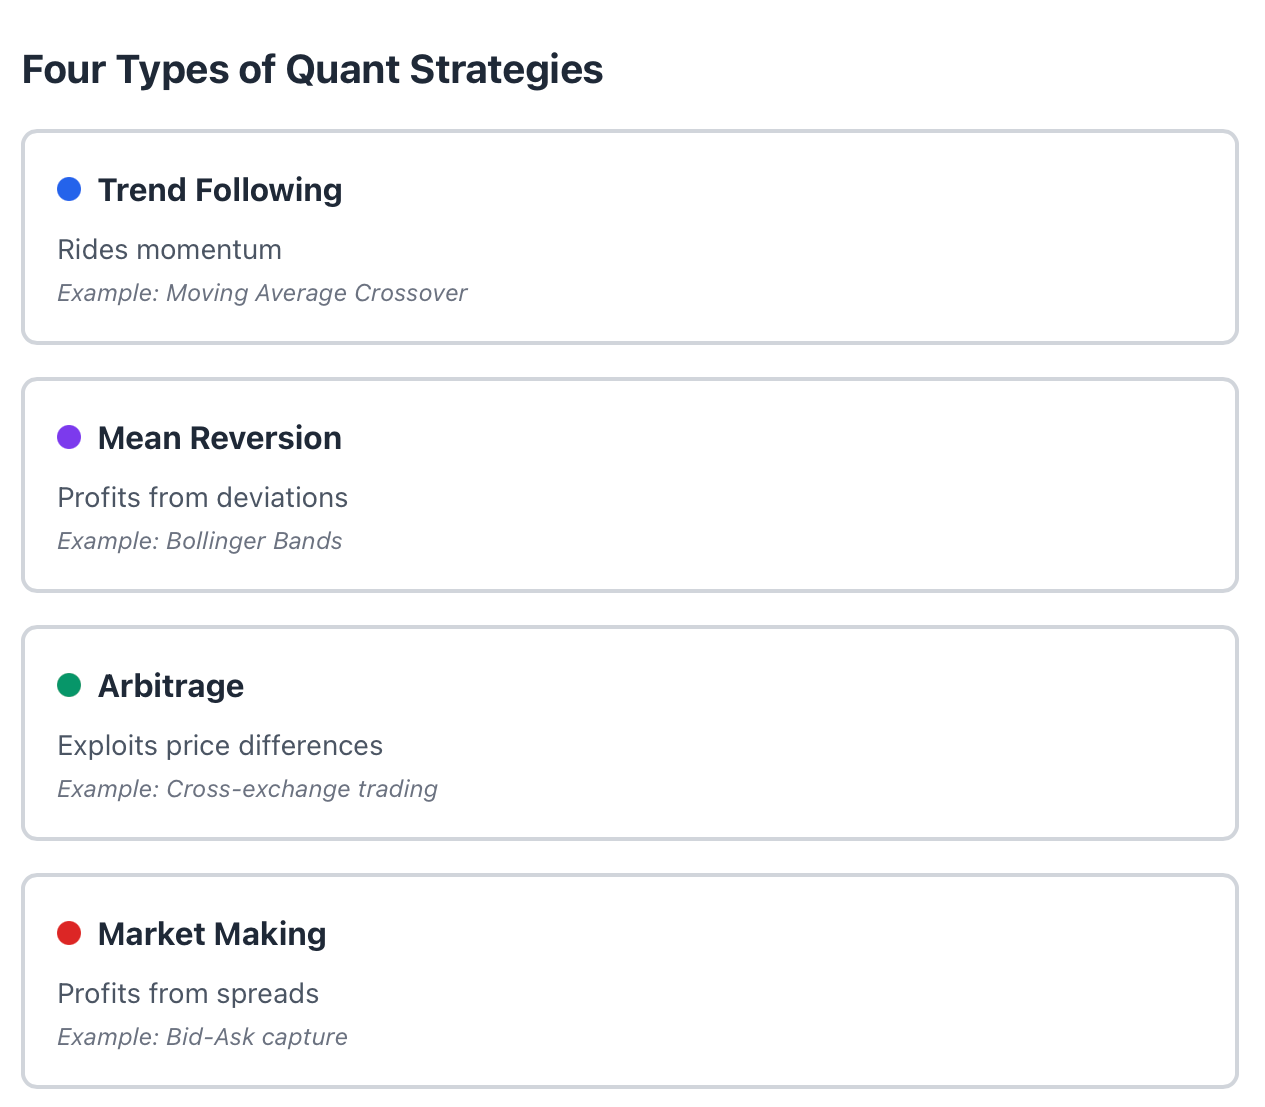
There are four types of strategies in quant trading. Trend-following algorithms utilize momentum by buying what is strong and selling what is weak. Mean Reversion Strategies capitalize on temporary deviations from the mean by assuming that the market price will revert back to the average. Arbitrage Strategies(ie: The Arbitrageur) buy low in one market and sell high in another Market. Market-making Strategies are employed to generate profit from the spread between the bid and the ask by supplying liquidity in the market.
In quant trading, revenues are generated from a number of avenues. The majority of quant traders find revenue from capturing the spread, reducing slippage, optimising execution fees, and scaling strategies across different markets. Two Sigma Capital management is one of the largest quant trading firms, with over $60 billion in assets under management. Quant traders do not require billions of dollars to set up a simple Moving Average Crossover Strategy for Stock Trading; a minor initial investment will suffice in order to gain the knowledge about the fundamentals of Quant Trading.
The most attractive part of quantitative trading is its objectivity. The emotions of traders do not affect their decision-making. Back testing an algorithm shows you how well the algorithm performs prior to risking any capital and Algorithms execute trades with 100% accuracy and convert statistical opportunity into financial opportunity.
Deep Dive into Quant Strategies: From Trend Following to Market Making
Strategies based on trend following
They're designed to spot directional moves and ride them until signals reverse. The most basic way to do that is with dual moving averages: When the fast moving average crosses above the slow moving average, buy; when the fast moving average crosses below the slow moving average, sell. This method works well in trending markets like forex, including currency pairs and cryptocurrencies during bullish runs.
Strategies based on mean reversion
With this strategy, traders profit from price deviations from a price average. If a price is 2% above the moving average, for example, the trader believes it will revert back down to the average. Bollinger Bands are great indicators for this strategy. A price touching the upper band means it's overbought (thus a sell signal), and a price touching the lower band means it's oversold (thus a buy signal). This strategy works well in range-bound markets.
Strategies based on arbitrage
With arbitrage, you take advantage of price discrepancies across exchanges. For example, if bitcoin trades at $45,000 on Binance and $45,100 on Coinbase, you could buy on Binance and sell on Coinbase, making a profit of $100 for each coin. Cross-asset arbitrage can also be a successful trading strategy, as traders can find mispriced relationships between highly correlated instruments (such as EUR/USD and GBP/USD).
Strategies Based on Market Making
Market makers post both a buy and sell price and profit from the difference, the bid/ask spread. For example, if you quote the price of a bitcoin at $44,990 (bid) and $45,010 (ask), the bid/ask spread captures $20 profit per trade cycle. High-frequency trading firms like Citadel Securities make hundreds of thousands of these micro-profits each day on the bid/ask spread.
Combining Strategies to Adapt to Market Regime Changes
Because of how quickly market structure can change, Trade Managers (TM) often view Single strategy usage as inefficient. As such, TM's will take many combinations and use them simultaneously in different markets; Trend- Following in Volatile Markets and Mean Reversion when the market is in a Consolidation pattern. Multi-Factor Models combine Technical Analysis Indicators (TAI's) and Fundamental Data into one model. Tuning Parameters through Backtesting finds the Optimal Parameters for all markets.
Performance Evaluating
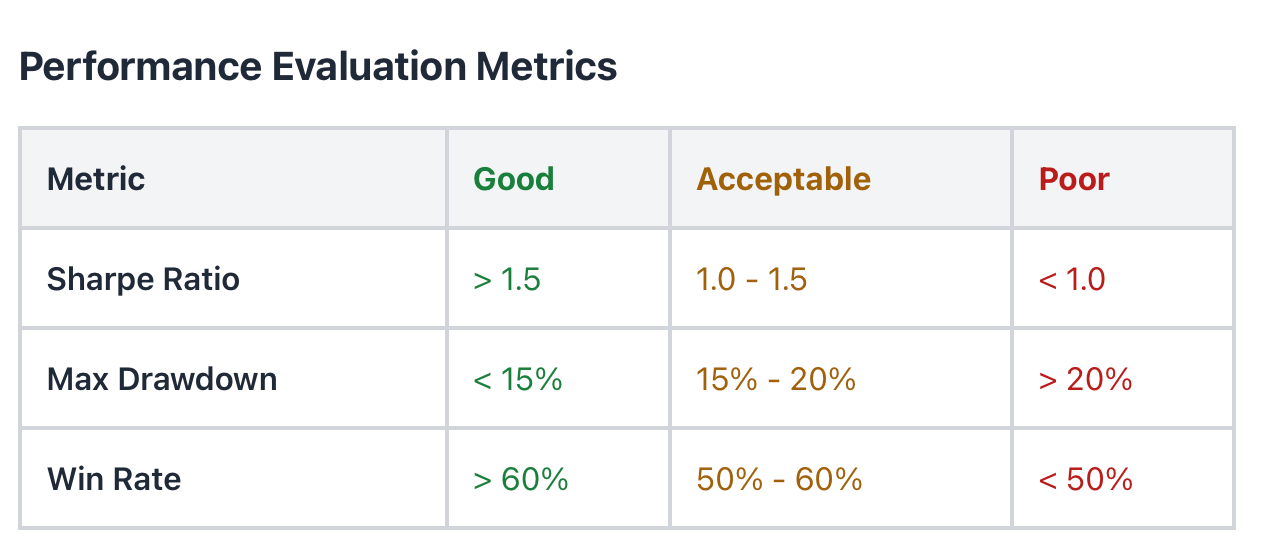
The Sharpe Ratio can be used to evaluate Risk Adjusted Returns; Above a Value of 1.5 indicates Solid Performance. The Maximum Drawdown gives the Worst Value that a trader has experienced while still maintaining a Positive equity curve (Keep Drawdowns less than 20%). The Win/Loss Ratio also shows how "Consistently" A trader is Winning or Losing (i.e. If a winning percentage of 60%+ can be maintained, then Risk/Reward will yield a Profitable Trading System).
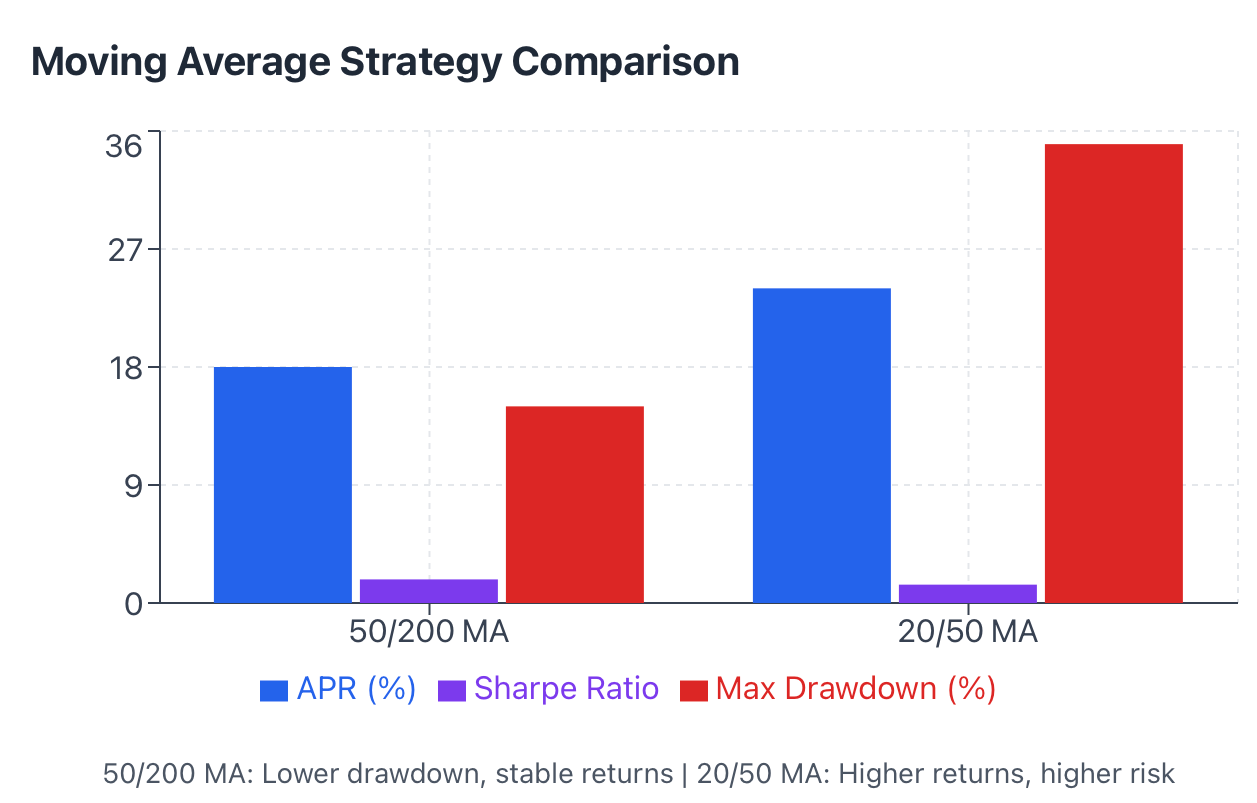
An Example of Two Different Moving Averages (MA) on the EUR/USD Currency Pair
There is evidence that Parameter Selection is Important by Comparing the Results from Two Different MA Crossovers (The 50/200 MA Crossover produced an Average Annual Percentage Return (APR) of 18% with a Sharpe Ratio of 1.8) The 20/50MA Crossover yielded a 24% APR with a Maximum Drawdown of 35%.
Understanding the Logic Behind Each Strategy and Market Conditions Develops the Ability to Adapt; However, The Ability to Adapt is What Separates a Consistent Profit Maker versus a one-hit wonder.
Data & Feature Engineering: Turning Market Data into Profitable Signals
Without being properly processed, raw market data are very hard to make sense of. Quantitative traders who are able to take raw market inputs and convert them into signals that can be traded, have created successful processes that consistently use feature engineering to cleanse and provide tradeable signals from messy and raw input data sources.
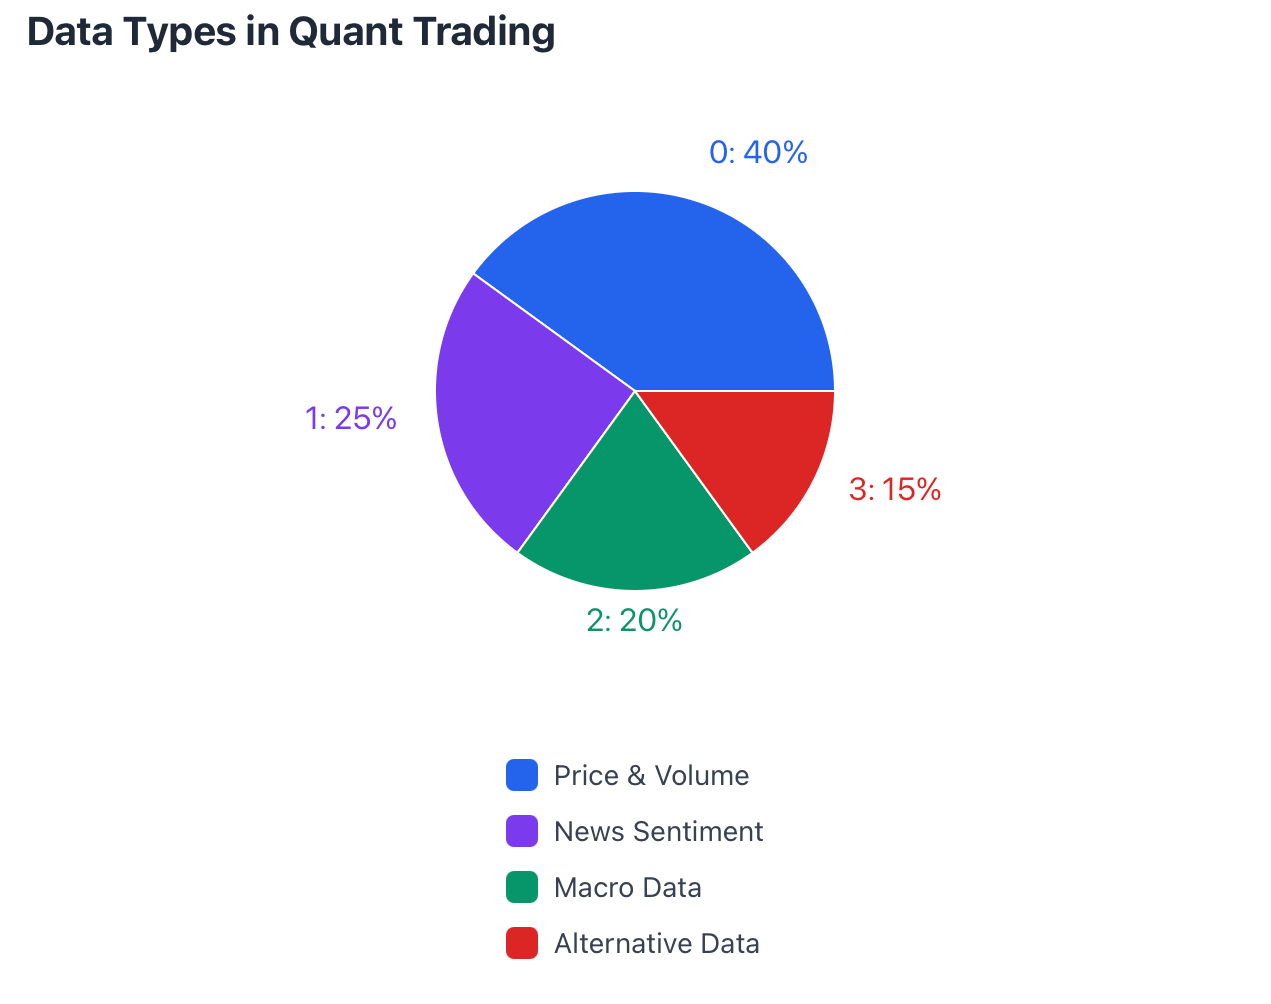
Types of Data
While price and volume are essential building blocks, sophisticated trading strategies are also built on news sentiment (headline news is positive news for buying), macroeconomic numbers (GDP growth has an effect on the direction of currency pairs), and alternative sources of data such as satellite imagery monitoring retail traffic.
Cleaning Data
Cleanliness of real-life market data is heavily lacking. Data sets that have missing data points require either imputation or removal of missing points. Outliers such as flash crashes or fat-finger trades require that traders filter them out. Normalization allows traders to compare different types of assets. For example, comparing Bitcoin to Apple stock on a raw price comparison is not a true representation as the price of Bitcoin is considerably more than that of Apple stock. A better way is to use percent changes.
Feature Engineering
The transformation of raw data into something that has true meaning occurs during feature engineering. Closing prices become RSI, MACD, ATR and other custom indicators that provide a trader with vital information on a price's actual movement. Institutionally purchased volume patterns can reveal the accumulation of a specific asset. Time-based features are useful during different times of the week and different sessions due to different volatility. There are libraries for Python, such as Pandas and TA-Lib, that allow for the implementation of most of the calculations related to feature engineering.
Sources of Data
When trading, most institutions are able to access either Bloomberg or Reuters, while the majority of CryptoTraders rely upon APIs provided by CoinGecko, Binance, or Kaiko to collect their information; however there are also free options to use, such as Yahoo Finance - but being able to trust the information from any source is critical. A single incorrect data point can severely impact a back-testing.
Professional setups may produce trading signals based on over 50 different engineered features, including but not limited to: trend analysis, price momentum, volume trends and shifts in correlation with other markets; however there are simpler ways for new traders to get started by creating an Excel spreadsheet and calculating a basic moving average or 14-period RSI indicator for basic trading strategies.
Ultimately, the performance capabilities of any strategy are highly dependent on the quality of the data being used to create it. If you rely upon poor quality data to develop your strategy, you will find that it produces poor results as well. Therefore, it is essential to spend time and effort creating a strong data pipeline using high-quality data prior to investing time or resources into developing complex algorithms.
Technical Implementation: Building a High-Performance Quant Trading System
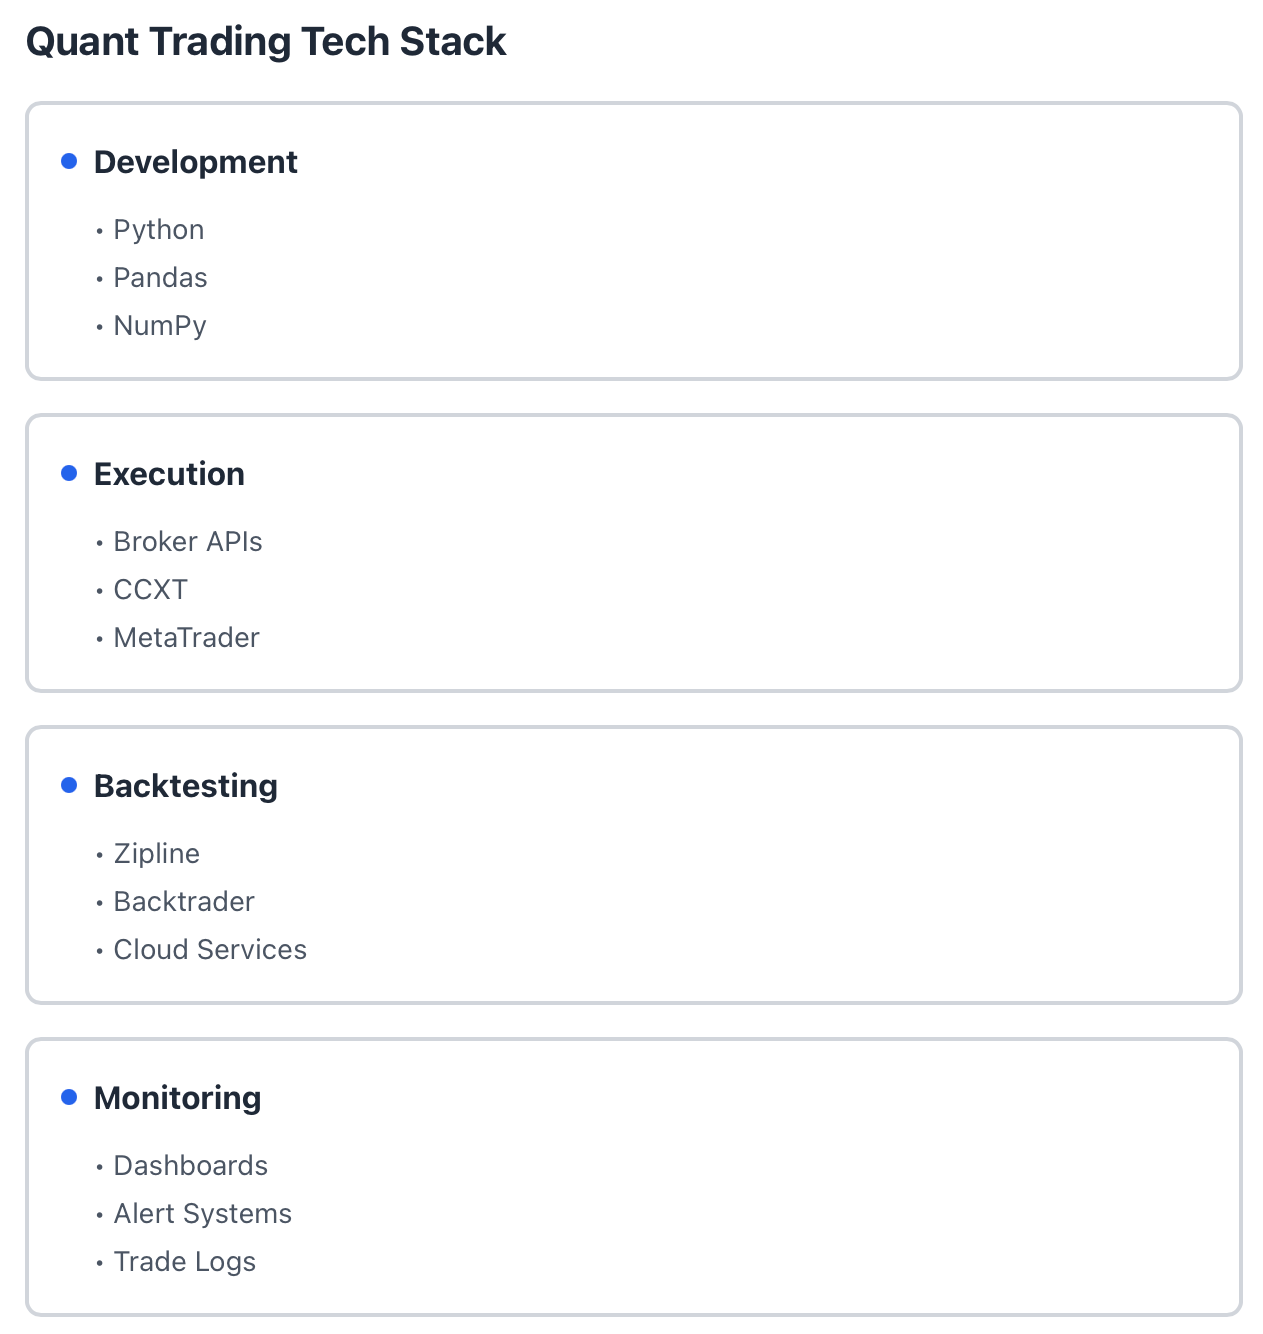
Successful businesses have the best technology-stack, which is what separates successful businesses from failed businesses.
Programming Languages:
Python is king for strategy development, with libraries like Pandas, NumPy, and Backtrader providing the tools necessary for data analysis and backtesting. C++ is used to power ultra-low-latency executions by HFT companies. R is best used for statistical analysis. Java provides enterprise-grade stability.
Trading Execution:
Broker APIs connect trading algorithms to various markets. MetaTrader's Python integration is a good option for the Forex market. The CCXT library is a useful tool for connecting to almost all cryptocurrency exchanges. Interactive Brokers provides a single API for accessing both stock and options markets. Although milliseconds don't seem like much time, they quickly add up in high-frequency trading. Connecting your server to a colocated server in the same data centre as the exchange reduces latency by microseconds.
Backtesting & Simulation:
Cloud services, such as AWS or Google Cloud, make it possible to conduct enormous amounts of testing. Both AWS and Google Cloud allow you to test 10,000 combinations of parameters overnight. Frameworks like Zipline and Backtrader run your simulations on realistic trading conditions, including slippage, commissions, and market impact.
Automation & Monitoring:
Live strategies require constant monitoring. Therefore, you need to use a dashboard-type tool to view key performance indicators (KPIs) in real-time, such as current P&L, position size, and overall strategy health. Additionally, you will need an alert system to notify you if you experience drawdowns beyond a certain threshold. To facilitate post-analysis, you need to log every trade made during strategy execution.
Professional HFT firms spend millions of dollars on their infrastructure, including dedicated fibre-optic lines, FPGA chips that execute trades in nanoseconds, and hiring teams of engineers to operate their trading systems. Retail traders can start with a simple Python script on a $5/month virtual server and use free APIs and open-source tools.
The use of technical capabilities is essential; therefore, no trader can be successful if they dont have service available during market strife and client activity peaks or API interactions that fail when trading volatility becomes extremely high.
Risk/Money Management: Preserving Capital At All Costs For Quantitative Trading
All quantitative strategies are subject to failure, as evidenced by the occasional negative P/L months experienced by Renaissance Technologies, showing how risk management makes the difference between surviving traders that have blown out their accounts.
Dynamic Stop Loss:
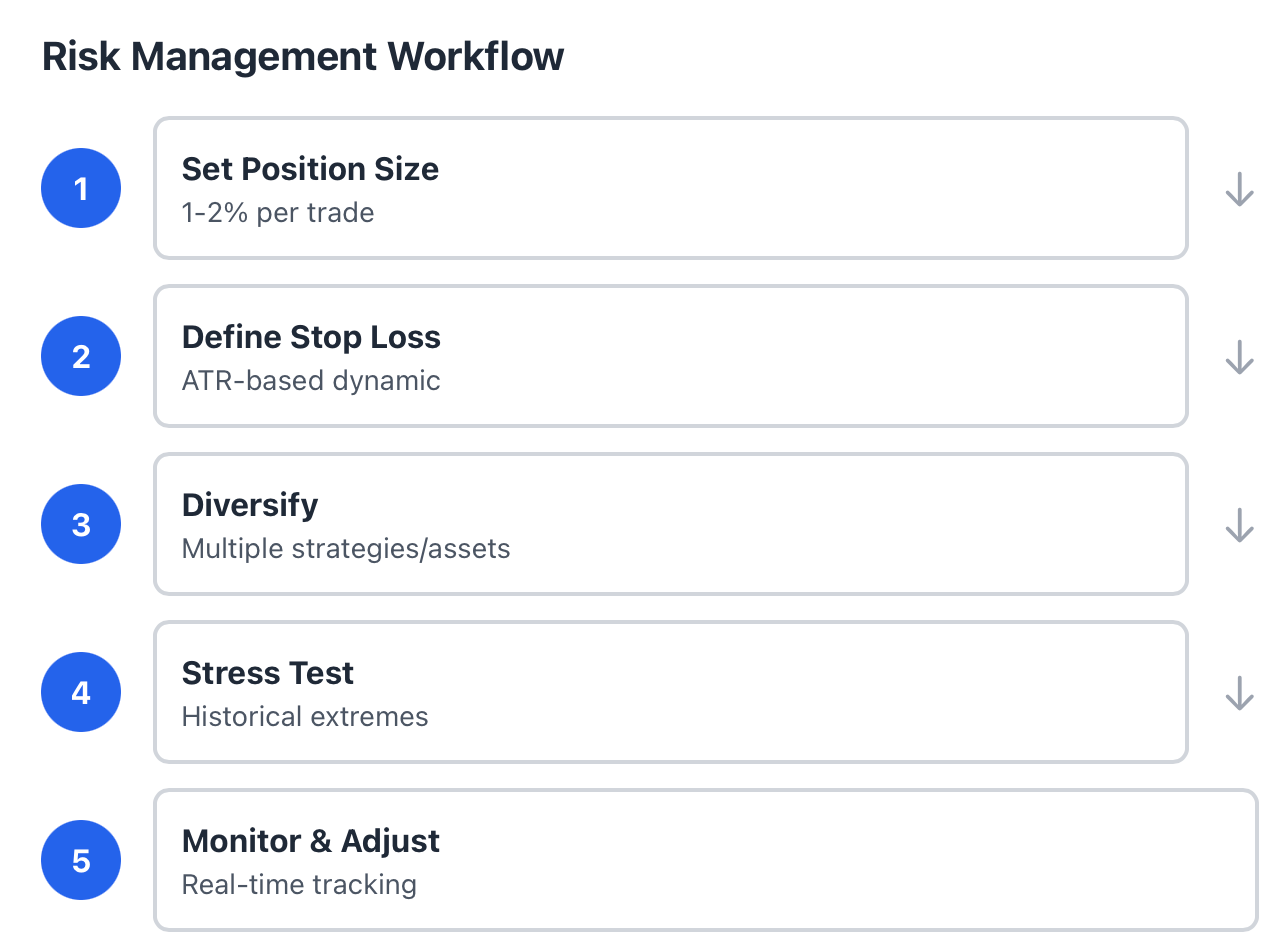
Stop-loss orders set at specific prices provided limited success due to the constantly shifting nature of volatility, but use of a trailing stop allows locking in profits from a strong trend, while the use of an Average True Range (ATR) based stop can adjust for short-term or long-term volatility and set much larger stops during significant periods of market volatility and tighter when the market becomes quiet.
Position Sizing
To calculate optimal position size based upon your edge and odds, we recommend using the Kelly Criterion. We use fixed fractional methods of defining trading limits on every trade between 1-2% of capital. By spreading risk between uncorrelated quant strategies and different asset classes, no trader should ever have more than one account or one quant strategy using all available capital in their trading strategy.
Utilizing Extreme Tests To Verify System Performance
All systems must be stressed tested through all major economic events, including the 2008 financial crisis, the Covid-19 Virus in early 2020, and any other significant event causing large market swings and movements. If your system has demonstrated resilience in the extreme markets of yesterday, your system is likely to withstand future catastrophes as well. Testing through scenario analysis will provide insight into your system's performance during extreme conditions.
During the 2010 Flash Crash, High-Frequency Trading (HFT) companies that had no risk management strategy were destroyed when algorithms reacted to each other and ramped up the selling momentum in minutes, leaving overly leveraged traders with nothing. However, trading companies that had implemented circuit breakers and position limits were able to survive this event.
Simulated accounts offer an insight into how psychologically damaging it is to have a 10% loss in a short period. The experience of forced liquidation is also available through simulations that do not require any monetary investment to learn the best ways to protect your capital.
Quantitative analysis is different from gambling. Quantitative analysis takes into account a risk-reward ratio based on mathematical probabilities and enforces strict risk management procedures.
Revenue Models & Profitability: How Quant Firms Make Money
To determine if quant trading suits your objectives, it is essential to understand a quant trader's business model.
Fees
The traditional hedge fund fee structure is "2 and 20," which means a 2% annual management fee plus 20% of all profits (after taking out the manager's share). Renaissance's Medallion Fund charges more than that, but its record of average annual returns at 66% justifies the higher fee. Retail traders keep all of the profits that they have made, but they do pay for broker commissions and other fees associated with their trading platform.
Sustainable Strategies
Every trading edge will eventually diminish. As additional traders start using that strategy, profits will continue to decline. The amount of capital a trader can utilize before pricing changes is limited by the capacity of the markets. A trader's competitive edge will disappear unless the trader continues to innovate. Most firms put a significant amount of money into research in order to remain competitive.
Cost Structure
A quant firm with the best technology, access to data, and the best talent can spend millions of dollars per year. To date, Two Sigma has hired thousands of engineers and data scientists. A retail trader will have significantly less cost associated with technology, data, and education. The total cost of software and data subscription fees as well as learning resources will be in the low thousands of dollars per year for a retail trader.
Profitability and Margin
The top quant hedge funds produce annual returns between 15% and 40% on a regular basis. Citadel's multi-strategy approach to trading generates billions of dollars in annual profits. Retail traders making 8% to 15% annually outperform the vast majority of traditional investors. Profit depends on how well you understand strategy, execution efficiency, and disciplined risk management.
Generating revenue relies on strategy and data quality. Back-testing on strategies can create a false sense of security when performed poorly. Buying and selling through multiple exchanges and market makers can result in profit loss due to slippage. Taking risks in an undisciplined manner can lead to disastrous results.
Retail quantitative (quant) traders primarily fail at the beginning. The journey to success for a successful retail quant trader is generally one that takes many years, a considerable amount of money, and a plethora of mistakes. However, for those that do not give up and continue to learn and adapt from prior errors, developing a long term revenue stream is possible.
Global Cases: Real Life Quant Trading Success:
Renaissance Technologies
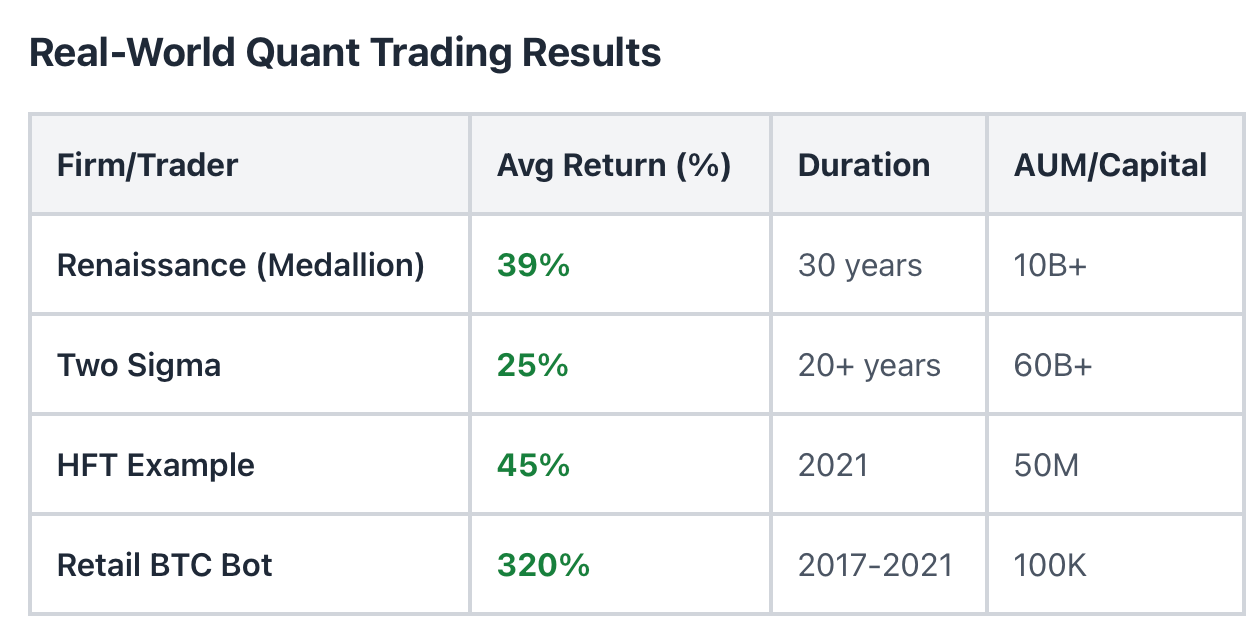
Jim Simons's Medallion Fund has an average annual return of 39% for 30 years and is the gold standard for quant trading success. Their approach is totally mathematical; they do not incorporate any fundamental analysis in their models. They employ hundreds of Ph.D. level people to analyze the data around the clock. This is proof that when a systematic approach is executed perfectly, it is extremely successful.
Two Sigma
Two Sigma manages over $60 Billion using Machine Learning and large amounts of Data. Their models analyze everything including satellite images and the weather. They trade across multiple assets, multiple strategies, and are diversified on a global scale. Their technology has the structure of institutional quality but can be used by retail traders.
High Frequency Trading Example
A mid-sized high frequency trading company executed a market making strategy using several exchanges across the cryptocurrency market, resulting in an average of $2.5 million per month on the spreads in 2021. The average holding time for trades was 3 seconds, with a trade success rate of 58%. The key to their success was speed, not prediction.
Automated Trading BTC/USD
A trend following algorithm trading on Bitcoin from 2017 to 2021 was able to grow a $100,000 account to $420,000. The approach was simple, buying when the 20-day moving average crossed above the 50-day moving average and selling when the trend reversed. This algorithm stopped trading during the 2018 bear market and participated fully in the 2020-2021 bull market. A simple solution can often be an effective solution.
Simulation of Student Arbitrage
Simulated arbitrage on crypto-assets by college student traders, in a triangular manner (using BTC, ETH, and USDT), resulted in a 12% return over three months of practice, using no real capital. What they learned about the execution speed and fees for trades helped prepare them for the realities of the actual trading environment.
These examples range from very large institutions to small student organizations. However, the key to all of these is that they were developed using thorough and systematic methods of development, utilizing an extensive testing process, along with abiding by strict execution.
The Future of Quantitative Trading Tactics
The introduction of AI and machine learning
Neural networks are now used to predict price movements by discovering patterns that humans could not identify. The development of Reinforcement Learning uses millions of simulated trading environments over time to train algorithms to make the best decisions possible without any assistance from humans. Sentiment analysis refers to the processing of news articles, social media posts, and earnings reports at lightning speeds.
The use of Natural Language Processing (NLP)
NLP algorithms scan the Federal Reserve press announcements, corporate filings, and analyst reports in order to obtain tradable signals before the human trader has completed the first paragraph. Trade execution based on news will happen within seconds of the news being broadcast.
Developing multi-market, multi-asset systems will involve simultaneous trading of Stocks, Crypto, Forex, Commodities based on correlation discovered by the algorithms.
Five years ago, to operate a quant trading business required $10 million worth of physical infrastructure; Today, you can run the same business off a laptop. Online courses now make understanding PhD level mathematics a reality for everyone. Additionally, there are still substantial differences between institutional and retail trading, however retail traders now have access to technological advances that were not available 10 years ago.
The future of quantitative trading will be driven by the evolution of technology and access to alternative sources of data. The people who adapt to utilizing these advancements will succeed in the market while those who continue to rely on traditional methods will face challenges.
Conclusion & Actionable Steps: Start Your Quant Trading Journey
Quantitative trading requires sound mathematical analysis, advanced technology - both of which are supported by disciplined risk management - to be effective. You can be successful with any of the quant strategies (i.e., trend-following, mean reversion, arbitrage or market-making) when you perform them correctly, using technology to develop and test your own strategies.
]Additionally, using robust risk parameters to limit your maximum drawdown will protect your capital from the inevitable large losses associated with quant strategies. Moving forward to build your career in quant trading will require finding a proper balance between theory and practice; you should study mathematics, learn how to write code, backtest constantly, begin with paper trading an amount that you are willing to lose, track your performance on every trade, and learn from your mistakes.
Many of the top-performing hedge funds have demonstrated that a systematic approach can produce consistent returns when deployed at scale and the evidence from multiple student simulations demonstrates that these same concepts can be taught and learned; continued, regular, and disciplined practice will help close the gap between theory and actual earnings.
Because the financial markets are constantly evolving, edges in quant strategies will diminish, competition will increase, but disciplined traders who continue to develop new ideas, develop new testing strategies, and develop disciplined risk management processes will be the ones able to create long-term sustainable careers in trading using quantitative approaches.
Ready to transform your trading with algorithmic precision? Start your quant trading journey with TradeWill.com today. Access cutting-edge tools, real-time market data, and strategies that institutional traders use, now available to retail traders worldwide.
Disclaimer: The content of the blog does not represent any position of Trade W, does not serve as any trading-related decision advice, and does not endorse any third-party.