

 Trade W

Why Financial Statements Matter.
Have you ever been curious why some of the most successful companies go bankrupt? More often than not, the reason is not profit; it's cash, debt, and what is really on the books.
Financial statements address three important questions about any business: Are we making money? Do we have the assets to survive? And ultimately, do we have enough cash to keep the lights on? These three documents, the Profit and Loss statement, Balance Sheet and Cash Flow statement, are the three core documents of financial analysis. They are not exclusively reserved for accountants, and if you are an investor, trader or entrepreneur, understanding these documents changes everything about how you are making decisions about opportunity and risk.
By the end of this guide, you will be able to see how these three statements work together, like a complete picture of a company's health. You will understand what profit really means, how a profit-rich company can run out of cash and how to think through the connections that exist between performance, position and liquidity.
The Profit and Loss (P&L) Statement: Measuring Performance.
Think of the P&L statement as your company's report card. It indicates whether you generated a profit over a specific period, typically a quarter or a year.
Here's how it breaks down:
Gross Profit is Revenue (what you made) minus Cost of Goods Sold (what it costs to have the product made). Next is Operating Income, which is Gross Profit minus Operating Expenses (such as salaries, rent, and marketing expenses). You then add or subtract interest and taxes to get Net Profit (the bottom line).
Let's say you have a café. In January, you had $20,000 in total sales. Coffee beans and other supplies (e.g., cream, sugar, cups, etc.) cost $8,000. So, your total Gross Profit is $12,000. If you subtract $7,000 for rent, salaries, and utilities (these are your total Operating Expenses), that would give you an Operating Income of $5,000. After tax, for example, your Net Profit might be $4,200. That's what the profit and loss statement shows.
Let's go up to your favourite tech giant, Apple, which may report $90 billion in revenue and $60 billion in costs, leaving a total Gross Profit of $30 billion. After Operating Expenses, the Net Income could be $20 billion. Same concept, much larger numbers.
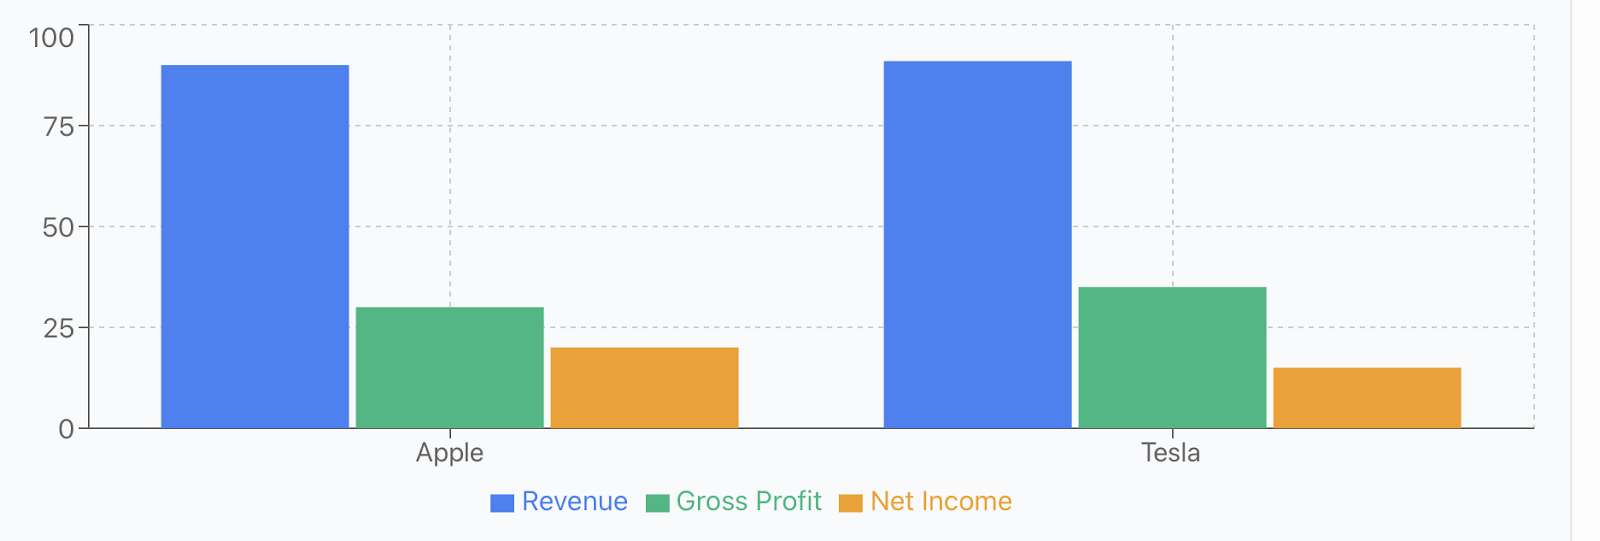
The Profit and Loss and/or Income Statement represents your performance over a period of time, but it does not represent your financial position. A big revenue number does not equate to
Balance Sheet: Your Financial Snapshot.
The Profit and Loss statement can be thought of as a movie, as it shows activity and change over a period of time, while the Balance Sheet is more like a photograph, as it reflects your financial position at a single moment in time.
The Balance Sheet is derived from a straightforward equation:
Assets = Liabilities + Equity.
You possess valuable things (assets), and you have obligations to other people (liabilities). The difference between your assets and your liabilities is your equity, which is genuinely yours.
Returning to our café example, we will say you have $20,000 in equipment and $5,000 in cash, making $25,000 in assets. Your liabilities include a $10,000 loan you took out, leaving you with $15,000 in equity. The Balance Sheet "snapshot" shows you: what you have, what you owe, and ultimately, what is truly yours.
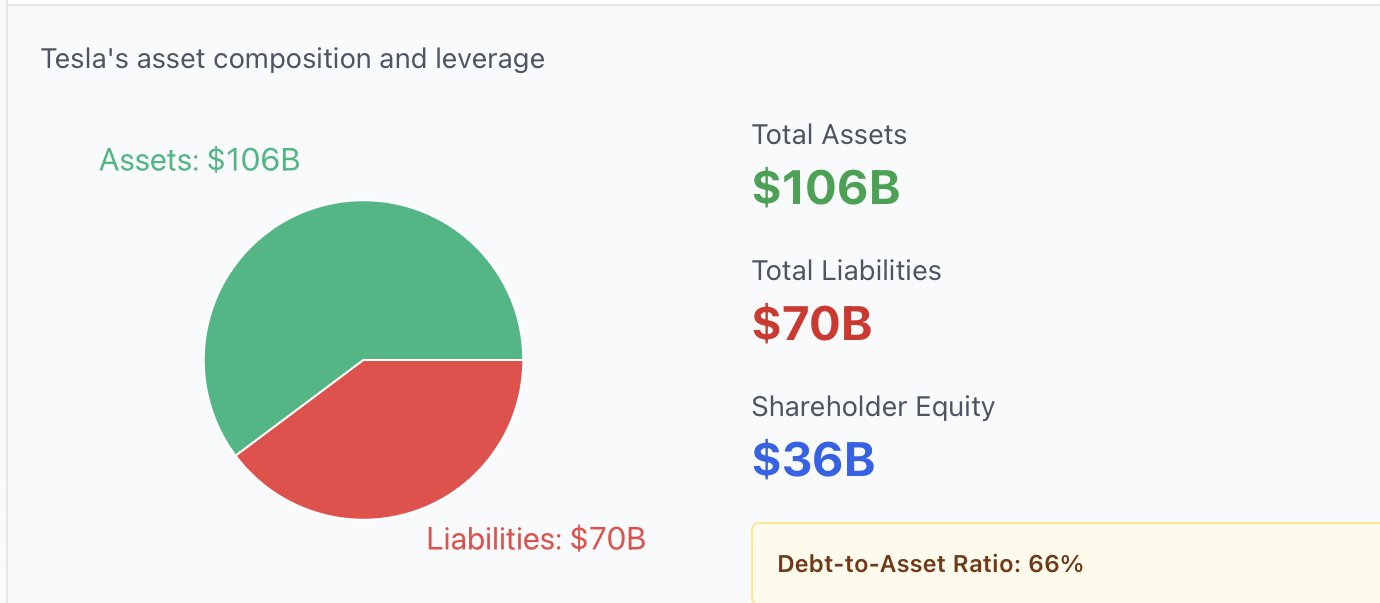
For a large corporation like Tesla, the numbers are larger, but the idea is exactly the same. If we look at Tesla's Balance Sheet from 2024, it shows approximately $106 billion in assets. In comparison, Tesla has approximately $70 billion in liabilities (debt, payables, etc), which leaves them with around $36 billion in shareholder equity. Ultimately, this indicates to investors whether Tesla is on solid ground or dangerously over-leveraged.
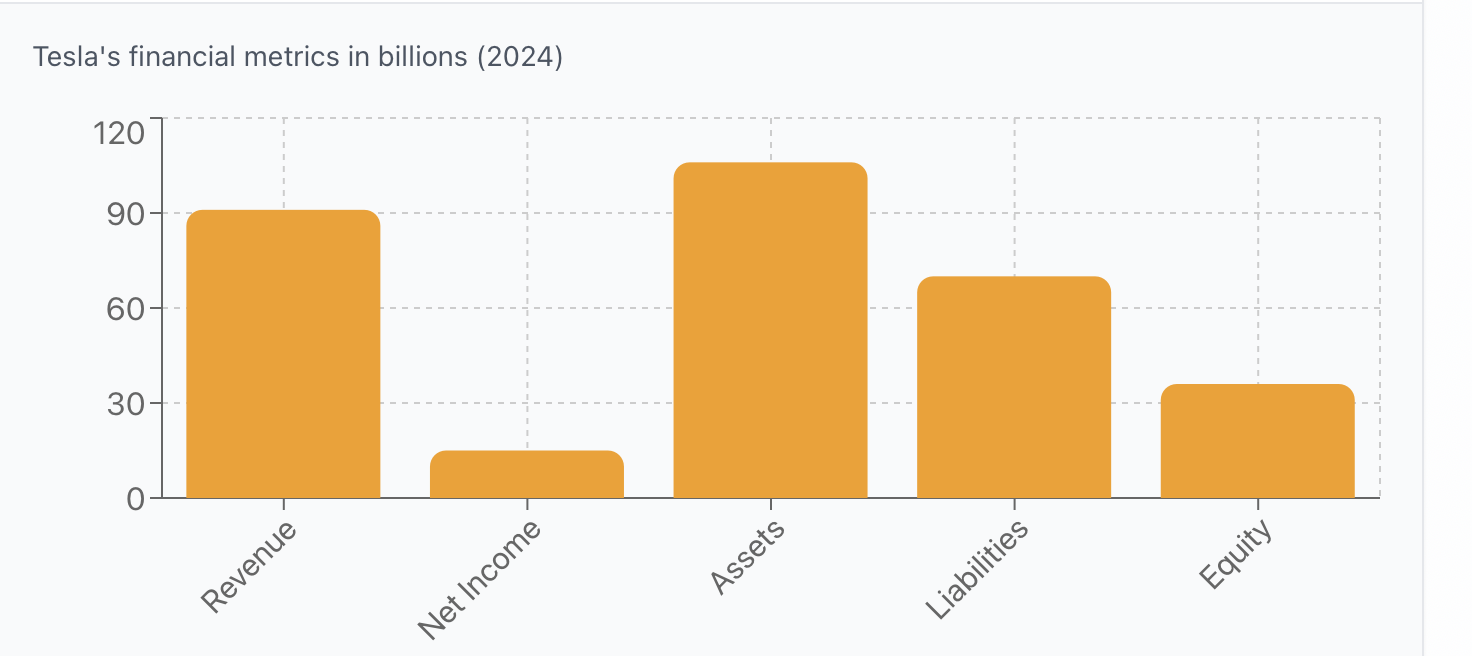
What are you worth right now? Or, it shows your financial ability or health. A business may show profitability on an associated P&L statement, but it may also have a significant debt burden on its Balance Sheet. This is why you will always want to have both.
The Cash Flow Statement: Following the Money.
This is when reality sets in. You can make a profit and still go broke.
The Cash Flow statement shows the cash flow into and out of the business in three areas: Operating Activities (cash from running a business), Investing Activities (cash used to acquire assets), and Financing Activities (cash received from and/or paid to investors and creditors).
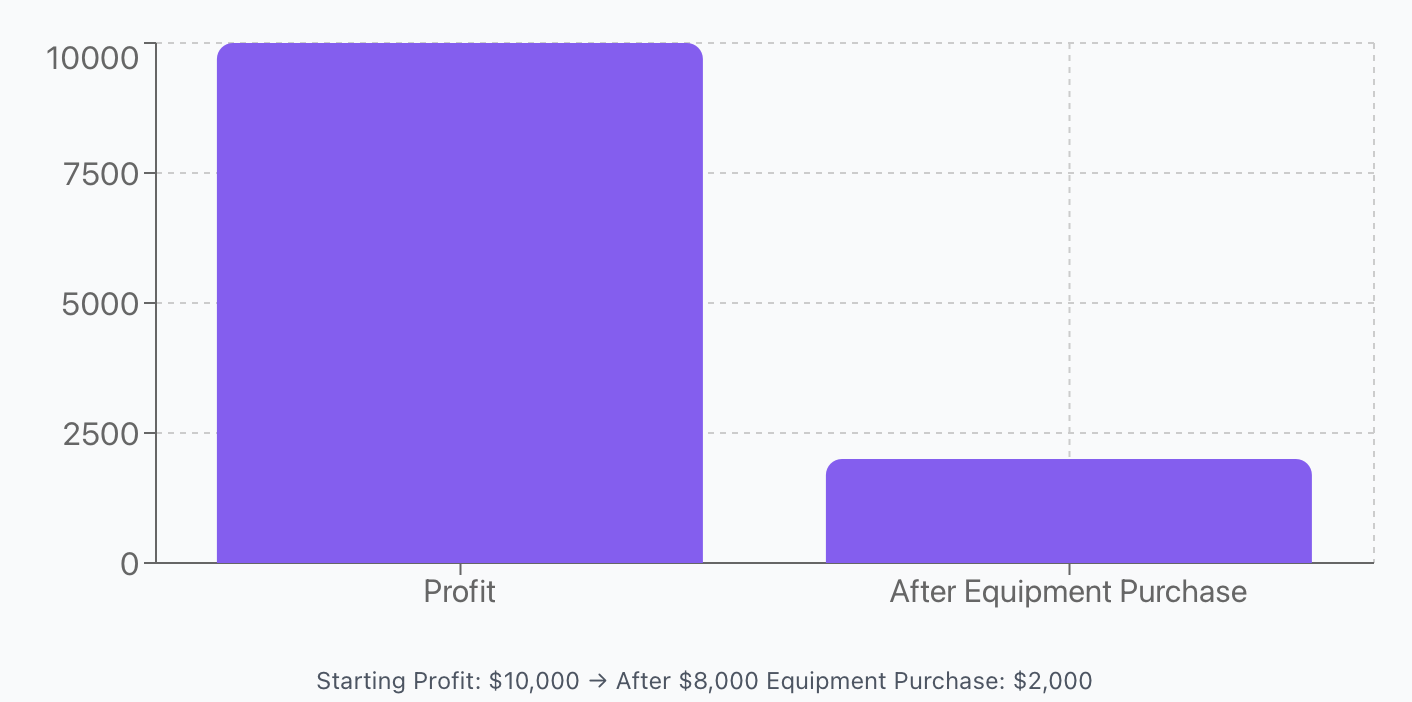
For example, you have made a $10,000 profit this year. However, you bought some new equipment that cost you $8,000. The equipment purchase will not show up as an expense in your profit & loss statement, but it certainly reduces your available cash. After that purchase, your actual cash on hand is not $10,000 but $2,000. Your profit looks good, but your cash position tells a different story.
Amazon is a great example of this. For years, Amazon posted very small profits (or losses) on large sales. However, what many people did not see was that Amazon was spending billions of dollars building data centres, warehouses, and infrastructure. The cash flows were identified on the Cash Flow statement. Amazon was not in trouble; it was investing heavily for future domination of its market. This distinction is what sets smart analysis apart from panic.
Where is the cash, really? Think of cash as the truth serum of financial statements because cash cannot be inflated. You have it or you don't.
The Three Statements Compared: What's the Difference?
Let's put them side by side:
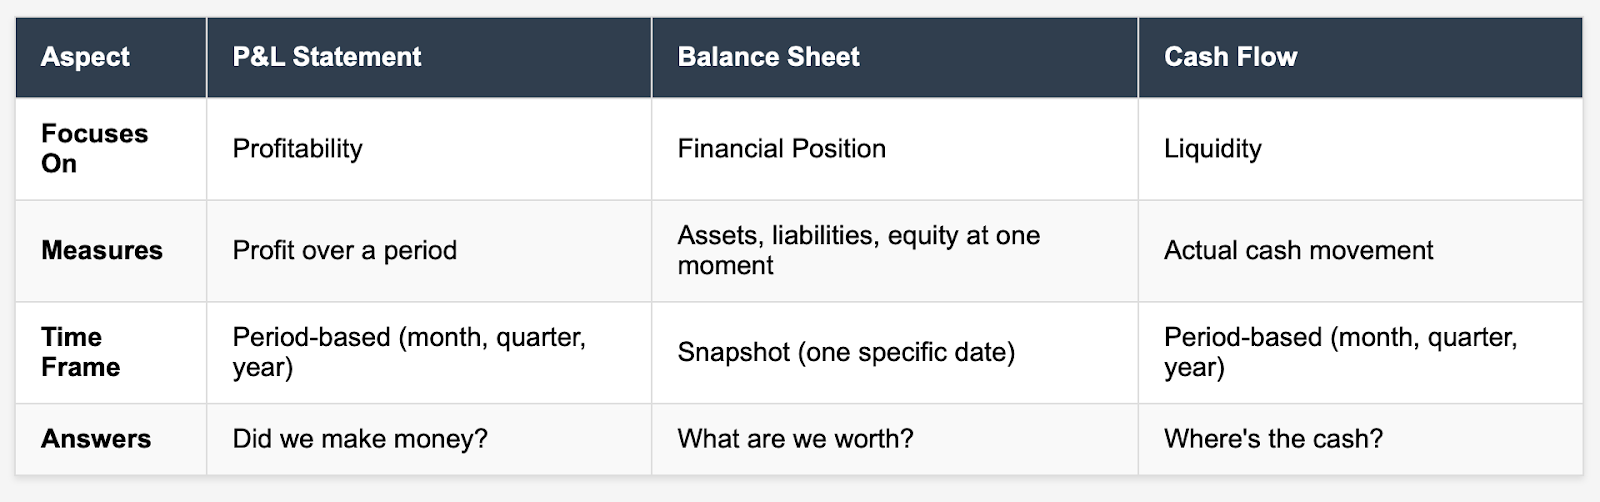
The P&L statement indicates the level of performance, the Balance Sheet shows strength, and the Cash Flow helps estimate the length of the success both options can last. Each report accounts for different parts of the story. In the absence of one report, you are at a disadvantage in decision-making. A company can have an exceptional P&L but have a debt burden (Balance Sheet problem) or be burning cash (Cash Flow problem). Alternatively, even with assets and equity, a company may be okay taking short-term losses to build for the long-term.
How They Work Together: From Profit to Equity
To start, you look at the P&L. Your company has $100,000 in net income. That profit goes to the balance sheet in retained earnings (the money the company keeps and does not pay dividends to shareholders). Your equity is up $100,000 at that point. And at the same time, your cash asset line on the balance sheet is up $100,000.
Then, here is where the cash flow statement comes into play and tells you what really happened. Let’s say that, for example, the company buys $50,000 of income to purchase some new equipment. Equipment would be classified on the balance sheet as an asset; however, this represents a cash outflow. So now your balance sheet would show $50,000 less cash and $50,000 more in equipment. Your equity still increased by $100,000, but now you have changed what the mix is.
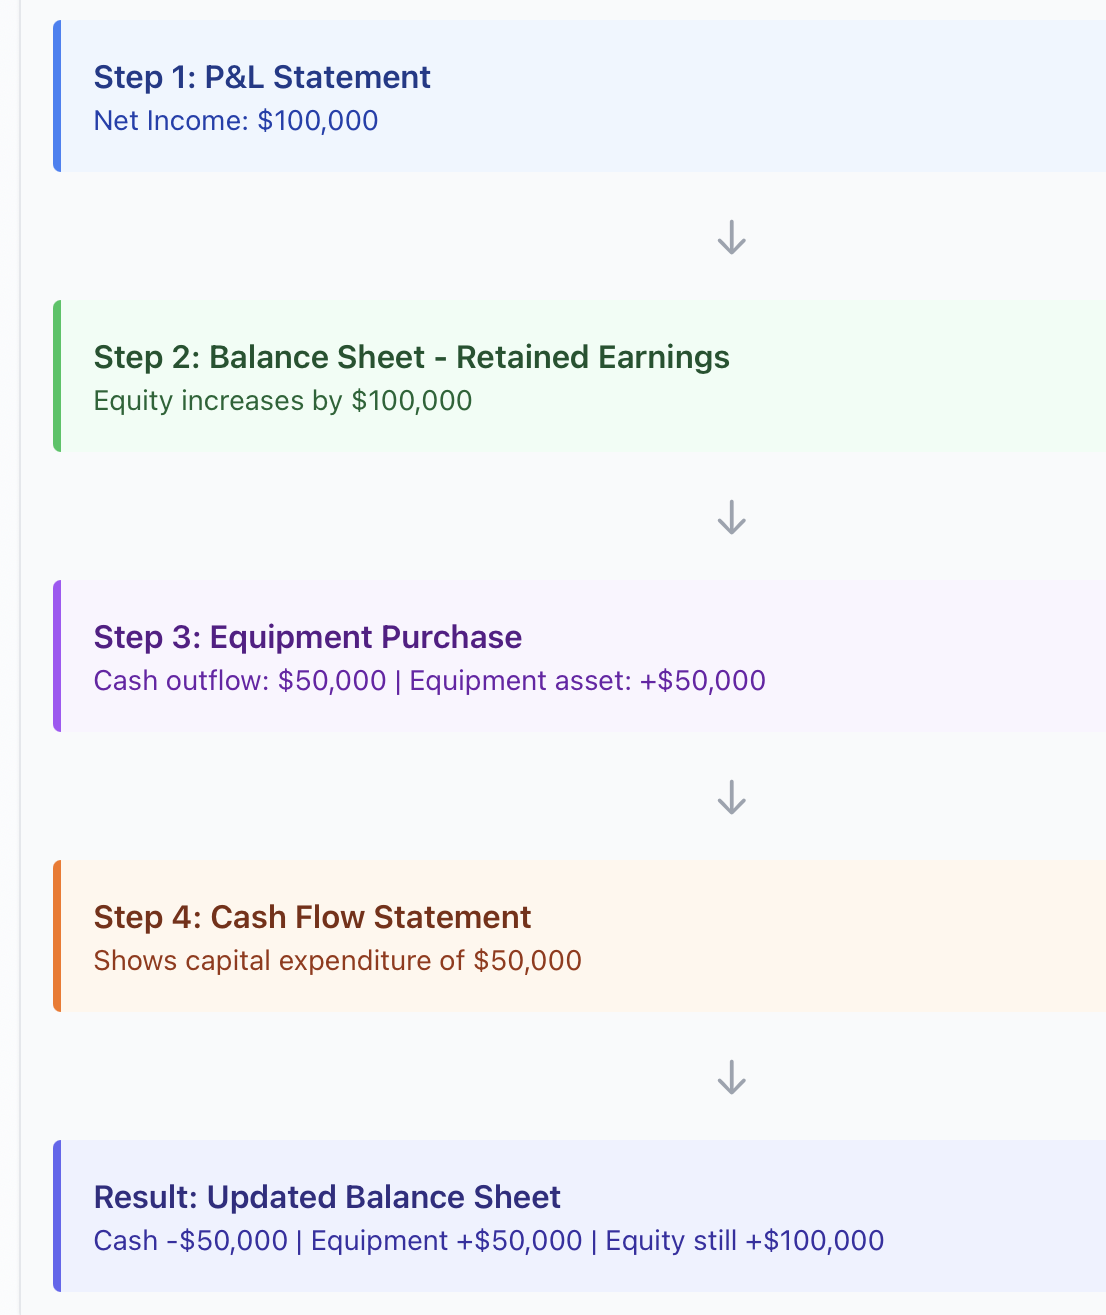
This is why understanding the linkages is important. Profit increases equity. But then how that profit gets used (reinvested into equipment, sitting in cash, paying down debt) is all captured in the cash flow statement and shows up on the balance sheet.
Netflix reported small profits for years while it spent money building out its content and technology. The Income Statement did not look great. However, the true story was revealed in the Balance Sheet and the Cash Flow Statement: Netflix was building itself into a powerhouse. Once it capitalised its heavy investment in content, it paid them all back with profits. Investors who understood their three statements together made money; those who only considered one statement were confused.
Why This Matters for Traders and Investors
Having a good understanding of financial statements isn't simply a quirky bit of accounting knowledge. It can mean the difference between making smart decisions and making errors that cost you money.
For Investors: Financial statements allow you to assess whether a company is truly sound financially speaking. You can see if it is growing its earnings, if it is carrying manageable debt levels, and if it is generating cash. If you see a company growing revenue outdoors but carrying significant debt, tread lightly. If you see a company with modest growth but a fortress-like balance sheet, then that's the type of business to bet on.
For CFD Traders: Stock prices often move based on technical patterns, but what can often lead to these major price moves are fundamental shifts discovered in financial statements. A company with weakening cash flows could reveal a problem before the investors anticipate it. Similarly, a company with improved profitability could lead you into a breakout period.
For entrepreneurs: If you are running a business, then these financial statements will reveal whether you are even profitable, how much financial cushion you have, and how long you can stay afloat in a downturn. Many entrepreneurs are shocked to learn that they are actually "profitable" and yet running out of cash. Your statements will tell you this.
Tesla is a prime example. Its Profit and Loss statement shows a consistent trend of profit growth. Its Balance Sheet shows it has taken considerable debt out for expansion. Its Cash Flow statement shows significant cash burn related to capital investments. Collectively, they present the same story, namely that Tesla is betting its survival on future sales, leading to justifiable current expenditure. That gamble seems to have paid off, and the analysis comes from financial statements, not speculation.
Common Mistakes: What Not to Do.
Even educated people can misinterpret financial statements. Here are the pitfalls to avoid.
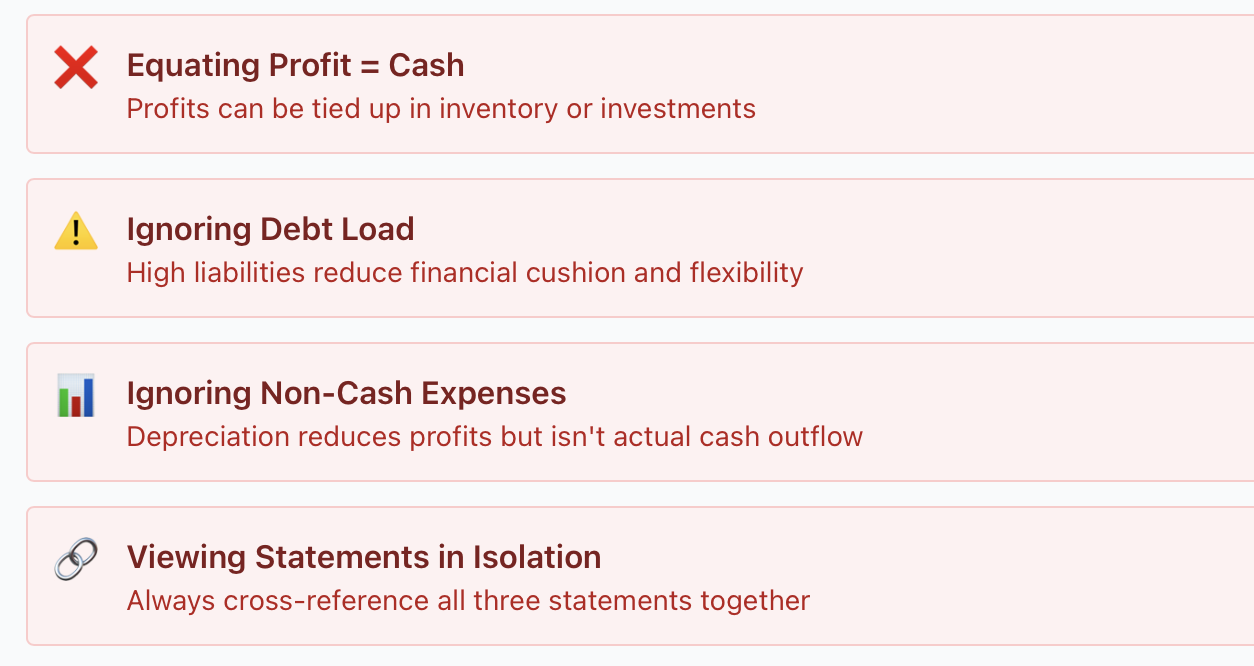
Mistake 1: Equation Profit Equals Cash. A company can show profits of $10 million but still have a negative cash flow in the cash flow statement. If those profits are tied up in inventory or capital investments, those may not necessarily be ‘cash.’ Profit and cash are not the same thing.
Mistake 2: Ignoring the debt load. If the company has $100 million in assets but $80 million in liabilities, it has far less cushion than if it had $100 million in assets and only $20 million in liabilities. Always examine both sides of the Balance Sheet to assess a company's financial strength.
Mistake 3: Not recognising non-cash expenses. Depreciation reduces profit on the P&L, but it is not a cash outflow. It is simply a timing difference (the price of machines wears out, but companies don’t buy new machinery every year). Recognising which expenses are non-cash and which actually drain the bank will help you understand reality.
Mistake 4: Viewing the statements in a vacuum. A surge in the P&L could camouflage a deteriorating balance sheet. Cuts in cash flow projections can be red flags. Always cross-reference statements together. Just because one positive number says its positive does not give the entire meaning.
The checklist is short: Read all three statements. Compare each to third-party and year-over-year results. And do the trends make sense together? Do not take one number as absolute.
Case Study: Tesla Profit, Assets, and Debt Working Together.
Tesla demonstrates that the financial statements tell a complete story.
In 2024, the P&L for Tesla now reflected accelerating profitability. Revenue was around $91 billion with net income exceeding $15 billion. That's amazing growth and margins to which any automaker would envy. The takeaway: Tesla is crushing it.
But the Balance Sheet tells the full story. Tesla has about $70 billion in liabilities versus $106 billion in assets. That's a hefty amount of leverage. Tesla has borrowed across to build factories, invest in technology, and scale production. The debt to asset ratio is aggressive.
Now look at the Cash Flow statement. Tesla generates substantial cash flows from operations and frequently exceeds $15 billion in operating cash flows. But capital expenditures (building factories, doing research) can be more than $10 billion in a year. That provides only limited discretionary free cash flows for dividends or debt reductions.
Tesla is generating profits and cash, but returns every dollar and more for growth. Moreover, it is generating profits, but almost all profits are paid back into the business. The Balance Sheet looks alarming with the amount of debt, but the cash generation is strong to support the debt. This is sustainable aggressive growth in the model and not a house of cards.
An investor seeing "Tesla is profitable" would only understand part of the picture with respect to debt load. An investor seeing "Tesla is heavily leveraged" would only understand part of the picture - that their investment might be at risk. But when the reader sees all three statements, it provides a full picture of a company executing a deliberate growth strategy: let profitability and cash flow drive reinvestments to harness market share and keep technological lead.
Turning Numbers into Insights:
Financial statements are the vocabulary of business. Most people find them intimidating. They don't have to be.
The profit and loss statement shows you the race you run. The balance sheet shows you where you stand. The cash flow shows how far you can go.
Once you learn to read these three reports together, company analysis becomes even clearer. You will see red flags that others may miss. You will know not only if the firm made money, but if that money is real, the allocation of that money, and the current course is sustainable.
Whether you are thinking of investing in a stock, evaluating a company to trade on CFDs, or running your own business, these reports are your map. They resolve confusion to clarity, hunches to informed decisions.
The numbers never lie. You just have to know their language.
Frequently Asked Questions
Can you explain the major difference between an income statement and a balance sheet?
The income statement (also known as profit and loss, or P&L) represents profit or loss over a period of time, but the balance sheet shows a financial position at one point in time. The P&L is a movie, and the balance sheet is a photograph.
In what ways does net income flow through to the balance sheet?
Net income from the P&L flows to the balance sheet as retained earnings that increase shareholder equity. If the company reinvests that income then the asset mix shifts (say adding equipment). If the company distributes it as dividends, then equity is reduced by the same amount.
Which is more important: P&L or cash flow statement?
Both are extremely important, but they are telling different stories. A strong P&L with weak cash flow could be a warning sign of trouble ahead. Another example is if a company is in an investment phase they could have a lower P&L profits, but still be generating cash. You should have both to get the complete picture.
Ready to make smarter financial decisions? Learn how to analyze stocks like a pro by exploring our fundamental analysis guide and unlock trading strategies based on real data.
Start Your Trading Journey Today: Master the language of finance on Tradewill.com where education meets opportunity.
Disclaimer: The content of the blog does not represent any position of Trade W, does not serve as any trading-related decision advice, and does not endorse any third-party.