

 Trade W

Rising Wedge Pattern Explained – Definition and Market Significance
The "rising wedge" pattern of price movement is an example of a Technical Analysis (TA) chart pattern, where prices are moving up to new highs and new lows, but the space between the highs and the lows (i.e., the price movement) becomes narrower and narrower each time price starts moving upwards. Essentially, the trader is watching two trendlines - one that connects the swing highs and one that connects the swing lows - and both of these trendlines are pointing upwards and getting closer together like a funnel.
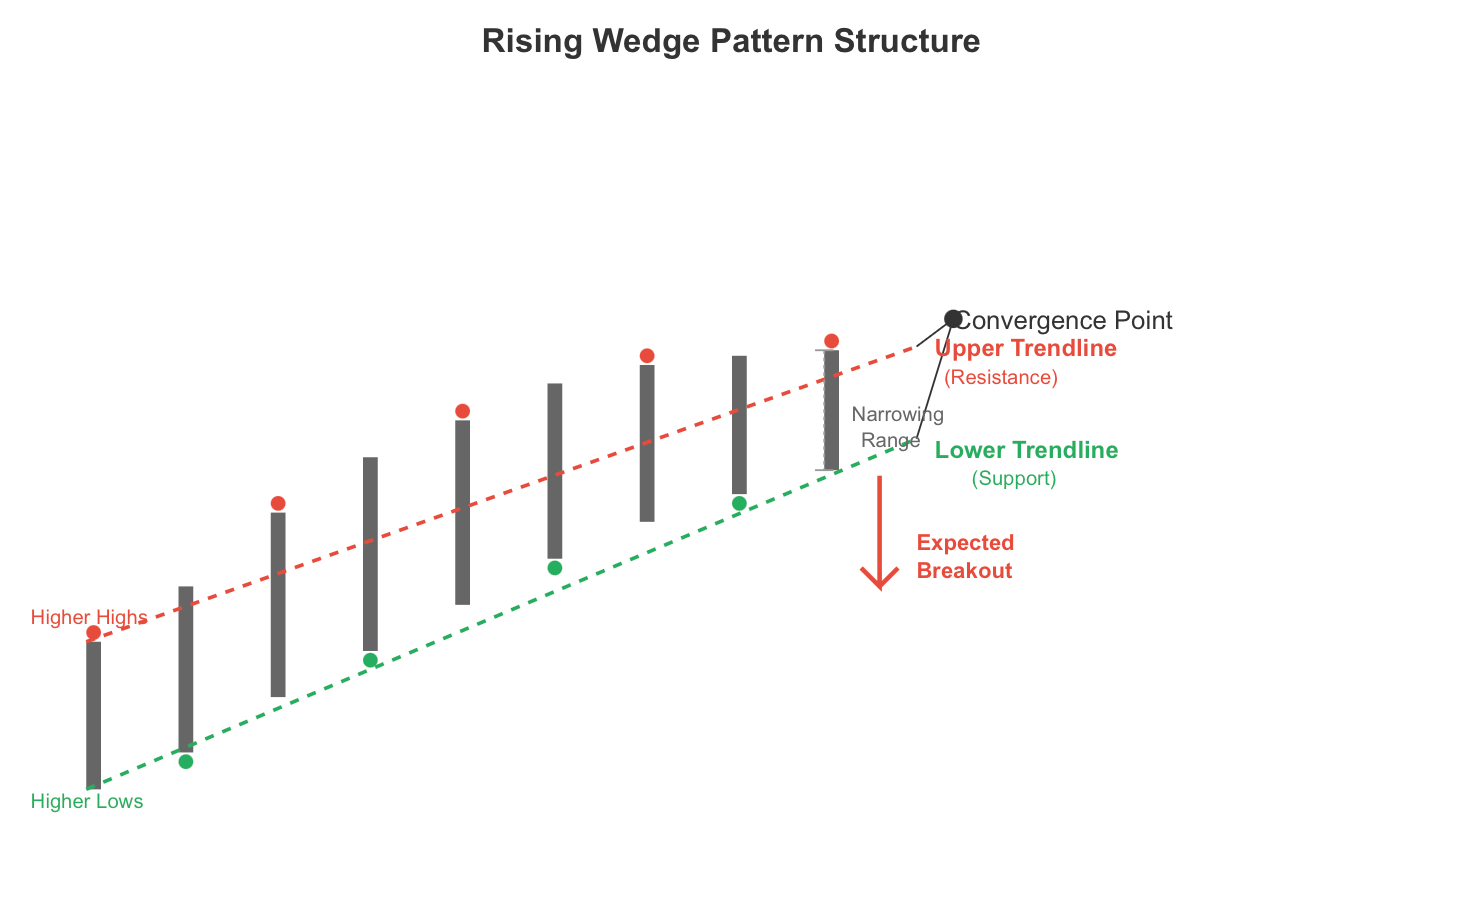
Most people would assume an upward-trending stock means an upward-trending stock; however, this is not always the case. A stock that has developed a rising wedge does so because the momentum has been decreasing as the stock has developed the rising wedge.
You can see this by looking at the distance between the recent swing highs; the distance between each swing high is less than the distance between each swing low, which indicates that, although the stock is making new highs, the need for a greater amount of momentum to create new highs is a sign that there is a decreasing amount of momentum for the stock moving forward in its trend.
Most of the time, an ascending wedge indicates that there will be a price trend reversal. When you have an ascending wedge, and it has formed at the end of an extended bullish market, you are signalling to the sellers that they are entering the market and that the buyers are pushing up prices.
The ascending wedge is different from rising wedge formations due to a lack of buying support, which continues to decline through the formation phase. This signals to investors that buying pressure will soon be decreasing.
As an example, refer to the EUR/USD daily timeframe in mid-2023. As prices continued to rise, more volume was being generated by selling. Obviously, at the very end of the formation, the wedges would eventually decrease, and eventually, the price would be able to dip significantly below the lower trendlines. As such, those who recognised the ascending wedge would have already established positions for the anticipated reversal.
The NASDAQ has also proven to be a viable example, as demonstrated through numerous historical occurrences of ascending wedges forming over an extended period (weeks and months), before the price experienced a significant reversal in trend direction. All of these occurrences have demonstrated the psychological dynamics of the forex market, which create trading patterns.
One way to think about it would be to think of how you climb stairs. As you climb, the distance between each step becomes shorter and shorter. At first, you can climb, but at some time, the effects of climbing will begin to show, and thus, your ability to continue is limited by fatigue. At that point, you either slip down from the top or turn back around. This effect is the same as the upper leg of an ascending wedge pattern; the market is beginning to lose its momentum.
Another critical factor to consider about this type of pattern is that an ascending wedge formation does not indicate that a trend reversal is necessarily going to happen. To determine the potential for a reversal in price direction, you must independently confirm that the price has dropped below the lower trendline with sufficient purchasing volume before making any trading decisions. Due to how the markets are structured, many patterns fail; therefore, you will encounter many more false signals than you realise.
When studying your charts, be sure to mark each swing point high and low clearly. Draw trendlines carefully and measure the angle of convergence. Many traders will take the angle of the wedges either in degrees or compare it as a percentage narrowing. Once you compare a typical uptrend against an ascending wedge, you will be able to recognise many more of the major differences in the two distinct patterns.
Key Features of Rising Wedge Pattern – 5 Must-Know Criteria
Not every increasing pattern on a chart is an upward-trending wedge. You will need to know what makes up an upward-trending wedge so you can differentiate between a legitimate upward-wedge pattern and a fake signal or other structures like channels and triangles.
To identify a legitimate upward-trending wedge, here are five features you need to know.
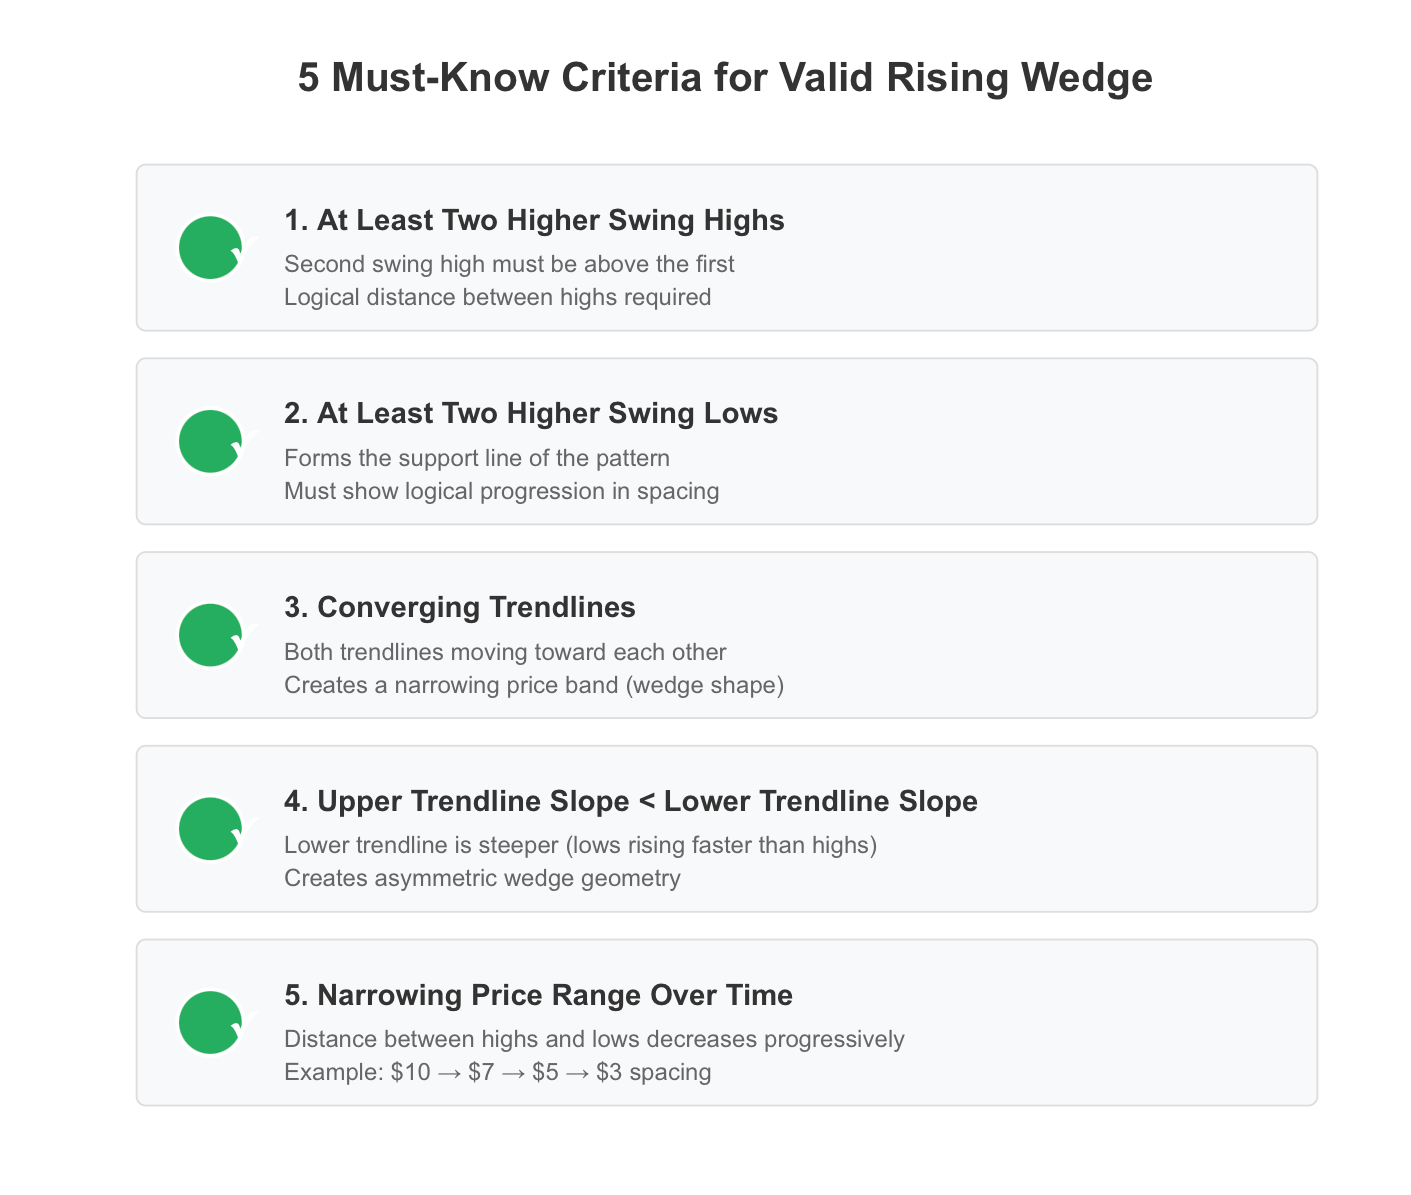
1. At least two higher swing highs
The first component for identifying a legitimate upward-trending wedge is having at least two higher swing highs on the chart. The second swing high should be above the first swing high. You also need to pay attention to how far apart the two swing highs are from each other. If they are too close together or far apart from each other, they may not form a legitimate upward-trending wedge. Price action is indicative of volatility, and the more volatility in the stock market, the less people are willing to enter the market to buy stocks.
2. At least two higher swing lows
Like with higher swing highs, two higher swing lows need to form a support line on the chart. These two swing lows represent the first swing high after prices made an upward move. Price action formed a descending series of sequential upward swing highs on the left side of the chart before making a downward move. The second swing low represents an upward trend for the upcoming higher swing lows. When drawing your trendline connecting the two swing lows, make sure that the distance between the two swing lows has a logical progression. If you have one swing low that is substantially lower than the others, it will create a discrepancy in the trendline.
3. Converging trendlines
The third required characteristic of a legitimate upward-trending wedge is that you must have at least two converging trendlines: an upper trendline and a lower trendline. Both of these trendlines must be moving towards each other to form a narrow price band. If you calculate the slope of the upper trendline, you will find that it's more pronounced than that of the lower trendline. This is what causes the wedge shape to form. If the first two trendlines converge too tightly together, you may not have a legitimate upward-trending wedge. If they converge too widely apart, it may just be a channel.
4. Upper trendline slope is less than the lower trendline slope
This ensures you get that classic wedge geometry. The lower trendline is steeper, meaning lows are rising faster than highs. This asymmetry is critical. It shows that support is catching up to resistance, squeezing price into a corner.
5. Narrowing price range
You want to monitor how far apart the highs and lows are each time you see one develop, and you want that distance to decline numerically over time. For example, if you have the very first swing high and swing low at $10 apart, the next pair could be $7 apart, then $5, then $3. This demonstrates that volatility is decreasing, and traders are having more difficulty deciding on the direction of the price.
Take, for example, a professional daily chart of Apple's stock that was created in early 2022. You would see a classic formation of a rising wedge, anchored by clearly defined swing highs and swing lows. Observe the angle of convergence and note that volume decreased during this consolidation period, indicating a decrease in volatility and an increase in uncertainty from traders about where the stock will move next. Now compare that to a false wedge where prices bounced erratically, and the swing highs and swing lows don't converge properly.
To visualise this more easily as a beginner, think of a funnel. As you pour water into the funnel, the flow will tighten down towards the bottom when it reaches the narrowest part. Therefore, you should expect price action to move in this same manner when using a rising wedge as a basis for your trading decisions.
Convergence is extremely important for this pattern. Be sure your trendlines are converging; otherwise, you're looking at something different from a rising wedge. You could be analysing an ascending channel or some other pattern altogether. Look at at least two different instances in the real market so that you can verify what the market does when it produces a rising wedge pattern.
Step-by-Step Guide to Drawing a Rising Wedge Pattern
Determining a rising wedge shape on a chart can be relatively easy after you recognise a rising wedge formation on a chart isn’t that difficult, just know what to look for, but accurately drawing it will take some practice if you’re new to doing it. Below is a step-by-step process for creating your own rising wedge regardless of whether you trade forex, stock, or cryptocurrency.
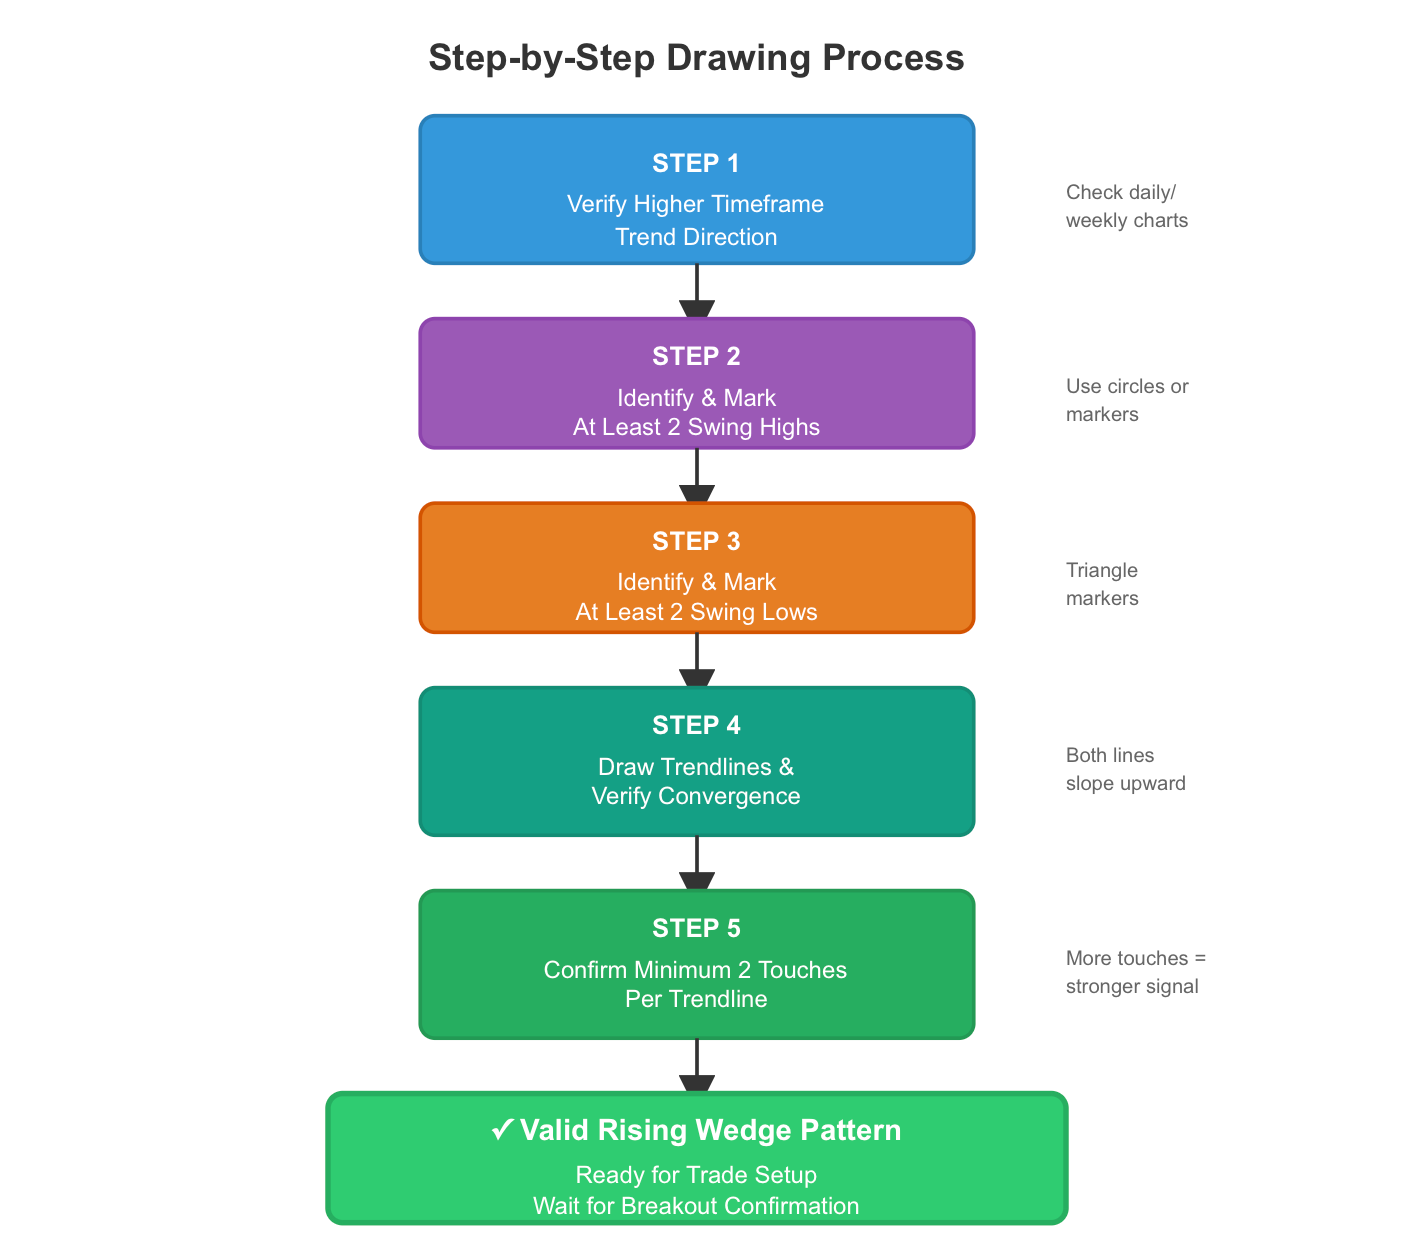
Step 1: Verify the higher timeframe trend direction
Before you create anything, meaning draw anything, zoom out to a larger timeframe, look at the daily or weekly actionable chart to see what the trend looks like. Is it in an upward direction? A rising wedge configuration provides the most bang for your buck if it appears after an extended bullish trend move, and if it appears following a downtrend, then more than likely, you are viewing a different chart pattern.
Step 2: Draw the Swing Highs
Identify at least two clearly defined Swing Highs where the price made a reversal move and retraced after that move. They do not need to be perfect tops, but they should be relatively obvious reversal levels. Using a tool available to you via your date/charting software, add markers (or place dots) to the tops of each of these Swing Highs. Again, the more contact points you place on your upper Trend Line, the stronger your pattern will be once it has developed.
Step 3: Draw the Swing Lows
Repeat the above process for your Swing Lows. Identify at least 2 distinct Swing Lows where the price has made an upward movement, then pulled back. Those Swing Low points provide your lower Trend Line. Again, the more contact points you place on your lower Trend Line, the stronger your pattern will be once it develops. Ideally, you want to have at least 3 or 4 contact points on each of your Trend Lines to maximise the reliability of your analysis.
Step 4: Verify that the upper and lower trendlines converge
Draw a line connecting the swing highs, and then another line connecting the swing lows. Both lines must be angled upwards and converge towards each other. At this stage, verify the angular relationship of the two trendlines with respect to the direction in which they are going (i.e. if the trendlines are parallel to one another/ diverging from one another, then you are not viewing a rising wedge).
Step 5: Confirm that the price has touched the trendlines a minimum of 2 times
This is a verification step. Each trendline must have at least two contacts; however, more than two contacts is preferable. If the price only contacts 1 line and then breaks through, you will not have a confirmed pattern. The more the price contacts the trendlines, the stronger the indicator will be when getting ready for the break.
Let's take an example of using a professional trader's setup. Let's use a 4-hour EUR/USD chart from any of the major trading platforms, and find the highest and lowest points (mark the swing highs and lower swing lines with a small circle and triangle, respectively). Connect the swing highs and lows using the trendlines; Zoom into the trendline to confirm that the trendline angles are converging upwards as indicated. Count the number of times the price has touched each trendline. If it has touched each trendline 3 or 4 times, then you are very likely set up correctly.
For beginners: take out a piece of paper and a ruler and draw a funnel shape with an upward slope. Number the edges of your funnel shape where you have marked the price lines with a number. That is what you are doing with a chart. It also takes practice to develop a visual skill in this manner to be able to successfully draw the steep-angle trendlines from the upward funnel shape.
A very important note is that your trendlines must each touch at least 2 times, but do not make any forced connections. If you have to stretch your trendlines to fit into the required angle pattern, you are most likely not looking at a rising wedge. Be sure to annotate the actual price points during each attempt to review and learn from your past attempts.
Is Rising Wedge Bullish or Bearish? Core Trading Logic Explained
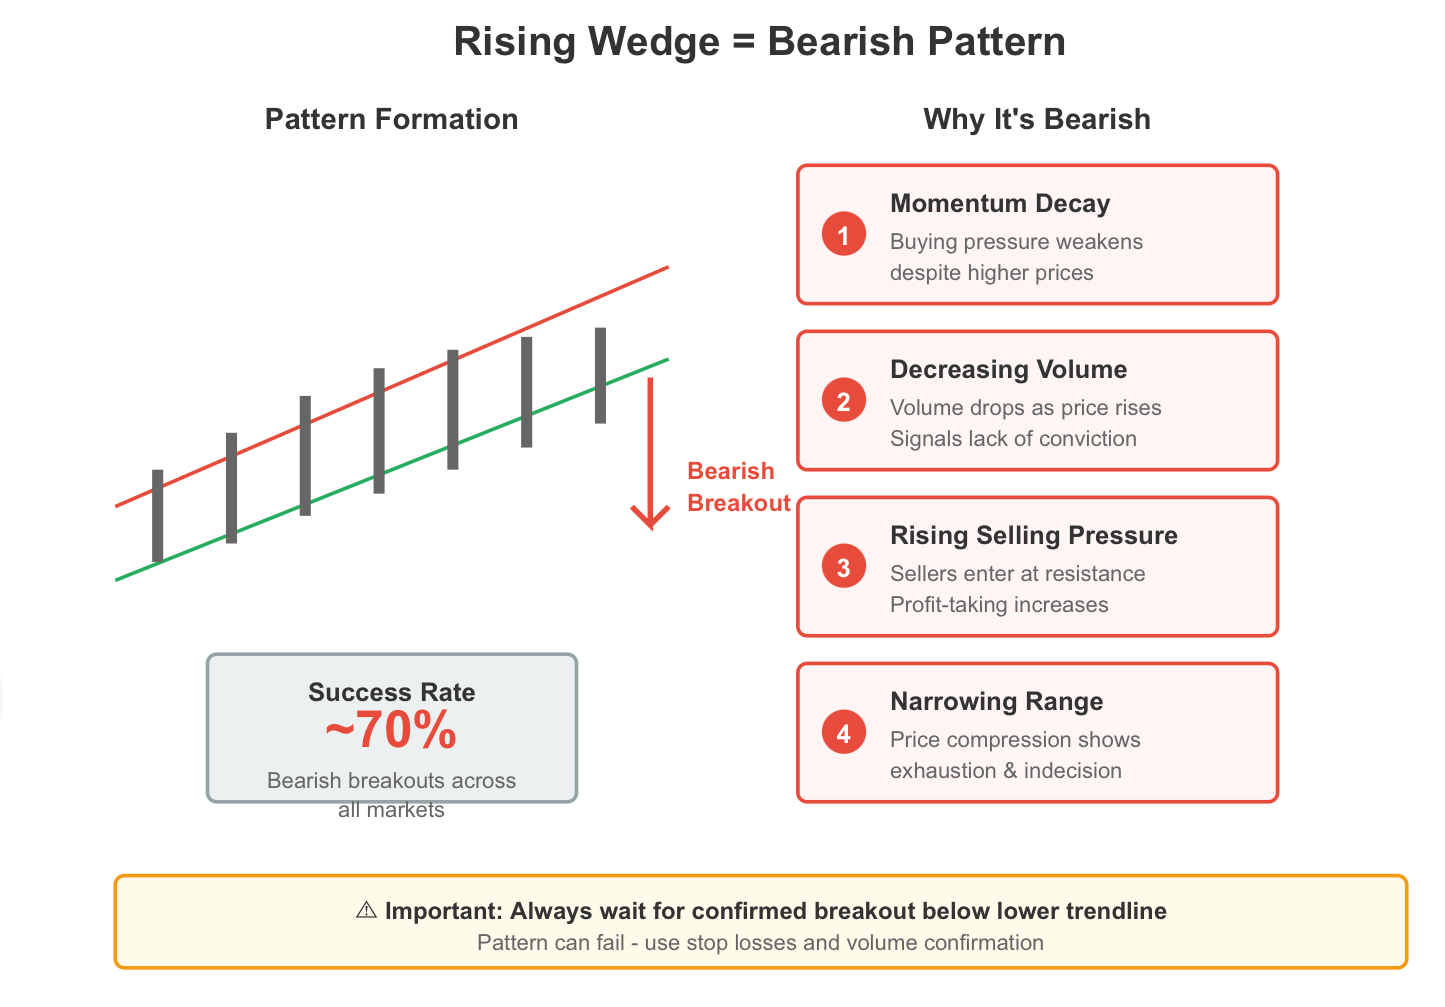
New traders often ask the same question: Do rising wedge patterns provide bullish or bearish signals? The answer to this question is that the rising wedge pattern itself will indicate a Bearish signal.
Momentum decay
The reason why a rising wedge is Bearish is that during the development of the pattern, buying momentum is deteriorating (or decaying) while new highs are made. In addition to the decrease in buying momentum, volume on this pattern is also decreasing.
Buy and sell pressure dynamics
The rising wedge has also created increasing amounts of selling pressure. Selling pressure occurs when sellers enter each time the price reaches the upper trend line to take profits. Some bulls will remain in the trade, but they are also becoming tired, and the power is beginning to shift toward sellers, resulting in the price breaking below the wedge.
In addition to the indication of increasing sell-side pressure, keep in mind the volume and price relationship. A healthy uptrend should have volume increasing as the price visits higher levels.
When viewing the volume/price of the rising wedge pattern, you will notice the volume readings are decreasing as the price rises. The decreasing connection between volume and price has produced the most common warning indicator.
Market statistics
From a statistical standpoint, a 'Bearish' breakout is likely to occur approximately 70% of the time on a breakout of a rising wedge. The relationship exists in forex and crypto markets, where volume will be in line with stock market volume; however, across all markets, the bearish bias is the same. Across the S&P 500, the vast majority of cases of rising wedges were in the wake of previous all-time highs and led to significant corrections shortly after.
For example, in late 2021, Bitcoin showed signs of the formation of a rising wedge on its daily chart. Bitcoin surged from $30,000 to $69,000, and although it was still making higher highs (new buying pressure), volume dropped off significantly. After the price broke below the lower trend line of the wedge, Bitcoin saw a further decline of nearly 50% in the next few months, which gave those trading an opportunity to either exit the market or prepare for the subsequent decline.
To better understand the mechanics behind a rising wedge pattern, think of increasing your jump height by continuing to jump. At first, you are an uncontested jumper, and you can jump without much effort. Over time, with more and more jumps, your muscles tire, and your jump ability decreases accordingly. However, in this example, you can see how the mechanics of the asset create the rising wedge pattern.
In conclusion, keep in mind that rising wedge patterns may provide you with a trade signal, but they do not mean they will always signal trades. Patterns can fail; prices can break over the top of the wedge and also continue to increase or invalidate the rising wedge. Wait until the price breaks below the lower trend line of the wedge and has a solid amount of volume behind it before entering a trade.
Rising Wedge Trading Strategies – Entry, Stop Loss, and Targets
Having understood the pattern, you can create a plan for trade by putting your trading strategy in place and planning your risk management (stop loss) and profit target areas for entry into a rising wedge pattern.
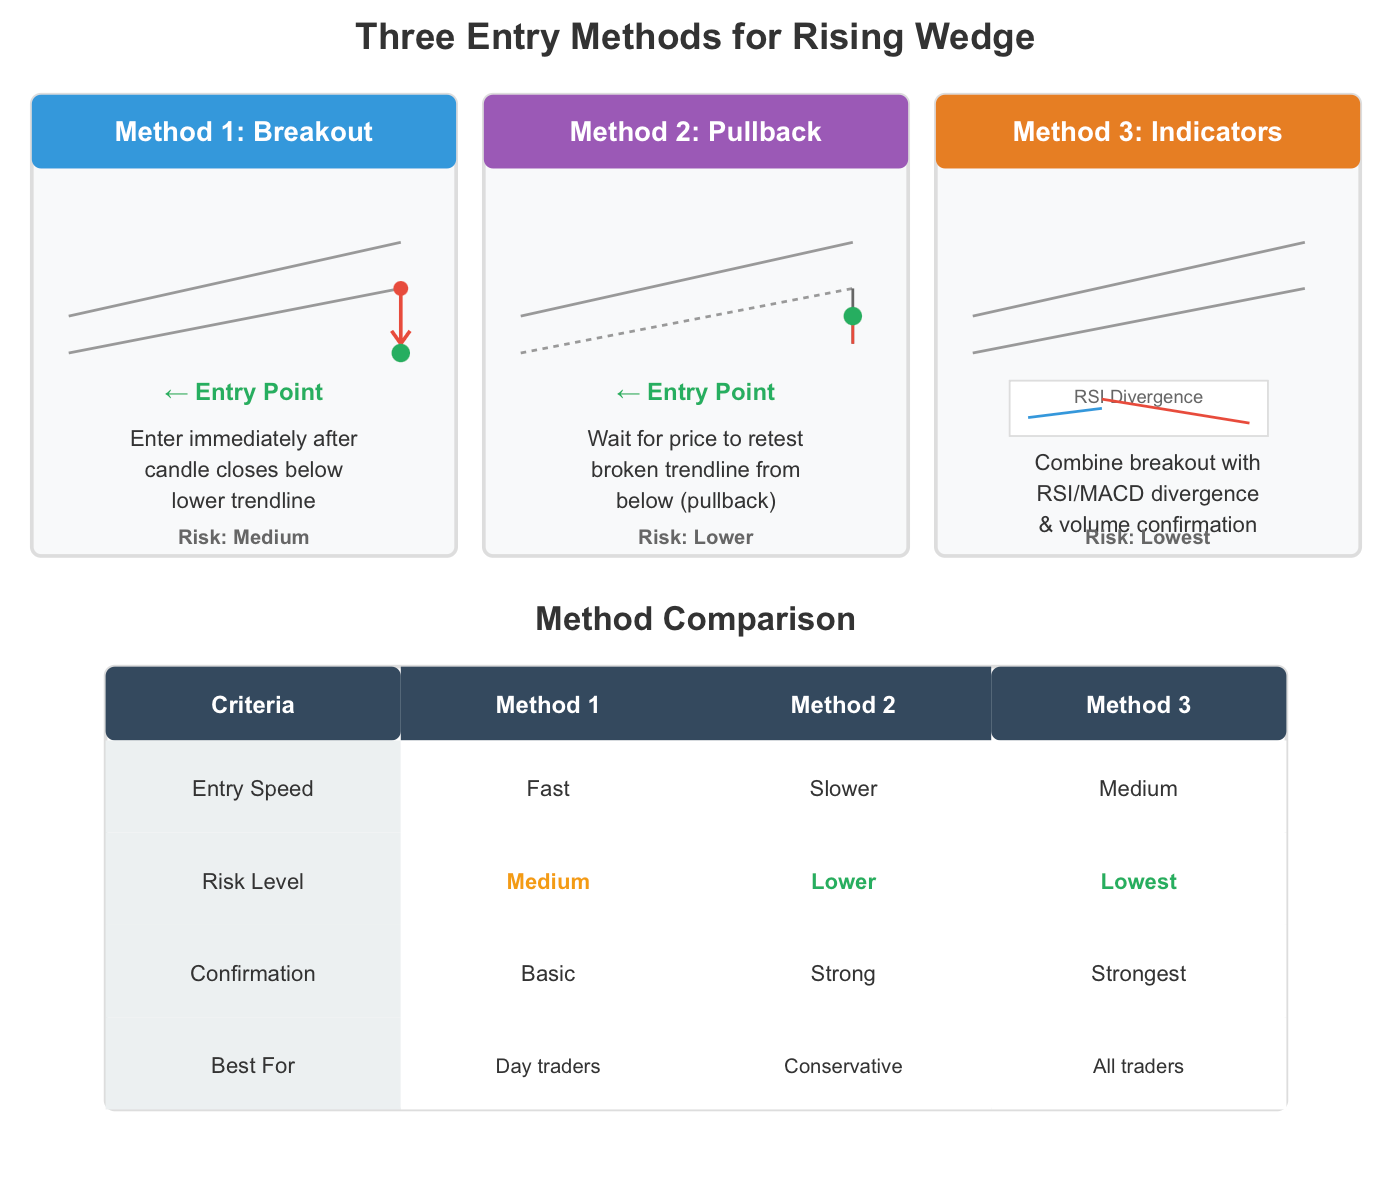
There are three popular methods of entry:
1. Break below the lower trendline: Wait until price breaks below the lower trendline before entering the trade, and then enter the trade after a price close below the lower trendline that has substantial volume. You need to see an established close, rather than just some minor movement below, before entering the trade. Typical traders will wait until they see a candle close below the trendline and enter the next candle. Doing this helps to provide a buffer against entering an invalid break.
2. Pullback after breakout: Wait until after the breakout has occurred to enter during a pullback to re-test the breakout. After a break under a trendline occurs, you will often see a price pull back into 'retesting' the breakout. Picking up a position during this period helps to minimise risk as it provides you with further confirmation of entrance and also gives you a defined area for validating your trade if the price goes back above the trendline.
3. Combine with indicators: You can combine and confirm your entry using RSI divergence, MACD momentum decay, and bearish candlestick patterns. When you notice the emerging rising wedge and the RSI shows negative divergence (indicating prices continue to make new highs while at the same time showing a decrease in the upward movement of RSI), you should be thinking of a powerful signal. If you can couple that signal with MACD histogram values that show decreasing histogram formation (while prices increase), you can make an excellent trade with a high probability of success.
Stop loss strategy
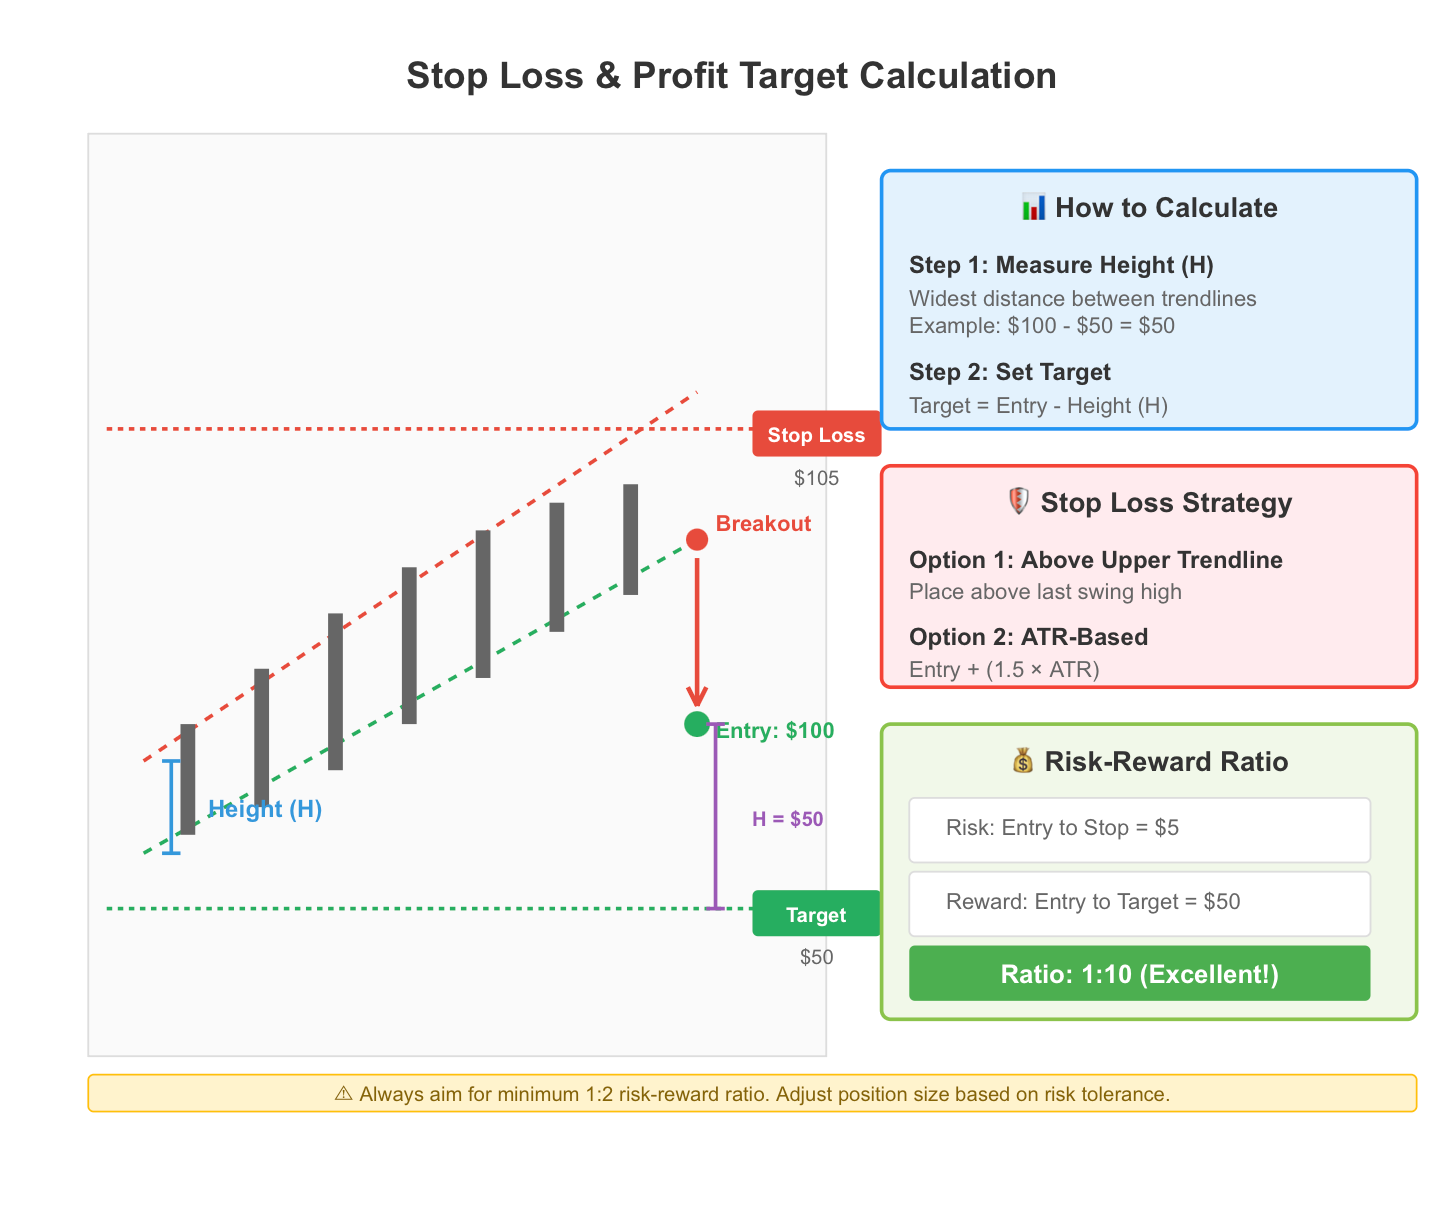
Set your stop loss at either the upper trendline of the pattern or the last swing. When the price breaks above your stop, then the trade is invalid. A second option for setting your stop is by creating a dynamic stop based on the ATR (average true range). For example, to create a dynamic stop based on ATR, place your stop at 1.5 x ATR above the point of entry. Doing this allows the trader to manage risks while accounting for normal volatility.
Target price calculation
To calculate the target price of a rising wedge, measure the height of the wedge's widest point. The height of the wedge should be your target price. For example, if the high was $10, then you would expect to see the price drop 10 points below the breakout point. Additionally, the trader can find support levels and Fibonacci retracement levels to determine the target price more accurately.
Risk-reward ratio
Every trade should have at least a 1:2 risk/reward ratio. For example, if a trader has $100 at risk, they should try to make $200 profit. With this type of ratio, it's possible to be a successful trader even if they win only fifty per cent of their trades.
Let's review a professional example. There is a rising wedge on the daily chart of EUR/USD. The trader identifies this pattern, waits for a break below support at 1.1000, and then goes short. The trader sets a stop loss at 1.1050 (which is just above the upper trendline) since the height of this wedge is 80 pips. The trader's target is now 1.0920 for an overall profit of 80 pips at a risk of just 50 pips; therefore, the risk-to-reward ratio on this trade would equal 1.6 to 1. When the price falls, the trader closes with an 80 pip profit.
Beginner traders should start small. Start by risking $10 or $20 per trade while learning the process. By risking $10 and targeting $20, you will be applying the same principles as the professionals, only on a much smaller scale. As you progress, think about it as climbing stairs; take a step at a time and check each step before placing any weight on the stair.
Additionally, every trader should practice simulating trades before going live. Practising in a demo account allows traders to learn how to identify a wedge, place an entry, and create a stop loss. The more practice you do, the more intuitive trading will become.
Common Mistakes and Failed Rising Wedge Trades
Rising wedge trades can be difficult for even the best traders. By discussing the most common mistakes, you can learn how to avoid making similar mistakes when executing rising wedge trades.
Premature Shorting (Entering Before Confirmation)
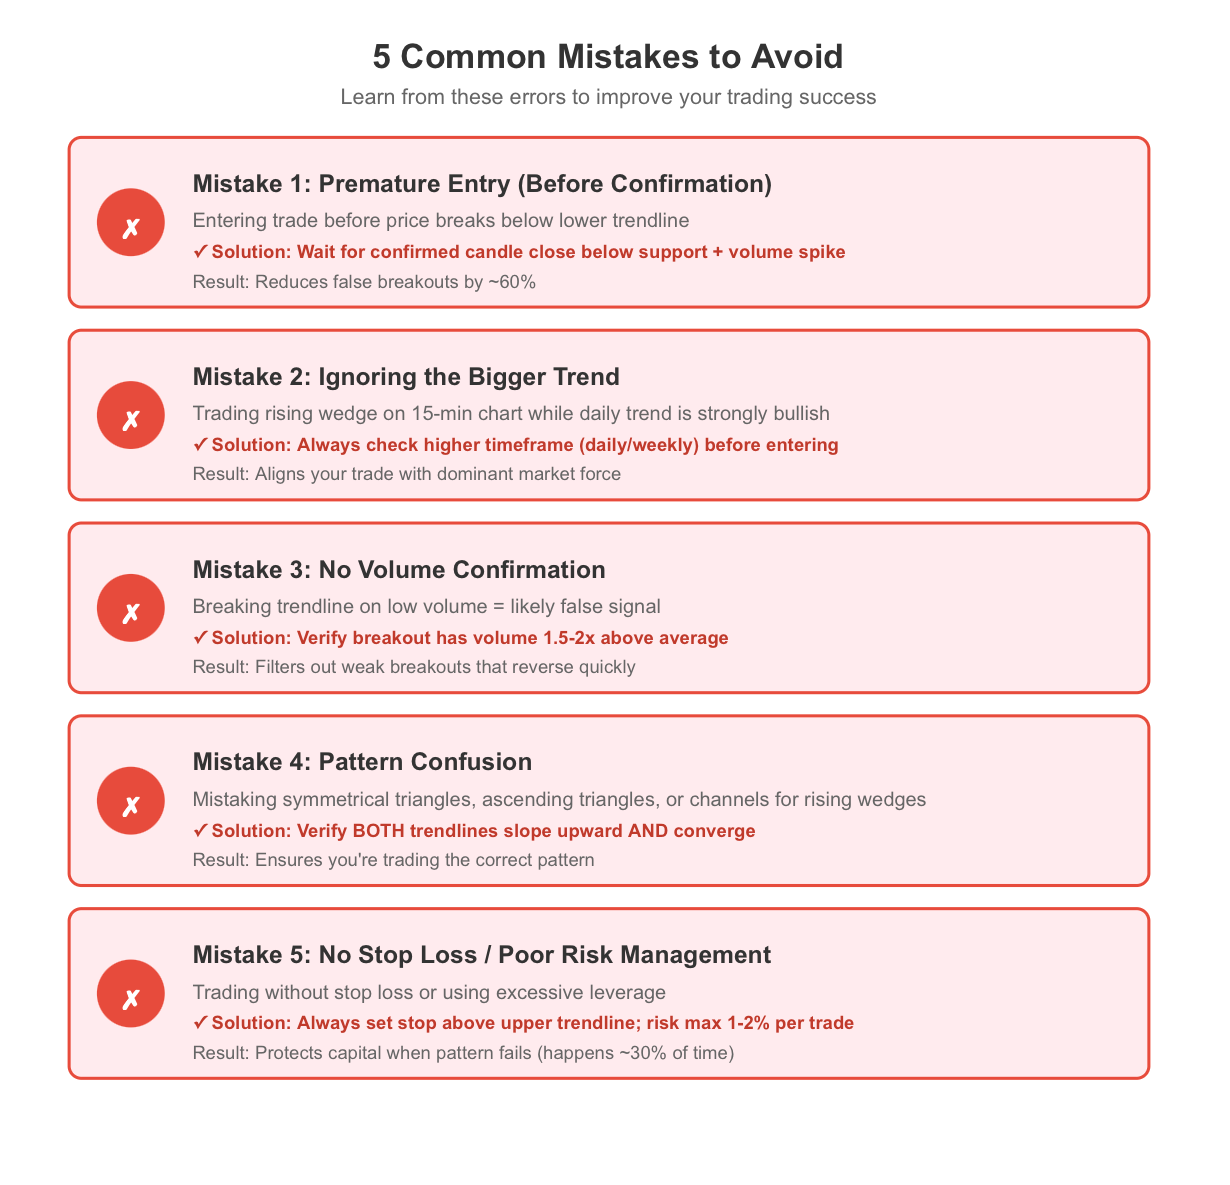
Premature shorting is probably the most common mistake made by traders. You see a rising wedge forming, and it gets you excited. So you jump into a short position before there is any confirmation that the price has indeed broken below the lower trend line. Then price continues to rise, you get stopped out of your trade, and you lose money. Always wait for confirmation; a wedge pattern is not completed until there is a confirmed break of the trend line.
Ignoring the Bigger Trend
There may be instances where a rising wedge forms on a lower time frame chart, but the overall market trend is strongly bullish. Entering a short position in a bull trend is basically trying to fight against the majority of market participants. Always make sure to check your higher time frames before deciding to go long or short. For instance, if you see a rising wedge pattern forming on a 15-minute chart, it does not mean much if there is a bullish trend on the daily chart that has a long-term uptrend.
Not Waiting for Volume Confirmation
If you see a break of the lower trend line on low volume, you most likely have a false signal. You want to see an increase in volume as the price moves below the trend line; this indicates that there has been some selling pressure entering the market. If volume is weak, the price may just bounce right back inside the rising wedge pattern. Wait for volume confirmation before executing any trades.
Confusing Other Patterns with a Rising Wedge
Symmetrical triangles, ascending triangles, and even falling wedges may confuse a trader unless they understand the difference. Rising wedges have trendlines that are both gradually sloping up to meet each other, whereas symmetrical triangles have trendlines that slope towards one another. The difference between a symmetrical triangle and an ascending triangle is that a symmetrical triangle has both trend lines sloping toward each other, while an ascending triangle only has one trend line sloping up, and the other is flat.
Here’s an example of how you can get caught in false breakouts. In 2022, BTC/USD had formed what appeared to be a rising wedge on a 4-hour chart. After the price broke below the trend line, some traders entered short positions. However, price quickly reversed course and broke back above the wedge before continuing higher. Any traders who failed to utilise appropriate stop-loss orders were left in a terrible situation. The moral of the story is that false breakouts happen. Always pay attention to your risk management.
To further demonstrate this principle, let’s say your funnel appears to be narrowing when, in reality, it is not. As soon as you reach the restricted width of the funnel, the restriction disappears, and you realise that you were duped. When this happens, you have walked into a trap. Confirmation signals are much more important than the shape of your trading patterns.
Boosting Accuracy – Combining Rising Wedge with Indicators
A rising wedge pattern can produce very high probability entries along with the use of indicators. Here is how to stack those signals together for even higher probabilities of your trades.
RSI divergence: An RSI bullish or bearish divergence will confirm the rising wedge pattern as well. A bearish divergence occurs when the price makes a higher high, and the RSI makes a lower high. This indicates that momentum is diminishing on the price, though the price continues to be driven higher. When you recognise the RSI divergence within the rising wedge pattern, you significantly increase the odds that a price reversal will occur.
MACD momentum: The MACD histogram may also assist you in identifying momentum fading by observing how the histogram is shrinking while the price makes a series of higher highs. As a result, the MACD histogram will fade as the price continues to rise; when MACD crosses bearish right at the point that the price is breaking down, it is a very strong entry signal.
Volume analysis: Volume will typically decrease as the wedge is forming, and then when it finally does break down and break through the lower trend line, there will be a surge in volume, which can be confirmed by a volume indicator. A decrease in volume while the wedge is forming and an increase in volume at the time of breakout represent classic volume analysis.
Multi-timeframe confirmation: Confirmation of the wedge is found by viewing the overall movement of the wedge on a higher timeframe, and then a lower timeframe of the chart may be used for precise entry point targeting. A study of the daily chart to identify the rising wedge pattern and looking at a 4-hour or hourly chart post-breakout, so you can reduce your risk of being caught in the price noise while in the trade.
As an example, an analysis of a practical example of this process can be seen with the EUR/USD when the wedge was formulated and formed on the 4-hour chart, along with a bearish divergence developing on the RSI and decreasing histogram from the MACD. Once the lower trend line was broken with a significant increase in volume, this confirmed that all signals were lining up for a very high probability.
In general, use a combination of signals to provide you with the ability to make a confident assessment of the market conditions. For example, you would not use your speedometer alone to determine whether or not you are safe to drive a vehicle; however, using all of the signals in combination will enable you to confidently assess whether you are safe to proceed.
Pattern recognition used along with indicators will provide you with the best opportunity for success in your trading. Maximise your success by utilising both methods.
Market Differences – How Rising Wedge Behaves in Forex, Stocks, and Crypto
Across all different market sectors, the rising wedge pattern can be found. However, its behaviour differs completely across the various asset classes. Let's look at forex, stocks, and crypto.
Forex:
Due to the high liquidity and volatility of the forex (foreign exchange) market, rising wedge formations can emerge and be resolved quickly. Oftentimes, we see rising wedges in lower time frames (1-Hour Chart and 4 Hour Chart). Since the forex market operates 24/7, these patterns can break out at any time daily. Rising wedge formations tend to hold up and be valid in the forex markets; however, due to scheduled news releases and announcements made by central banks, false breakouts are not uncommon.
Stocks:
Stock markets tend to be slower and move more methodically. It generally takes weeks or months for a rising wedge formation to fully form on the daily chart for a stock. Therefore, the reliability factor of stock trading is generally much higher than crypto as there is less "noise" and speculation occurring in the stock markets. There are also fewer players involved in the stock markets compared to crypto markets; therefore, institutional buying & selling patterns create a more EMPT (ideal) chart structure to trade.
Crypto:
Trading crypto is a very risky venture, as it is currently like the "wild west" of the financial world. The looming threat of being liquidated during times of heightened volatility from excessive leverage bought on by retail-driven buyers, along with the 24/7 availability to trade, is an all too common occurrence. Therefore, we see frequent occurrences of false breakouts on crypto rising wedges. Thus, when trading crypto rising wedges, traders should use significantly tighter stop loss orders along with proper preparation for potential whipsaw price action.
CFD's:
Contracts for Difference are a very useful tool for traders looking at rising wedges among the various asset classes, as CFDs allow traders the ability to trade rising wedge formations from a variety of different asset classes using leverage. CFDs have a low barrier to entry, making it easy for traders to simulate and test out strategies; however, leverage will multiply both profits and losses.
Here's a quick comparison:
-
Liquidity: Forex > Stocks > Crypto
-
Volatility: Crypto > Forex > Stocks
-
Signal Reliability: Stocks > Forex > Crypto
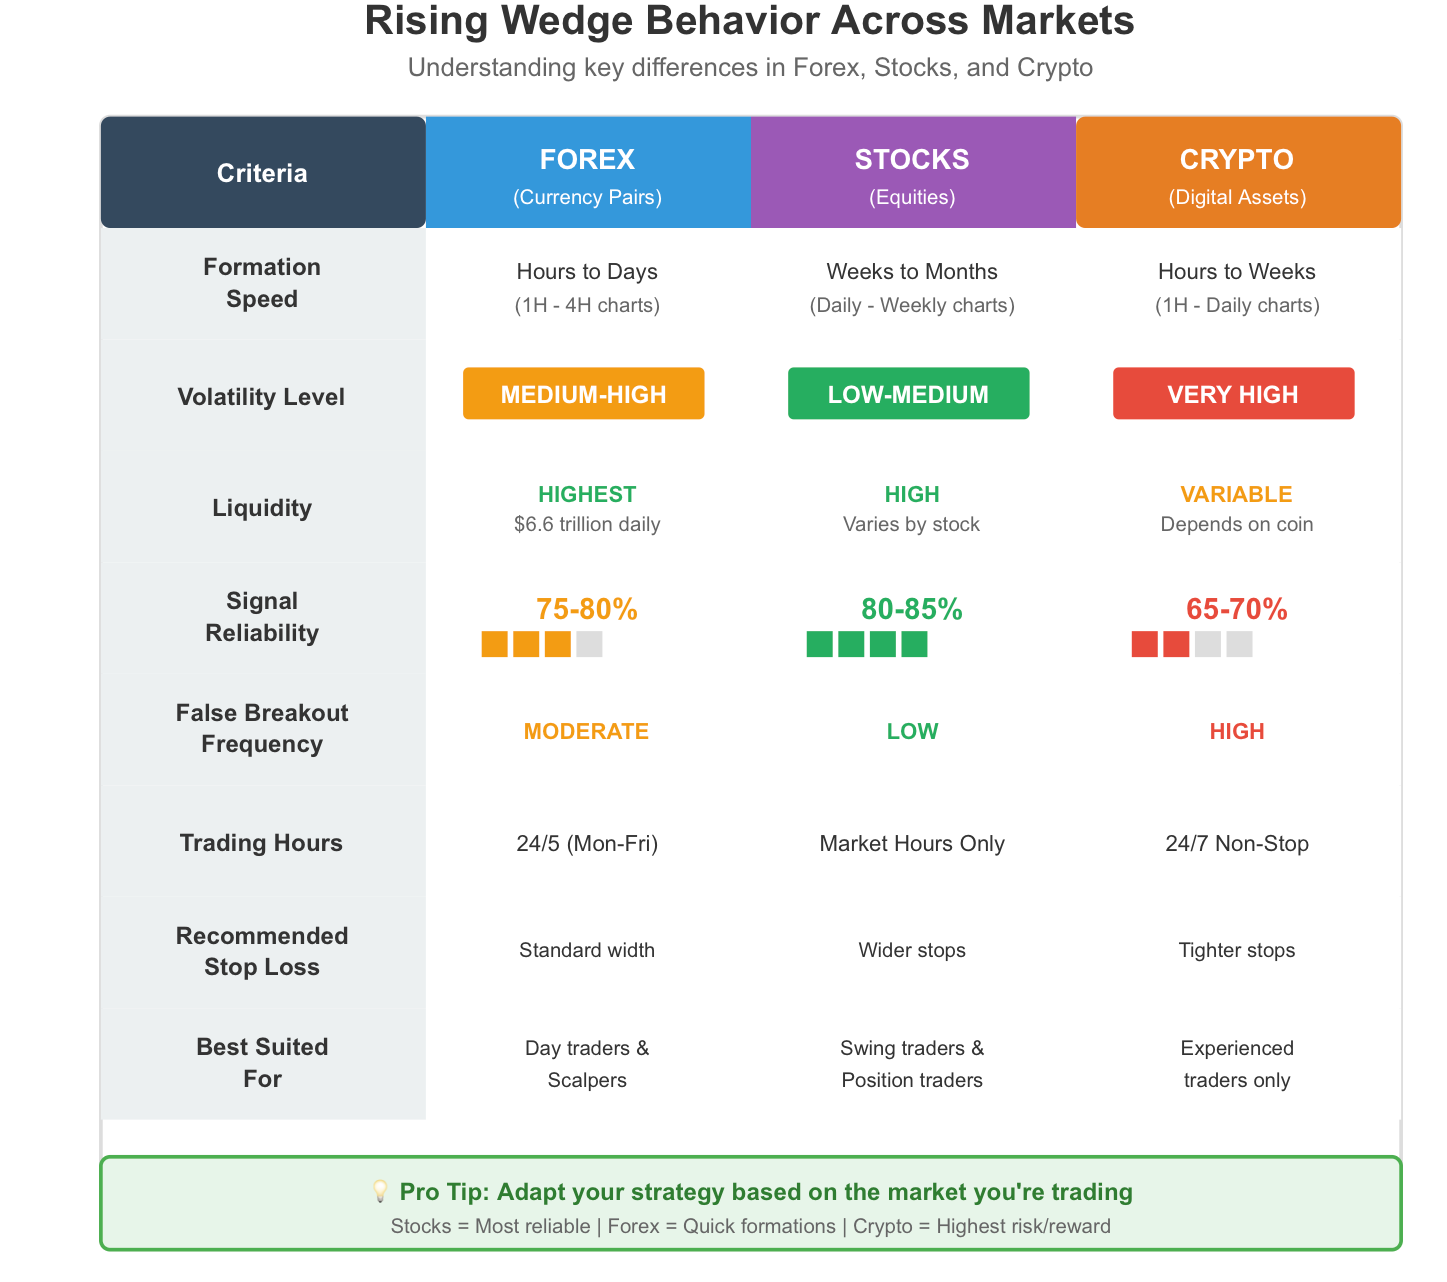
Adjust your strategy based on the market you're trading. Tighter stops in crypto, wider targets in stocks, and quick entries in forex.
Who Should Trade the Rising Wedge Pattern?
Rising wedges are not appropriate for every type of trader. Let’s determine if the rising wedge pattern is suitable for your approach to trading.
Day traders vs swing traders
Day traders typically focus on shorter-term time frames, such as the 15-minute or 1-hour charts. Day traders may use rising wedges for quick scalp opportunities. Day trades are executed in a matter of minutes, and the average holding period for each trade is a matter of hours or less.
In contrast, swing traders look to identify rising wedges in daily and weekly charts. Swing traders typically wait for a pattern to fully form before entering a trade, and they often have much better historical performance records than day traders.
Risk tolerance
The final consideration when determining your suitability for using rising wedges is your risk tolerance. For traders who use high leverage, they risk experiencing greater volatility as a result of an explosive price move when a rising wedge breaks out, making them susceptible to being stopped out on false flags. Conversely, conservative traders should utilise lower leverage and apply wider stop-loss levels.
Trading style
Aggressive traders can take advantage of rising wedges by entering earlier in the pattern with a larger position size, although they must be prepared to take more frequent losses than conservative traders.
As a swing trader, an example of using rising wedges would be identifying one in the S&P 500 weekly chart and waiting until the breakout confirmation occurred, entering with a small trade size, and holding for a period of weeks or months. After about four to eight weeks of holding this type of trade, you can expect to receive a decent return.
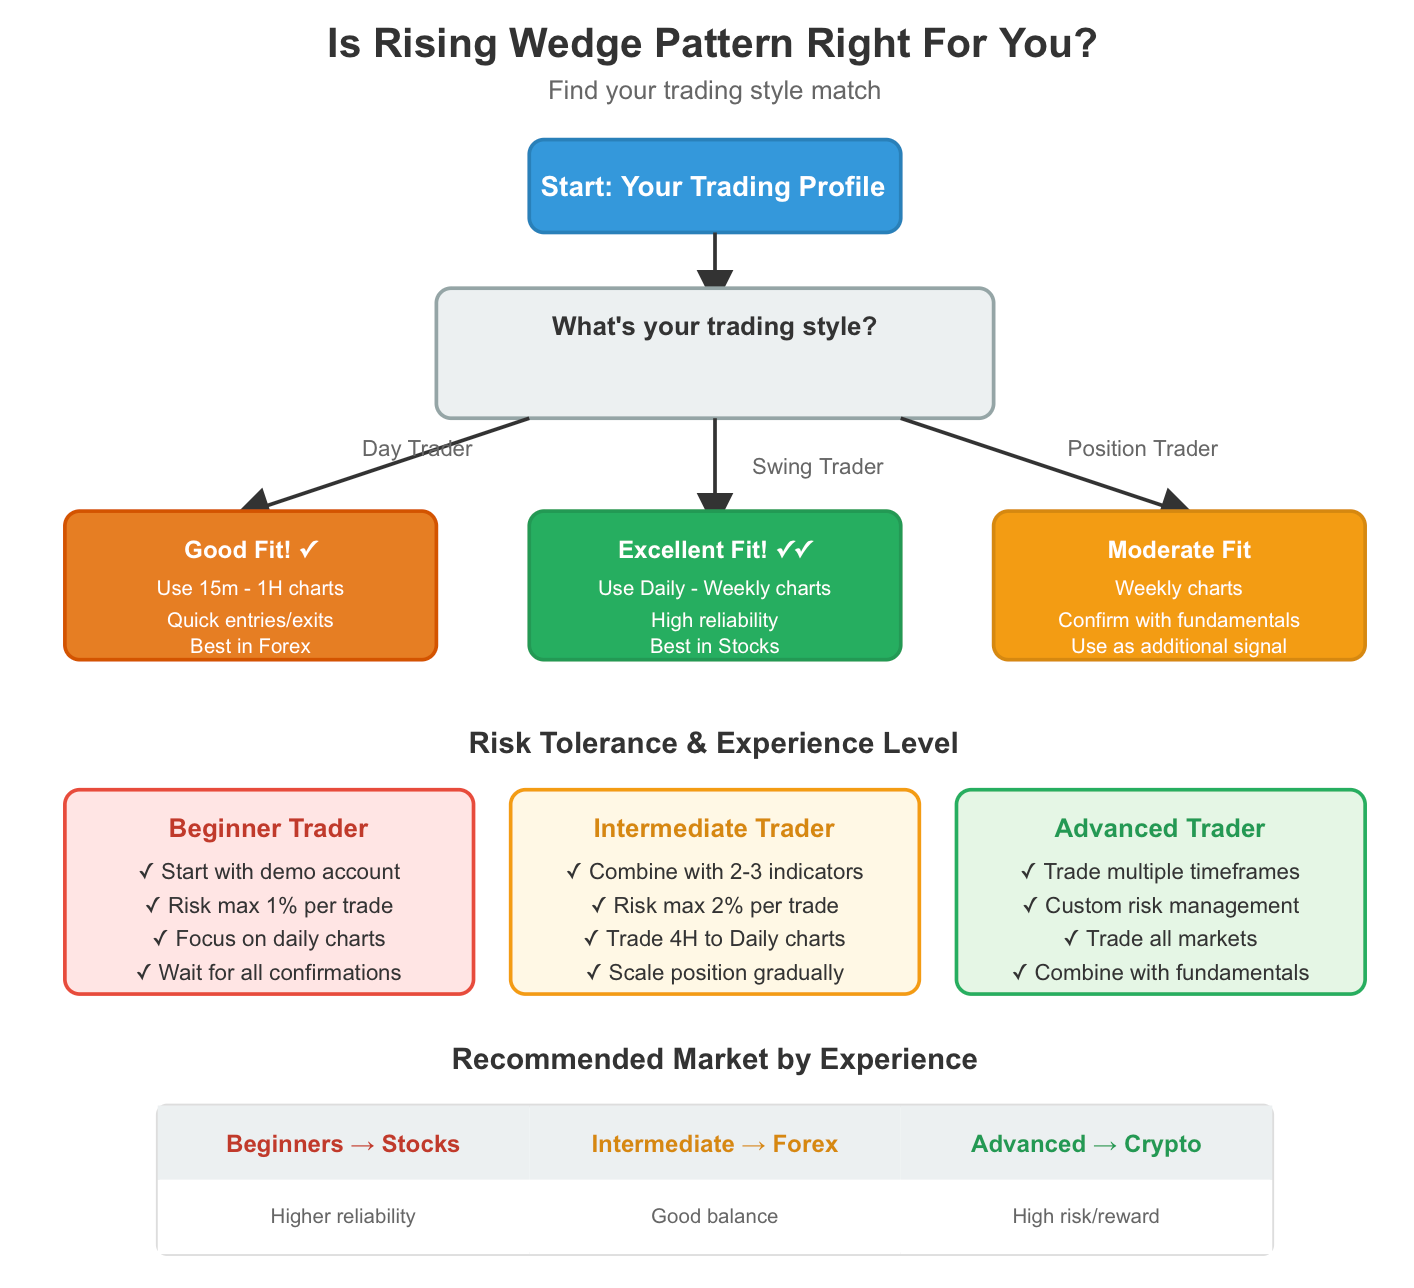
A good approach for a new trader is to first practice using a demo account, identifying rising wedges, placing trades, and developing risk management skills without risking any real money. Once you've developed a profitable trading record on the demo account, transfer to a live account, but start with a small position size.
Summary and Next Steps
The rising wedge indicates bullish momentum is decreasing and indicates a reversal is likely, but confirmation is needed before you can take any action. Draw the rising wedge carefully, wait for confirmation of the breakout and always manage your risk.
Rising wedging patterns are created when the price makes a series of higher lows and higher highs, while the two trend lines converge towards each other. Rising wedge patterns should typically be accompanied by decreasing volume and have divergences between momentum indicators (such as RSI and MACD). When the price breaks below the lower trend line on increased volume, this is the signal to look for the potential of opening a short position.
To practice identifying and trading rising wedge patterns, open a demo account with Tradewill, use Tradewill's trading platform to superimpose RSI, MACD, and Volume indicators on top of your charts, find rising wedges across all timeframes and asset classes, place small trades with low position sizes and track your results.
Ready to apply what you have learned? Sign up for a free demo account with Tradewill and start learning to trade rising wedges in a live market environment - no risk, real knowledge.
Disclaimer: The content of the blog does not represent any position of Trade W, does not serve as any trading-related decision advice, and does not endorse any third-party.