

 Trade W

Why the Shark Pattern Deserves Your Attention
Most traders are familiar with the Gartley pattern, some learn about the Bat pattern, but few know how to identify the Shark pattern. For this reason, understanding the Shark pattern is very important.
The basis of harmonic trading is the assumption that the price movement is not random. Traders who can identify specific Fibonacci ratios will see these ratios repeat at key turning points over time. This allows those traders to enter a trade prior to the majority of other traders entering that same trade when the pattern completes.
Patterns such as the Gartley, Bat and Butterfly patterns are well-known patterns and are characterised by their own unique retracement and extension ratios within the pattern. In contrast, the Shark pattern is an "extreme" pattern based on the principle of price extension to the downside from an initial swing low and the price retracing back to the swing high after reaching the maximum extension measured from the swing low.
A Shark pattern is identified after the market has experienced a dramatic market overshoot, i.e., pulling in late trades and having their stops taken out by a strong market reversal.
Typically, the volatility is not very high when a Shark pattern forms, therefore creating a lower number of Sharks to trade. In the current market environment of 2025-2026, where both cryptocurrencies and macroeconomic data are regularly creating volatility and then quickly reversing, there are likely to be multiple opportunities to plan trades based on the Shark pattern.
This guide contains detailed step-by-step procedures for how to identify the Shark pattern, what the exact Fibonacci criteria are for the Shark pattern, how they relate to the other patterns, and finally, the specific plan for how to approach the Shark pattern according to the criteria specified in this guide. The methodology can be applied regardless of whether you are trading in BTC, EUR/USD, or IndexCFDs.
What Is the Shark Pattern?
A five-point pattern known as the Shark is considered to be a strong indicator of reversal at the end of an extreme price movement. In comparison to the Bat and the Gartley, which have a C point within the standard retracement range, Shark has its C point fall within the 1.13 to 1.618 level of the O-X leg, thus pushing price into extreme overbought or oversold conditions.
The extreme overshoot from the C point causes an increase in institutional selling pressure and initiates a rapid reversal, making C the primary entry point to trade the Shark pattern. The Shark is a scalable pattern and can be used for any asset class in forex, crypto, or commodities; however, it has shown to have the greatest success in highly volatile market environments, as they tend to have more liquidity sweeps.
The O-X-A-B-C Structure
To be able to successfully trade Shark patterns, you need to be able to plot them without second-guessing your interpretation of the five key lines that define the Shark. If you do not correctly plot even one of these lines, the Shark analysis will be inaccurate.
The O point is the origin of the Shark pattern, and it is the origin point at which the four other points are all calculated. O is typically a substantial swing high or swing low and typically represents the termination point of the previous trend.
The X point is the first definitive thrust away from the O point. This line establishes the direction in which the primary thrust has occurred and establishes the starting or zero-point used in the Fibonacci measurements that will be determined subsequently.
The A point is the initial retracement of the O-X thrust. In a bullish Shark pattern, A will be below X, and the ratio of the A point from X towards O should be between 1.13 and 1.618 times the distance of the O-X line. At this point, there is divergence from the Gartley. The Gartley requires a much shallower retracement.
The B point is the correction or retracement from the A point. The B point should be located between the 1.618 and 2.24 Fibonacci extension of the A point. If the B point is not between the 1.618 and 2.24 Fibonacci extension, then you are likely looking at a different structural formation.
The C point is the point you will be trading. C will be located at the 0.886 Fibonacci retracement of the O-X line, and C will also be located at the 1.13 Fibonacci extension of the O-X line. C is the point at which maximum euphoria or maximum fear exists in the market, and that is why you can trade it.
It's an easy comparison for new traders to make a common mistake. In the Bat, the D point is equivalent to the X-A 0.886 retracement; in the Shark, the C point is located at the 1.13 extension of the O-X line. Trading C requires identifying significantly larger market reversals than trading D.
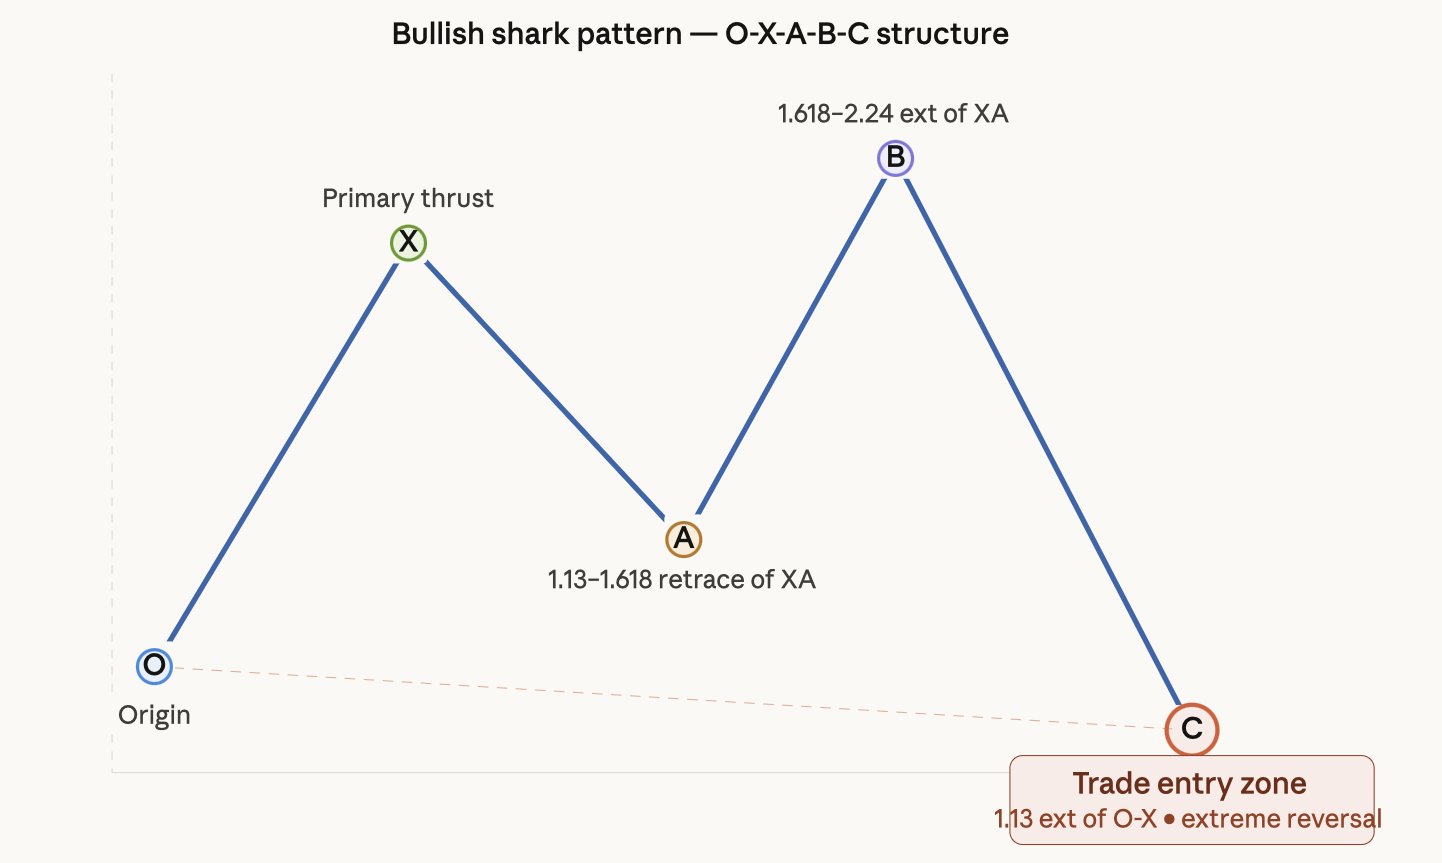
Common mistakes made when trying to identify points A and B are due to mislabeling them as point A or B because traders "think" point A has completed due to shallow retracements occurring then. Measuring Fibonacci from the wrong anchor point is another error traders can make when identifying extensions. Extensions must be measured from an O-X point rather than from an X-A point.
Fibonacci Ratios – The Math Behind C Point
A Shark not only appear Extreme on the Chart, but it is defined by specific Numbers that can only separate a valid pattern from one that, although it may appear to be valid, is not.
The C point must fall between the 1.13 and the 1.618 Fibonacci Extensions derived from the O-X. If the C Point is below 1.13, then it has not stretched enough for the market to qualify as an existing extended pattern. Conversely, if the C Point is above 1.618, it is too extended to continue moving in a manner that is likely to produce a reversal pattern.
Why Is This Range Important?
1.13 is typically where the algorithms and Institutional Desks place limit orders in anticipation of an exhaustion level. When an instrument reaches the 1.618 Fibonacci Extension, the instrument is in a low liquidity environment, and therefore, even small Institutional Orders can change the direction of a market.
The greatest error that traders make here is placing Retracement levels rather than Extension levels. Retracement and Extension levels are two separate types of tools — a Retracement level measures the extent to which the price has pulled back after a swing move; an Extension level measures the extent to which the price has moved beyond a previous swing. The C Point is an extension that is derived from the Initial Price of the O-X leg.
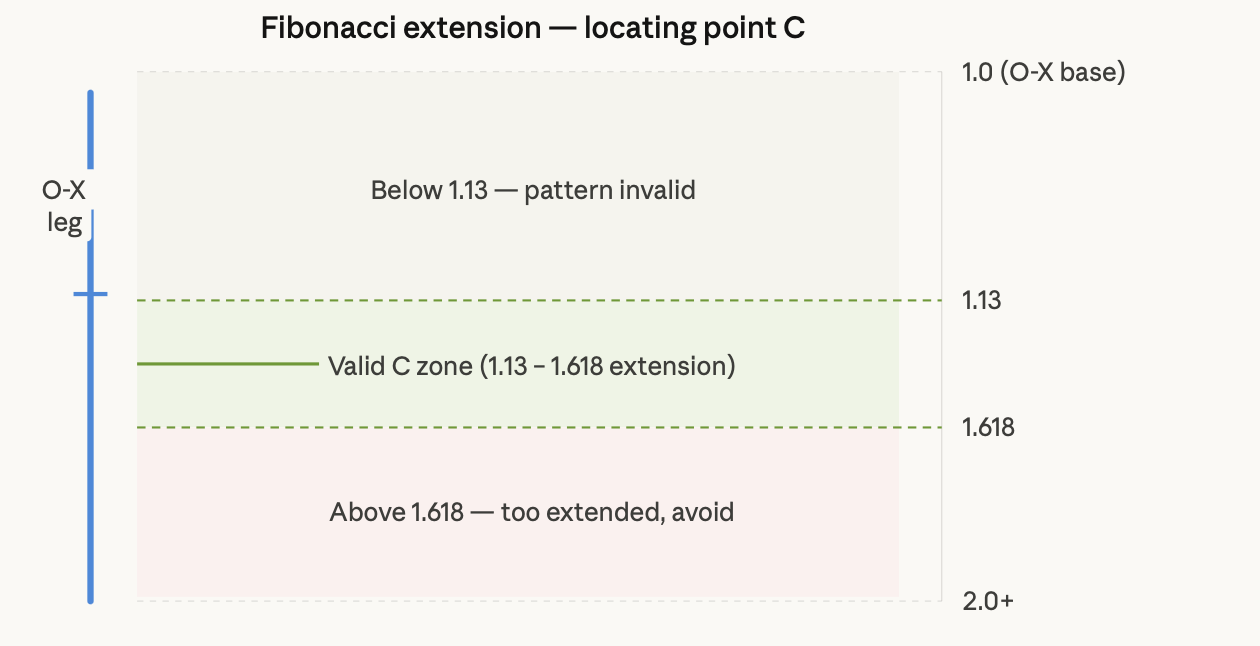
You can use the Fibonacci extension tool found on most platforms, including TradingView and MetaTrader, to create this look. You will set your anchor point (A) at O and your anchor point (B) at X, which creates the 1.13 and 1.618 forward projections for the currency pair. Once the currency pair comes in contact with that price zone and you have confirmed the previous A and B levels are at their respective prices, you will be at point C.
Market fluctuations are very real. Particularly in the crypto market, C typically touches closer to 1.618 due to the higher volatility and the tendency for currency pairs to overshoot their respective price levels. While in the forex market, more liquid currency pairs will have point C touch closer to the 1.13-1.272 zone. You should adjust your expectations accordingly.
Shark and the Other Harmonics
There is more to just naming the Shark than simply stylising the name to differentiate it from the other harmonics. If you get it wrong, you may treat a Bat for a Shark and enter the trade too early; as a result, the price will go through your stop and continue past the entry point until it reaches the price at which it was supposed to reverse.
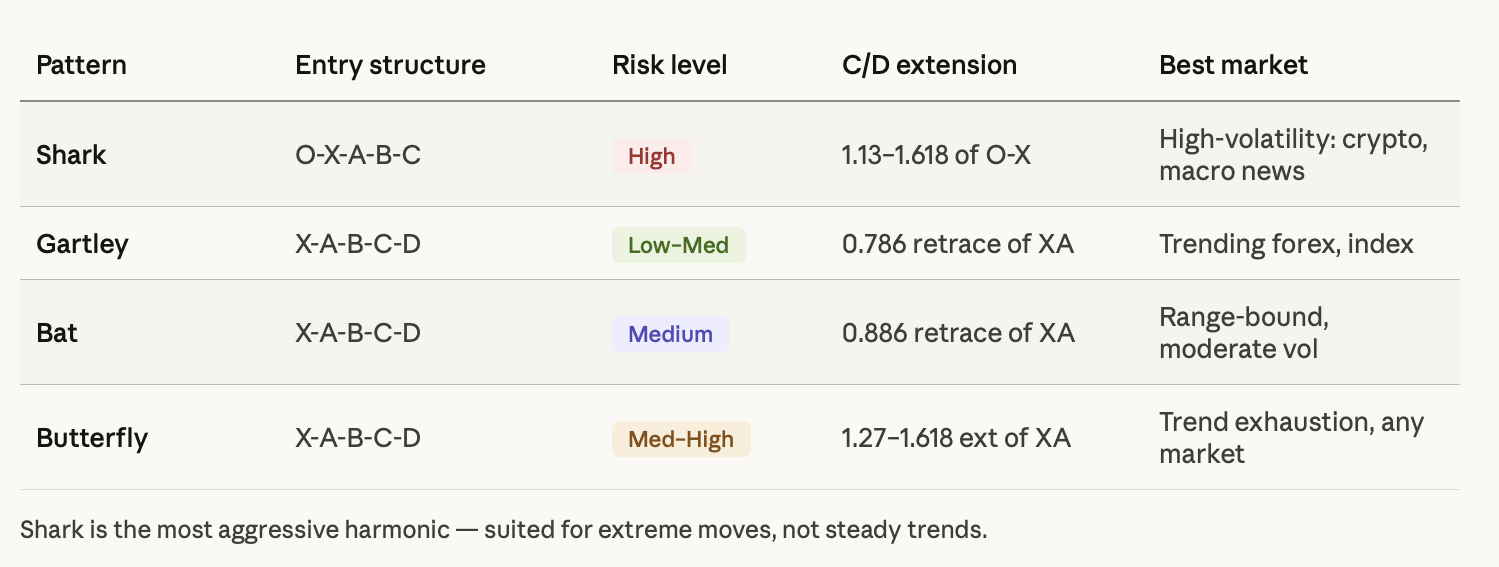
The major difference between Gartley & Bat setups and Shark setups in the marketplace is that they are formed within a proper trend and orderly marketplace, while the Shark wakes up in chaos; thus, if the marketplace is not experiencing upheaval, the Shark will likely not form.
If you are watching a coin that has moved by 15% in the last 24 hours or have a currency pair that has gapped due to an announcement from a central bank, this is the time to begin searching for the Shark.
Mental Components That Help Create a Shark
Sharks do not create themselves. Sharks are created by humans and institutions engaging in predictable behaviours under duress.
Typically, there is a specific series of circumstances that occur prior to the price reaching the “C” zone of the Shark pattern. It begins with a strong long-term directional movement that has resulted in an influx of retail traders entering the market, which creates FOMO (Fear of Missing Out), whereby retail traders enter late near the price peak (i.e. on a bearish Shark), operating under the premise that the price of the asset will continue in the same direction; therefore, they set their Stop Loss orders just above the most recent swing high.
Institutions are aware of this activity and, instead of battling the group of retail traders, will advance the price of the asset slightly higher into the “C” Zone, causing the Stop Loss orders of the retail traders to be triggered, thus creating an immediate and pronounced spike in price; this action is referred to as a “liquidity sweep”.
Once the retail traders have experienced their Stop Loss being executed, and the panic of the retail trader has subsided, the institutions will reverse their position in the opposite direction and with large volume, this reversal of position is what the Shark is designed to capture.
Taking into consideration the preceding statement, false breakouts are common in the “C” Zone; therefore, the price of the asset may cross a key price level and immediately reverse. A breakdown in the trend would typically indicate failure of the trade. A breakout from this type of trade indicates that liquidity was hunted.
Shark Trade Analysis Process
Now it is time to take action. It is important to follow the order of operations; do not skip steps.
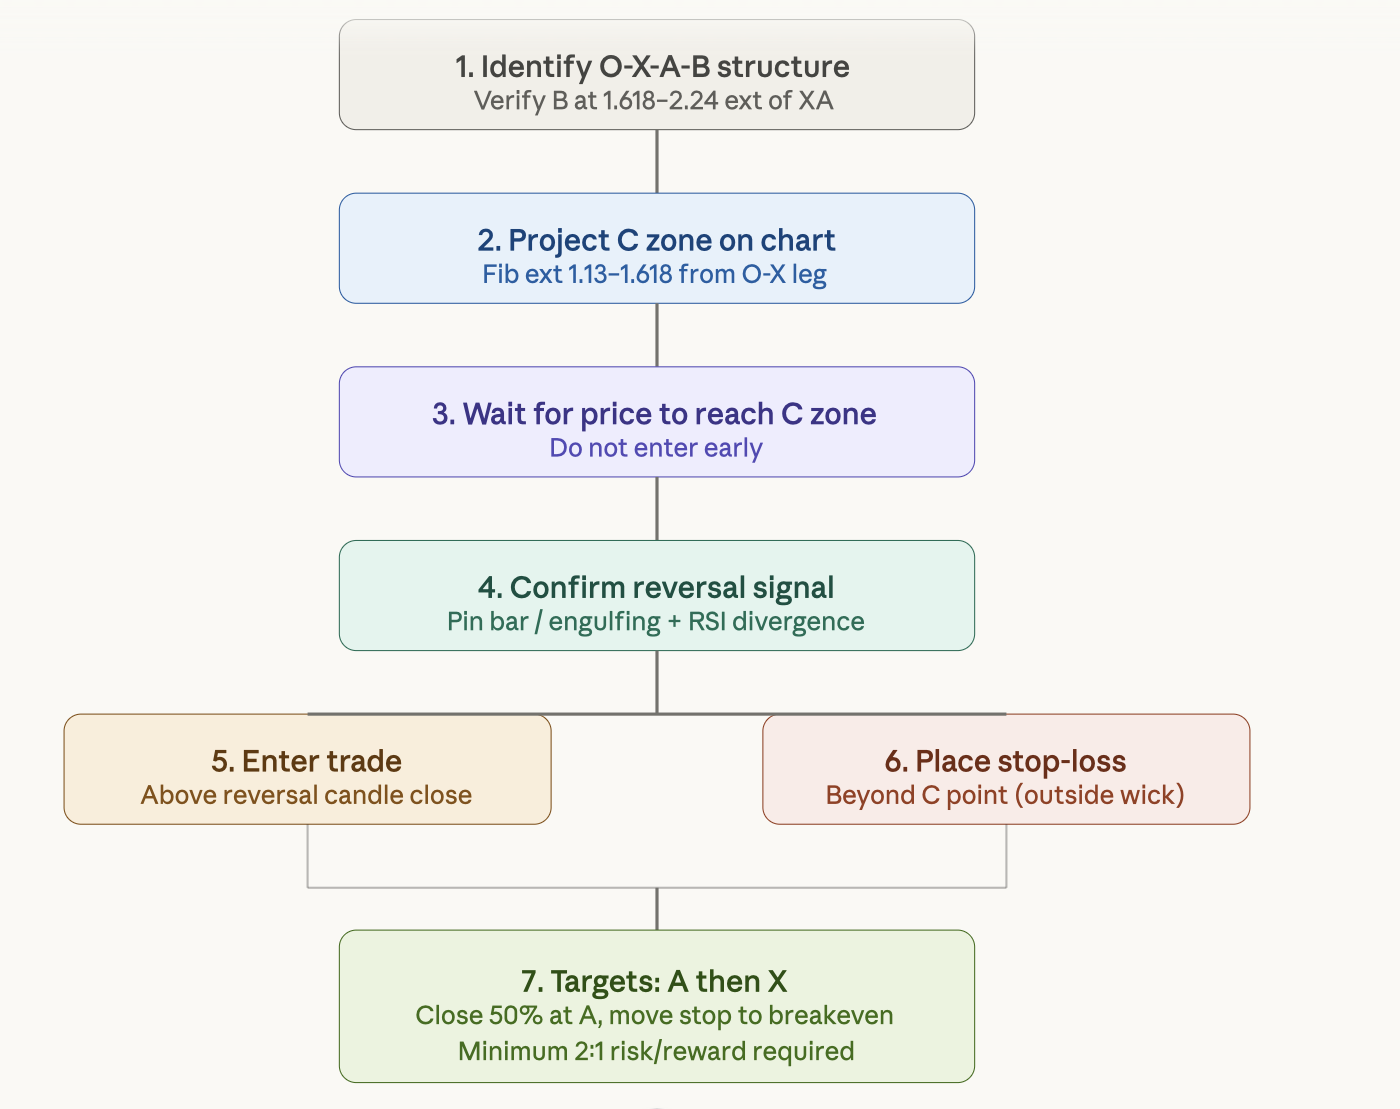
Identify the Pattern Structure: Before anything else, confirm the points O and X and A and B on your chart. For a valid Shark, point B must be between 1.618 and 2.24 times the X and A leg.
Define Your C Zone: Draw a Fibonacci extension from O to X and mark the 1.13 and 1.618 levels with the horizontal line. This is your entry area for the trade.
C Zone Must be Hit by Price: Price must hit the C zone before you can trade. Do not anticipate the price hitting the C zone.
Watch for Reversal Signal: There are several ways to trade the C zone once price hits it, including a candlestick pattern, pin bar, engulfing candle, and wick rejection or RSI divergence on either a 4H chart or daily chart.
Enter the Trade: When the price has tested the C zone, and you have a reversal signal on your chart, buy at the close above the reversal candle for a bullish Shark trade or sell at the close below the reversal candle for a bearish Shark trade.
Set Your Stop: For bullish Shark setups, you will set your stop loss below point C; for bearish setups, above point C. An error that traders make in the C pattern is to put the stop too close to C, resulting in being caught in the rebound pull of the price.
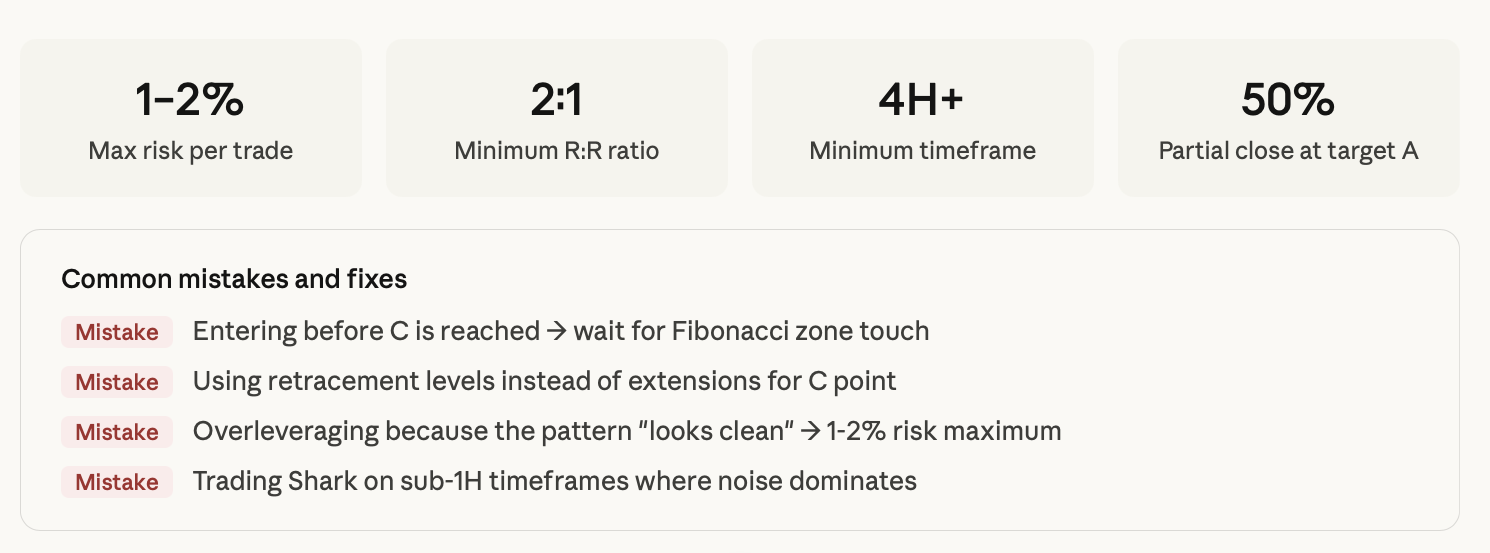
Set Your Targets: Depending on your trading plan, you can take profit at point A or point X. If you take partial profits, you would exit 50% of your position at point A and move your stop to a breakeven level to let the rest run to point X.
Calculate R/R Ratio Before Entering: Determine your risk as the distance from the entry to the stop. Define your minimum reward as the distance between your entry and point A. Before making any trade, target at least a 2:1 ratio on the risk-to-reward.
Multi-Timeframe Confirmation:
By trading the Shark pattern on a 15-minute chart and not taking into account any higher time frames, you are at risk of taking trades that may look good in isolation, but in reality have a high probability of failing due to the higher time frames showing opposite trends.
The basic rule to follow is to confirm that a compatible pattern is present on a higher time frame before confirming your entry point on the lower time frame. For example, if the daily chart shows that a Shark pattern is completing at the C level and the 4-hour chart also shows a divergence on the RSI at the same point, then you have a strong case for taking your trade.
Volume is your secondary verification step. The last push to the C level for a valid Shark pattern should show a decrease in volume, while the reversal candle should show a significant increase in volume. If you see volume increasing into the C level, it's possible that there may still be some potential upside for the price to move higher, so wait for the confirmation to occur.
Do not only trade the Shark pattern on time frames below 1 hour. While it does create patterns, the noise-to-signal ratio is reduced, and consequently, the Fibonacci levels will not provide an accurate representation of where institutional order banks are located.
Risk Management and the Mistakes That Cost Traders:
Recognising patterns without having proper risk management is essentially just adding additional steps prior to placing a trade.
The majority of traders make the following mistakes when trading the Shark:
Entering the trade before confirming the C zone. It may seem easy to identify the C zone after the fact, but while it is approaching, there is a natural tendency to enter the trade prior to the price having reached the C zone. If you do this, then you take away your edge, and all the probabilities of the pattern are based on whether or not the extension is completed.
Skipping the Fibonacci level confirmation. If you are simply "eyeballing" the structure without checking the extensions for confirmation, then you are not trading the Shark, and more than likely, you are trading something else that resembles a pattern that has a much lower completion rate.
Over-leveraging your accounts. The Shark pattern has a very high-risk/reward ratio and requires precise money management in terms of proper position sizes and not using large leverage. The vast majority of traders should risk no more than 1% - 2% of their total capital on any single trade. This is particularly true for crypto, where there can be large price swings at the C zone; therefore, building in a "buffer" on stop-loss levels is crucial.
No stop-loss. There are some traders who have convinced themselves that the set-up is too good to require one. The market does not care!
Shark Pattern: Different Markets, Same Structure
Fibonacci ratios and shark structures work in exactly the same way regardless of which market you’re in. The way they’re used does, however, vary across markets.
Cryptocurrency (Bitcoin, Ethereum): The cryptocurrency market as a whole regularly produces extreme velocity, or very fast price movements, and therefore tends to see the shark pattern most frequently. Both Bitcoin and Ethereum have created textbook examples of sharks at multiple macro levels of support and resistance.
Additionally, when there’s a sharp liquidation in the price of Ethereum, it has created an extreme (C) zone entry point where one can place a trade. Most importantly, volatility in this market requires the use of wider-than-normal stops than other markets due to its erratic behaviour.
Forex (EUR/USD, GBP/USD): The Forex market produces smaller quantities of sharks than cryptocurrencies; however, the sharks that do appear are most often very clean. Major news releases and events such as NFP reports, CPI releases, and FOMC announcements typically will overshoot and create a shark C point. The most reliable charts for finding these sharks are at the 4-hour and daily timeframes; however, smaller-than-normal stops are used due to lower volatility than the cryptocurrency market.
Index CFDs: The shark pattern typically appears during earnings season or around the time of central bank monetary policy decisions. During periods of volatility caused by central bank interest-rate decisions, the S&P500 and DAX indices have produced numerous shark patterns.
Commodities: Gold typically forms a shark pattern during periods of geopolitical instability when price movements have exceeded the expected technical structure and then reverse direction.
Shark Patterns in the 2026 Market Environment
This market is an ideal environment for the shark pattern due to macroeconomic uncertainty, AI-driven capital rotations, geopolitical tension and ongoing adoption cycles of cryptocurrencies by traders. Other macroeconomic factors create sharp price movements caused by emotions, creating the best conditions to exploit the shark pattern.
Throughout 2025, Bitcoin’s price patterns were characterised by repeated liquidity sweeps followed by an immediate, sharp price reversals – textbook conditions for creating shark patterns. Many alternative cryptocurrencies, with their small liquidity pools, provided even more extreme C-zone entry points.
As a result of continued divergence in the Fed, ECB and Bank of Japan’s monetary policy stances, there are still many 200-400 pip price movements in rate-sensitive currency pairs that will continue to create fast-moving conditions conducive to forming shark patterns.
The practical takeaway from the information above is: In 2026, all trend-trading traders will miss out on an entire category of high probability trades because they will not have been able to catch the beginning of a trend. In other words, when the economy is continually shifting in a new direction (i.e., macroeconomic developments), there will be multiple reversal points where an opportunity exists to trade successfully.
Conclusion
The shark pattern is not for everyone. People need to be very disciplined in executing their Fibonacci work precisely, and they must have the patience to wait for the price action of the C-point to reverse before entering the trade. However, once a trader develops the skill required to execute the pattern correctly, it provides an opportunity to enter near the peak of a given momentum move before the majority of the price reversion has occurred.
In terms of a trader’s framework for constructing a trading strategy using the shark pattern: Identify O-X-A-B structure; project the 113%-161.8% C-zone price point; wait for price to reach the C-zone and produce an indication of reversal; place the trade with a defined stop; and target either point A first, or both A and B. Combine multi-timeframe confirming signals and proper position sizing to produce a complete trading plan.
Recognising a pattern is the first step in developing a successful trading strategy. Risk management is the major component of surviving long enough to profit from a successful trading strategy.
FAQ
Is the Shark pattern reliable? It's one of the higher-probability harmonic setups, but no pattern works without proper Fibonacci confirmation and risk management. Verified C-zone completions with RSI divergence have strong historical accuracy.
Which timeframe works best? 4H and daily are optimal. Patterns on lower timeframes exist but carry more noise and lower reliability.
Can beginners use it? With practice, yes. But learn Fibonacci extension drawing and basic harmonic structure first. Paper trading Shark setups for 4-6 weeks before committing real capital is worth the time.
Is it suitable for crypto? Yes, and crypto might be the best market for it. The volatility produces frequent, clear Shark formations.
What is the success rate? Studies on harmonic patterns suggest 60-70% win rates when Fibonacci rules are strictly followed. The Shark specifically benefits from tight structural rules.
What indicators help confirm? RSI divergence at C is the most reliable. Volume decline into C followed by a volume surge on the reversal candle is a strong secondary confirmation.
Is the Shark better than the Gartley? In volatile markets, yes. In steady trending markets, the Gartley is often cleaner. They're tools for different conditions.
Disclaimer: The content of the blog does not represent any position of Trade W, does not serve as any trading-related decision advice, and does not endorse any third-party.