

 Trade W
Why Understanding Stock & Index Adjustments is Crucial
If at any point, you have ever looked at a historical price chart for a stock and found periods of time where the stock price suddenly dropped without any news to correlate, you have encountered adjustments.
An adjustment or price correction is applied whenever companies make cash payments called dividends, stock splits, or participate in other corporate actions. The understanding of adjustments is more than technical knowledge. It is vitally important to anyone wanting to assess market data correctly.
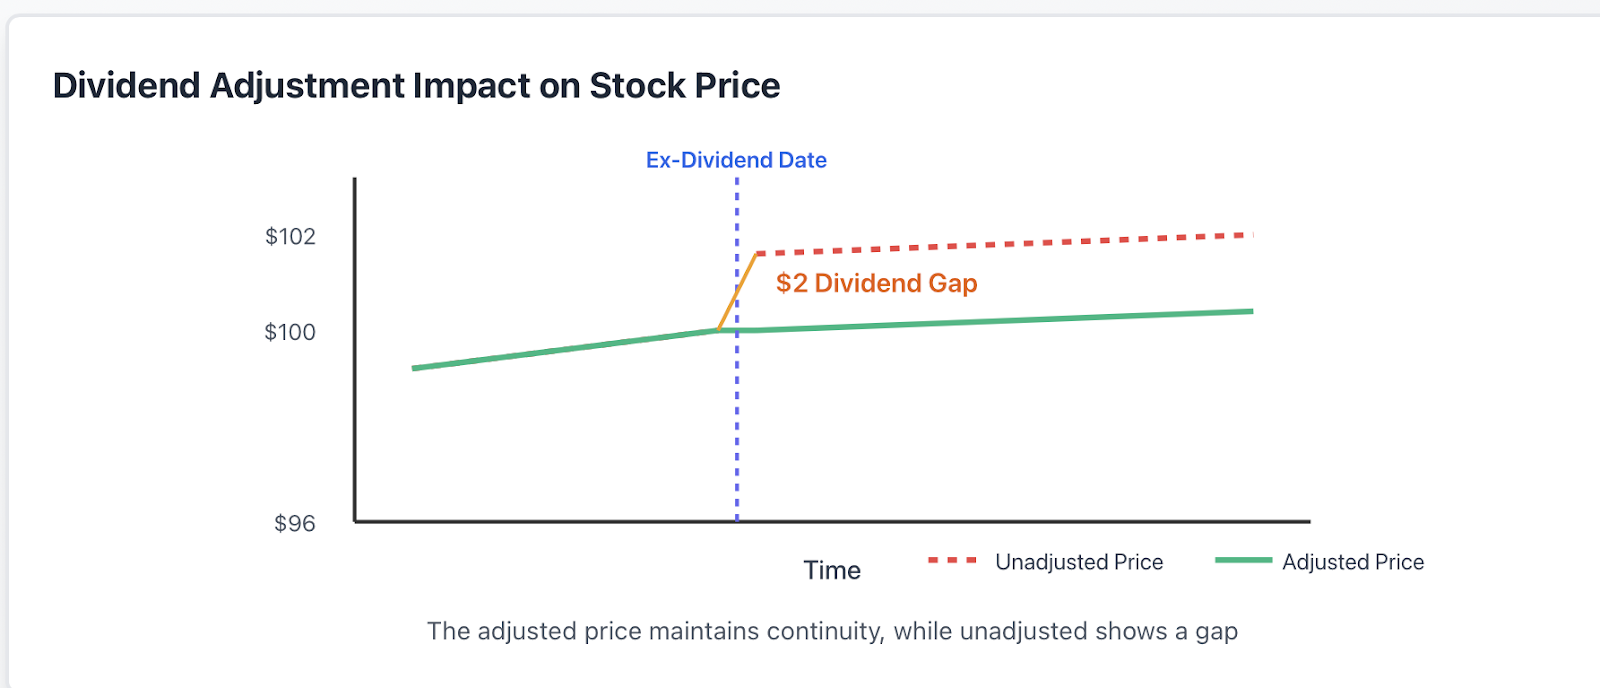
Another way to think of it. Suppose a company pays a $2 per share dividend. In that case, the share price automatically drops $2 on the ex-dividend date. Your total value has not changed. You still have the same value, just divided between stock price and cash received. It is the same as approaching a store and receiving a gift card to that store. Nothing has changed in terms of your spending power, but your method of holding it is different.
Traders are exposed to this idea constantly. Whenever the S&P 500 index is adjusted for the dividends and stock splits from various constituent companies, there is a need to make an adjustment to keep the index level continuous. Without any sort of adjustment to historical events, the historical performance of the market would appear to show news that would spur false spikes in volatility and misrepresentation of trends.
Over the years of capital market development, making adjustments has become a customary practice. Presently, most exchanges will adjust for you - the exchanges will take care of this for you. However, understanding this adjustment process is key. If you are either backtesting a trading strategy or determining returns on a portfolio, the adjustment inputs will dictate the accuracy of the outcome. If you skip this step, you run the risk of your entire analysis incorrectly representing the actual data.
Types of Stock & Index Adjustments You Must Know
Different types of corporate actions need to be handled in different manners. Let's explore the basic ones encountered by any trader.
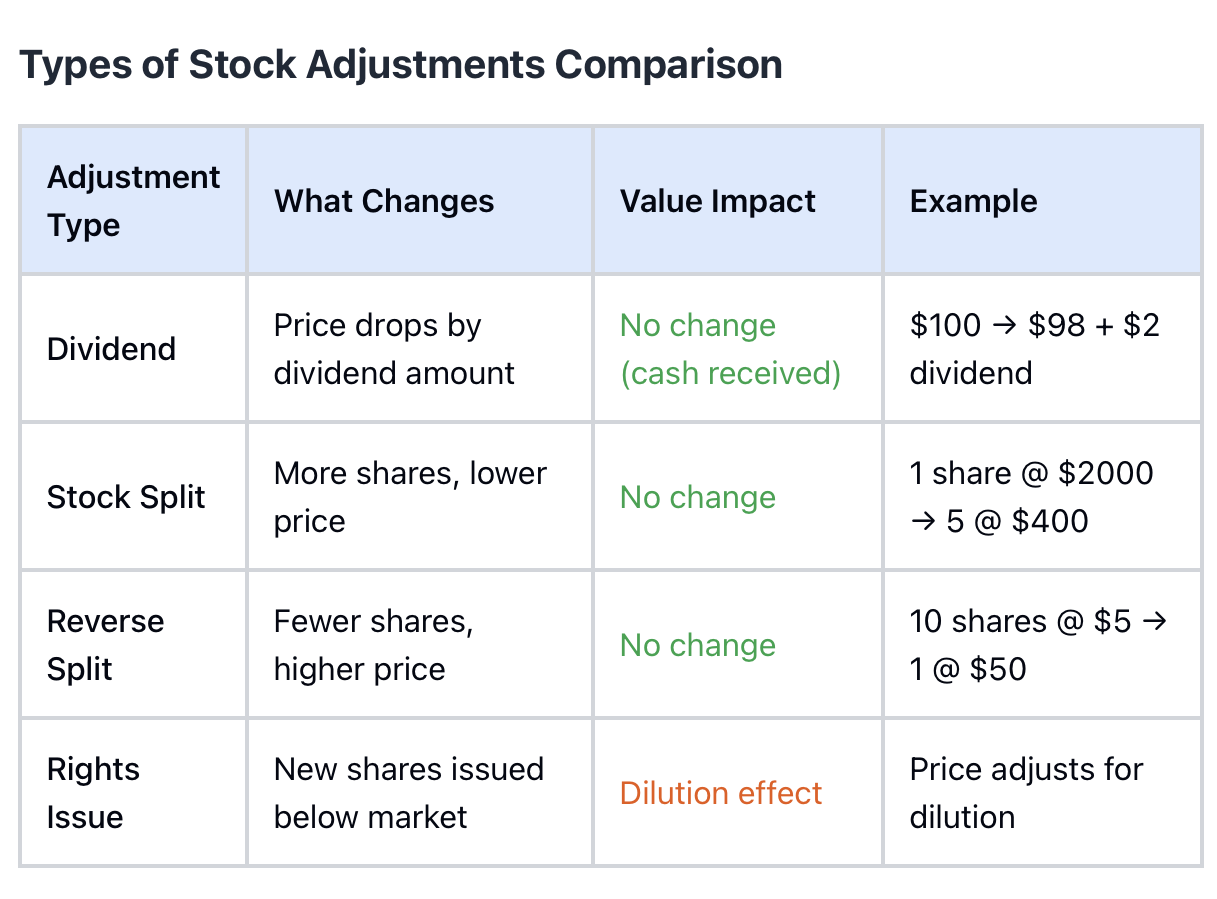
Dividend Adjustment: This adjustment occurs when a company makes a distribution of profits to shareholders. On the ex-dividend date, the stock price will adjust down by the dividend amount. Think about this like earning interest on your savings account. Your wealth, in total, has not changed, but now you have an account with some principal and some interest. Microsoft pays dividends on a routine basis, and every time they do, the price adjustments happen automatically, keeping the historical information intact.
Stock Splits and Reverse Stock Splits: This type of action changes the number of shares, but does not change the value of the company. In a stock split, one share is split into multiple shares at the same proportionally lower price. This is like cutting a cake into more slices. You still have the same cake, but it is cut into smaller pieces. Tesla's 2020 split was famous because it was a 5-for-1 split.
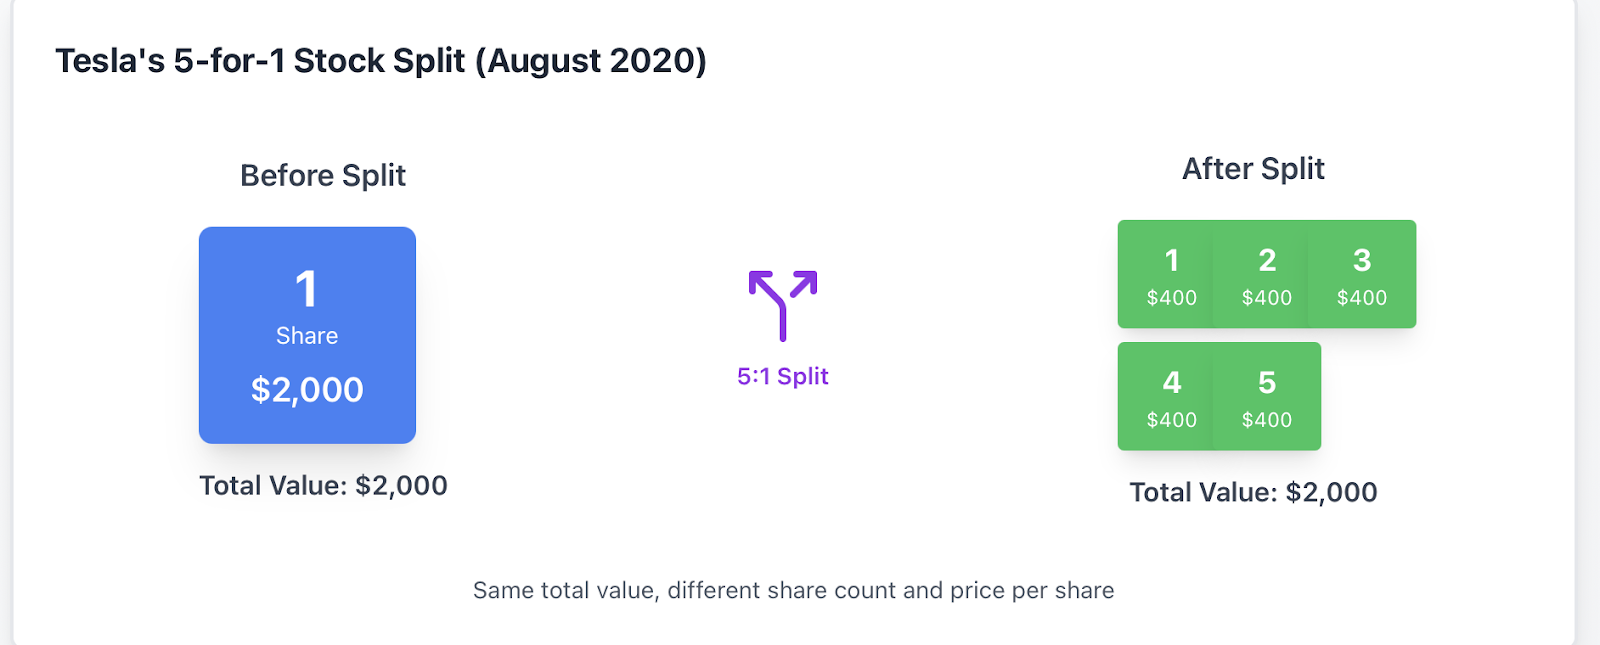
This means if a person had one share, they get 5 shares and also the price of each share divided by five. A reverse stock split means that multiple tradeable shares are combined into fewer shares and at a higher price.
Rights Issue Adjustments occur when companies issue new stock to current shareholders at a price that is below the stock’s market value. This dilutes the value of the stock and the price has to adjust. You can think of your whole class buying supplies as a group that are discounted. The individual contribution each one of you contributes to the total value of the purchases changes with discounts, but the overall value of the group does not change.
Index Adjustments maintain continuity when components in an index have splits, mergers or are delisted from the index. The S&P 500 will have ongoing adjustments due to corporate action across its 500 companies for accurate index levels over time.
One caveat for advanced traders: the adjustment methods may differ slightly from exchange to exchange and region to region.
Algorithmic trading systems and backtesting engines need to evaluate these differences on a regional basis to accurately process the data.
How Adjustments Affect Trading Strategies
Technical analysis relies entirely on historical price information. When using unadjusted data, the indicators might provide false signals. Support and resistance levels change. Moving averages can provide incorrect crossover signals. Trendlines can break where they shouldn't.
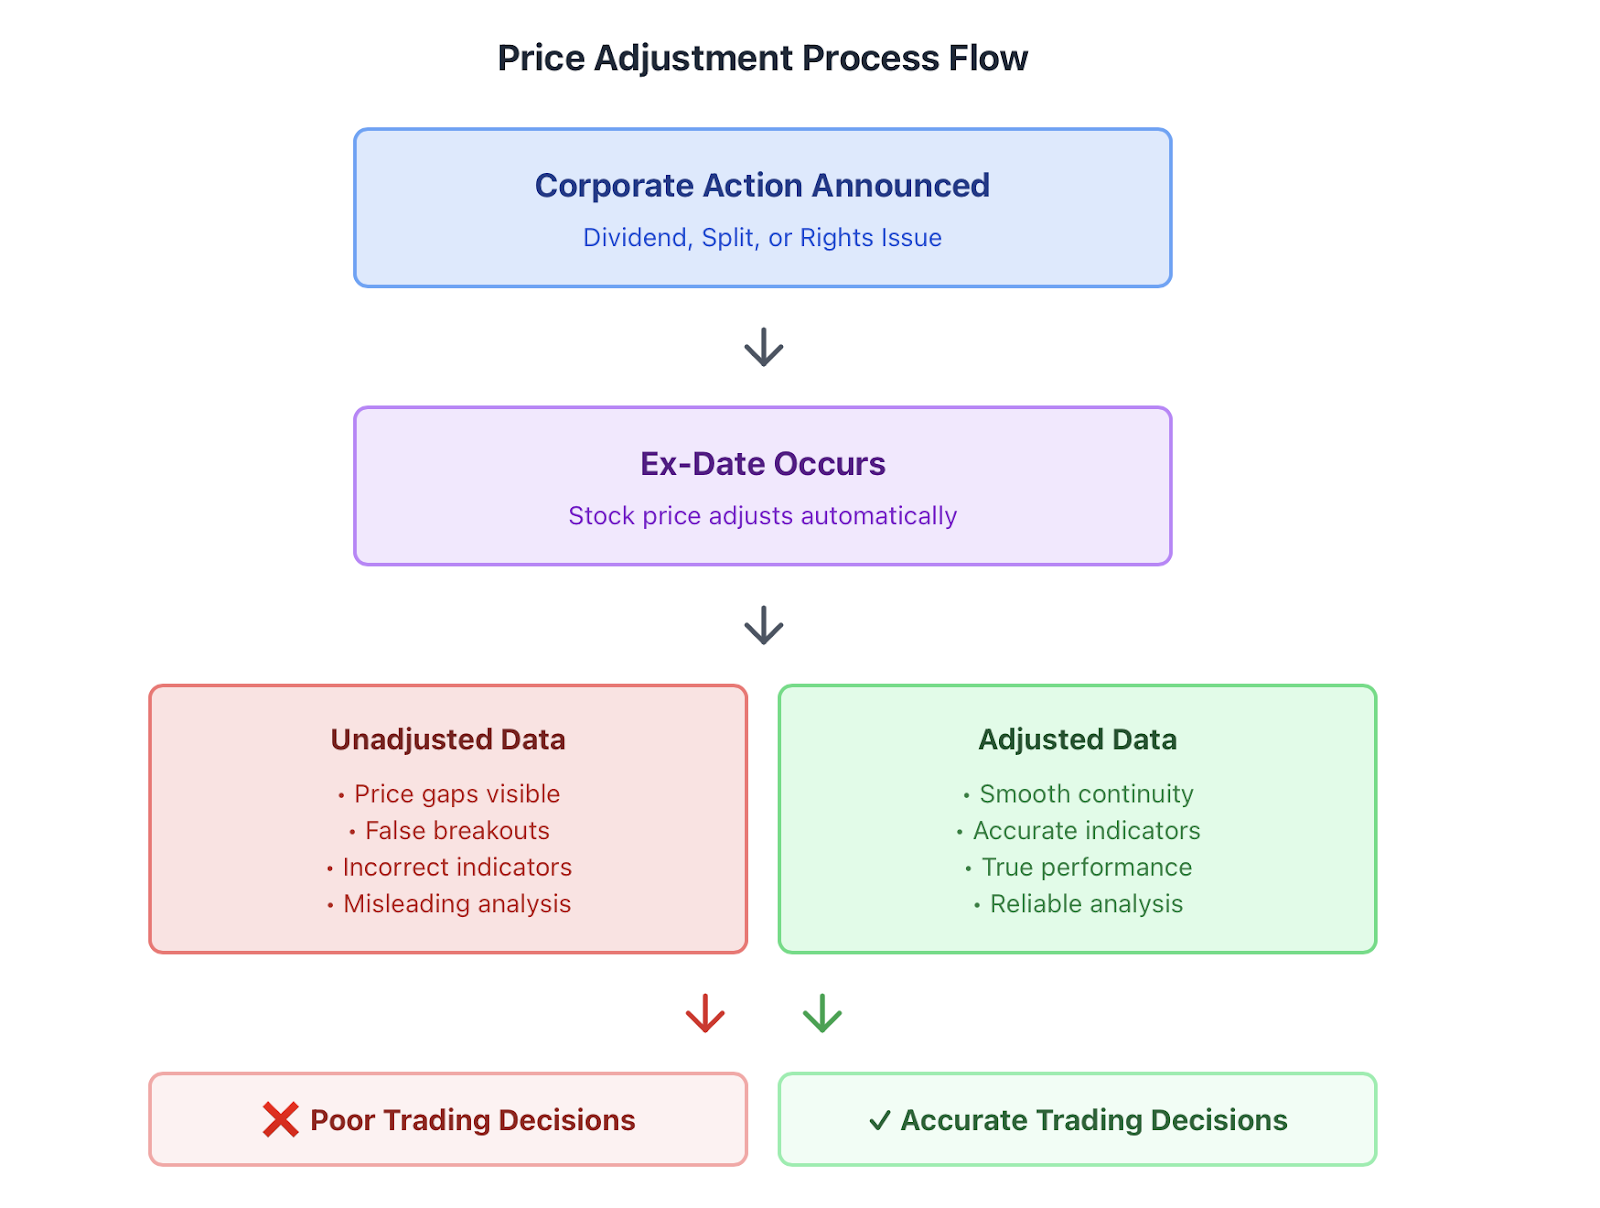
Take a basic example. If a teacher changes the exam score from a 100-point scale to a 90-point scale, you may change ranking, but the fact remains that your knowledge hasn't changed. Similarly, if when Apple's stock price is adjusted for a dividend, prices adjusted, but the fundamental value of the company has not changed
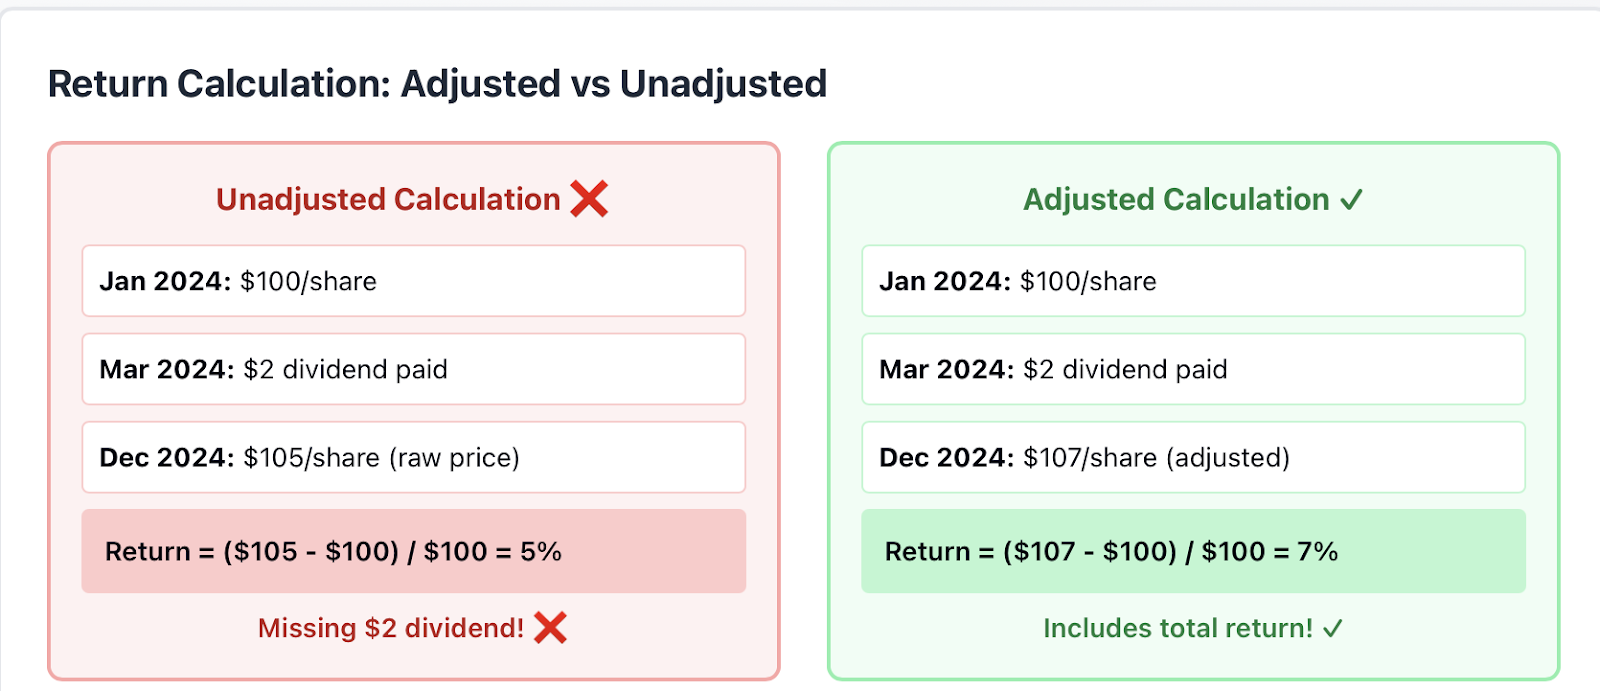
This is significant specifically at the back-testing level for professional traders. Imagine testing a trading strategy in the S&P 500 using unadjusted historical data. You could base an entire backtest on "buying" just prior to when the stock pays dividends with returns represented that in reality did not exist from your backtest. The strategy with this approach would likely fail spectacularly in live trading.
Different technical indicators have varying sensitivity to data that has different adjustment patterns. For example, moving averages, RSI, and Bollinger Bands all calculate from historical prices, thus an adjustment has direct impacts on those calculations. Similarly, an algorithmic trading system must also work with adjusted data often or it will find itself generating trades based on false prices and price movement.
Today’s average retail trading platform makes use of adjusted data automatically, preventing the most naive of errors for retail traders. However, when you move to deeper historical analysis or more customized backtesting, you will still want to make sure that your data source matches your adjustments in the proper way, which is just not something you have to worry about in most retail trading platforms.
Impact of Adjustments on Portfolio and Risk Management
Adjustments to readings are extremely important for portfolio and risk management. Portfolio calculations are based on accurate price readings, and whenever a stock adjusts due to a split, reverse-split, mergers, etc. the price reading will go down, but your total asset value is unchanged. However, the new stock price is adjusted for your position weights and allocating adjusted prices.
Consider holding a portfolio with equal weight in ten stocks, and then running into a situation where one stock has a 2-for-1 split. This stock's price is now half of what it used to be (disregarding the many other factors which impact a stock's price). If you calculate your portfolio weights using your raw prices rather than adjusted prices, you will think this position has decreased in weight when, in fact, it has not. The actual allocation does not change.
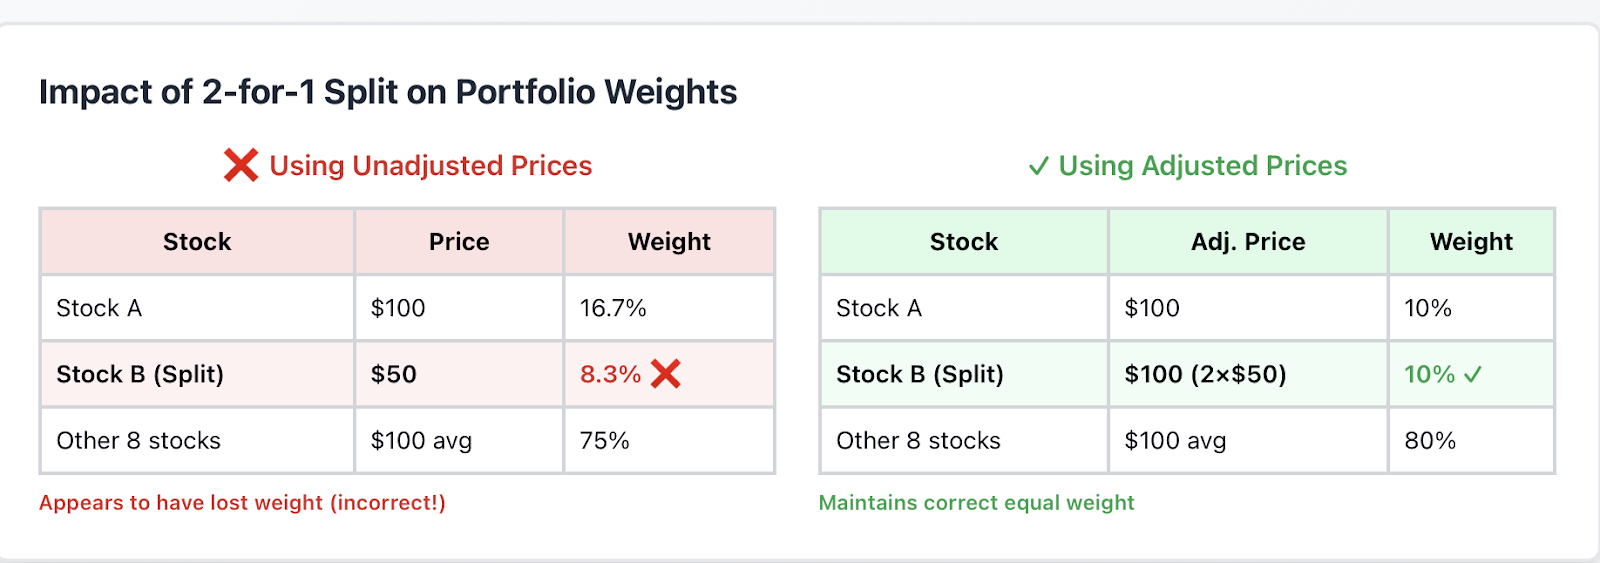
This is very important for passive index funds and ETFs. When a constituent stock takes place in a corporate action, the entire fund's net asset value needs to adjust for the true value of their position. If proper adjustments are not made the investor gets false gains or losses that do not reflect actual performance.
Also risk metrics will be miscalculated. The nature of price series data determines volatility calculations, largest drawdown measurements, and Sharpe ratios. If you are using raw data, you are overestimating the volatility on and around the dates of dividend distribution or stock splits. This will cloud your judgment of risk, which may lead to bad position-sizing or excessive leveraging.
Prudent portfolio managers always investigate if their data sources handle adjustments appropriately. The difference between adjusted and unadjusted calculations can mean the difference between sound risk assessment and potentially dangerous overexposure.
How to Access and Apply Adjustment Data on Trading Platforms
While modern trading platforms make it easy to make adjustments, you must know where the adjustments are located. Most price data feeds on platforms like Tradewill, TradingView, and MetaTrader will make automatic adjustments in their price data feeds.
The main thing to know is the difference between "Close" price and "Adjusted Close" price. A "Close" price tells you what a stock actually traded on that day. An "Adjusted Close" price tells you what that price would be worth today with all subsequent actions by a company factored in.
It is like a gradebook that automatically updates past scores when changes to the grading scale are made; you see your "C" and what that means today. In finance, for historical data or increased returns from strategies, using "Adjusted Close" will allow you to see the true performance.
Using "Adjusted Close" as the data source for analysis, historical data, and for strategies will limit the potential for errors in data analysis. Often when you are looking for back-tested strategies, the platform will have adjusted data defaults for charts and indicators, but custom analysis may not default to "Adjusted Close".
Traders, especially advanced traders, should cross-reference multiple platforms to verify data is of good quality. In most instances, different data providers will either make adjustments slightly differently or a little later; this is especially true for complex corporate actions or some international stocks. When you are back-testing strategies or simply documenting strategy research, close with documentation of the data source used and whether it was an "Adjusted Close" price and whether the data accounted for all adjustments needed.
Real World Adjustment Examples Traders Must See
Apple's Dividend Journey
Apple has a history of declaring quarterly dividends, which always result in automatic price adjustments. You can point to their historical chart around almost any dividend ex-date and you will see a small gap down in the raw price data, but the adjusted price shows smooth continuation between the two times. This is important if you are conducting technical analysis on the price data. A stock dividend is simply seen as a bearish breakdown of the stock price, which could lead to false sell signals.
An investor holding Apple today having received dividends over the years would see a total return that can be analyzed as a component of capital gains and dividends received. The adjusted price shows this total return, whereas the raw price indicator shows the stock price component only. For purposes of evaluating total return, the adjusted prices are necessary.
Tesla's 2020 Stock Split Impact
In August 2020, Tesla completed a 5-for-1 stock split. A $2,000 stock price in pre-split share price became five $400 shares price post-split overnight. If you look at an historical price chart for Tesla, the prices would have shown the $400-500 range, and not the $2,000-2,500 it traded at pre-split. The adjusted price is therefore important to preserve moving averages and trendlines over the split date.
If you disregard these adjustments, technical indicators are prone to extreme false breakouts. Let's use the example of a 50-day moving average that jumps up to $2,250 from $450 overnight. This pattern breaks all technical signals. Adjustments like these are handled by dividing all prior prices by the time-adjustment figure and making the change retroactively pre-split.
Ongoing Continuity of the S&P 500 Index
For example, the S&P 500 adjusts its companies for corporate actions on an ongoing basis of its 500 boutique companies. Every quarter, there are numerous dividends, and sometimes corporate splits, as well as changes in constituents of the index. Each one requires adjustment, or continuity, to the index.
You could backtest your S&P strategy of adjusted versus non-adjusted data. The non-adjusted data appears to have volatility spikes artificially around many dividend clusters. These fake movements produce false buy and sell signals that would have resulted in losing trades if it were real trades. The adjusted data smooths with index borne volatility and reflects the true returns of the index.
This kind of difference matters dramatically for quantitative traders on whether a strategy is successful or fails. A momentum strategy may demonstrate success because it was able to "capture" the dividend of shares, but in reality, there are no tradable profits from dividends. Dividends are accounting adjustments, not price movements and that difference is important.
Common Mistakes & Pitfalls When Using Adjustments
Mistake 1: Using Unadjusted Data for Return Calculations
Often, new traders download historical price data and fail to confirm whether it is adjusted. When calculating stock returns by looking at price levels at different times, they don't take into account that dividends and splits are influencing those prices.
Dividends or splits have changed the scale between the two observations and distorts the comparison of the price levels, much the same way that exam scores on two different tests can be distorted if one test is given more weight. The ranking of those two tests would not be a fair comparison if you didn't weight the scores properly.
Professional quant traders have learned their lessons the hard way. Backtests give them amazing returns until they realize they have been testing with unadjusted data. Those “profits” have come from dividends that were received separately and not from actual price movements that you would have reasonably traded.
Mistake 2: Splits and Dividends matter when doing Technical Analysis.
Support and resistance prices are drawn using adjusted price data. If you draw support and resistance levels using raw prices, you would consider a resistance level at which the stock has never actually traded adjusted. If the price or trendline broke that level, you would believe it was a breakout when it actually never reached that level on an adjusted basis.
This is especially important for longer time-frame analysis. A five year chart may have multiple dividends and possibly a corporate event (i.e. stock split). Every single dividend or event changes where support and resistance actually are. The longer the time frame with unadjusted prices, the more inaccurate the technical analysis would become.
Mistake 3: Overlooking Platform Data Differences
Not all platforms handle adjustments identically. Some adjust for dividends but not splits. Others handle domestic stocks perfectly but struggle with international securities. Advanced traders cross-reference data from multiple sources before trusting critical analysis.
Create a verification checklist. Does your data adjust for cash dividends? Stock dividends? Splits? Rights issues? International corporate actions? If you can't answer these questions about your data source, your analysis reliability is uncertain.
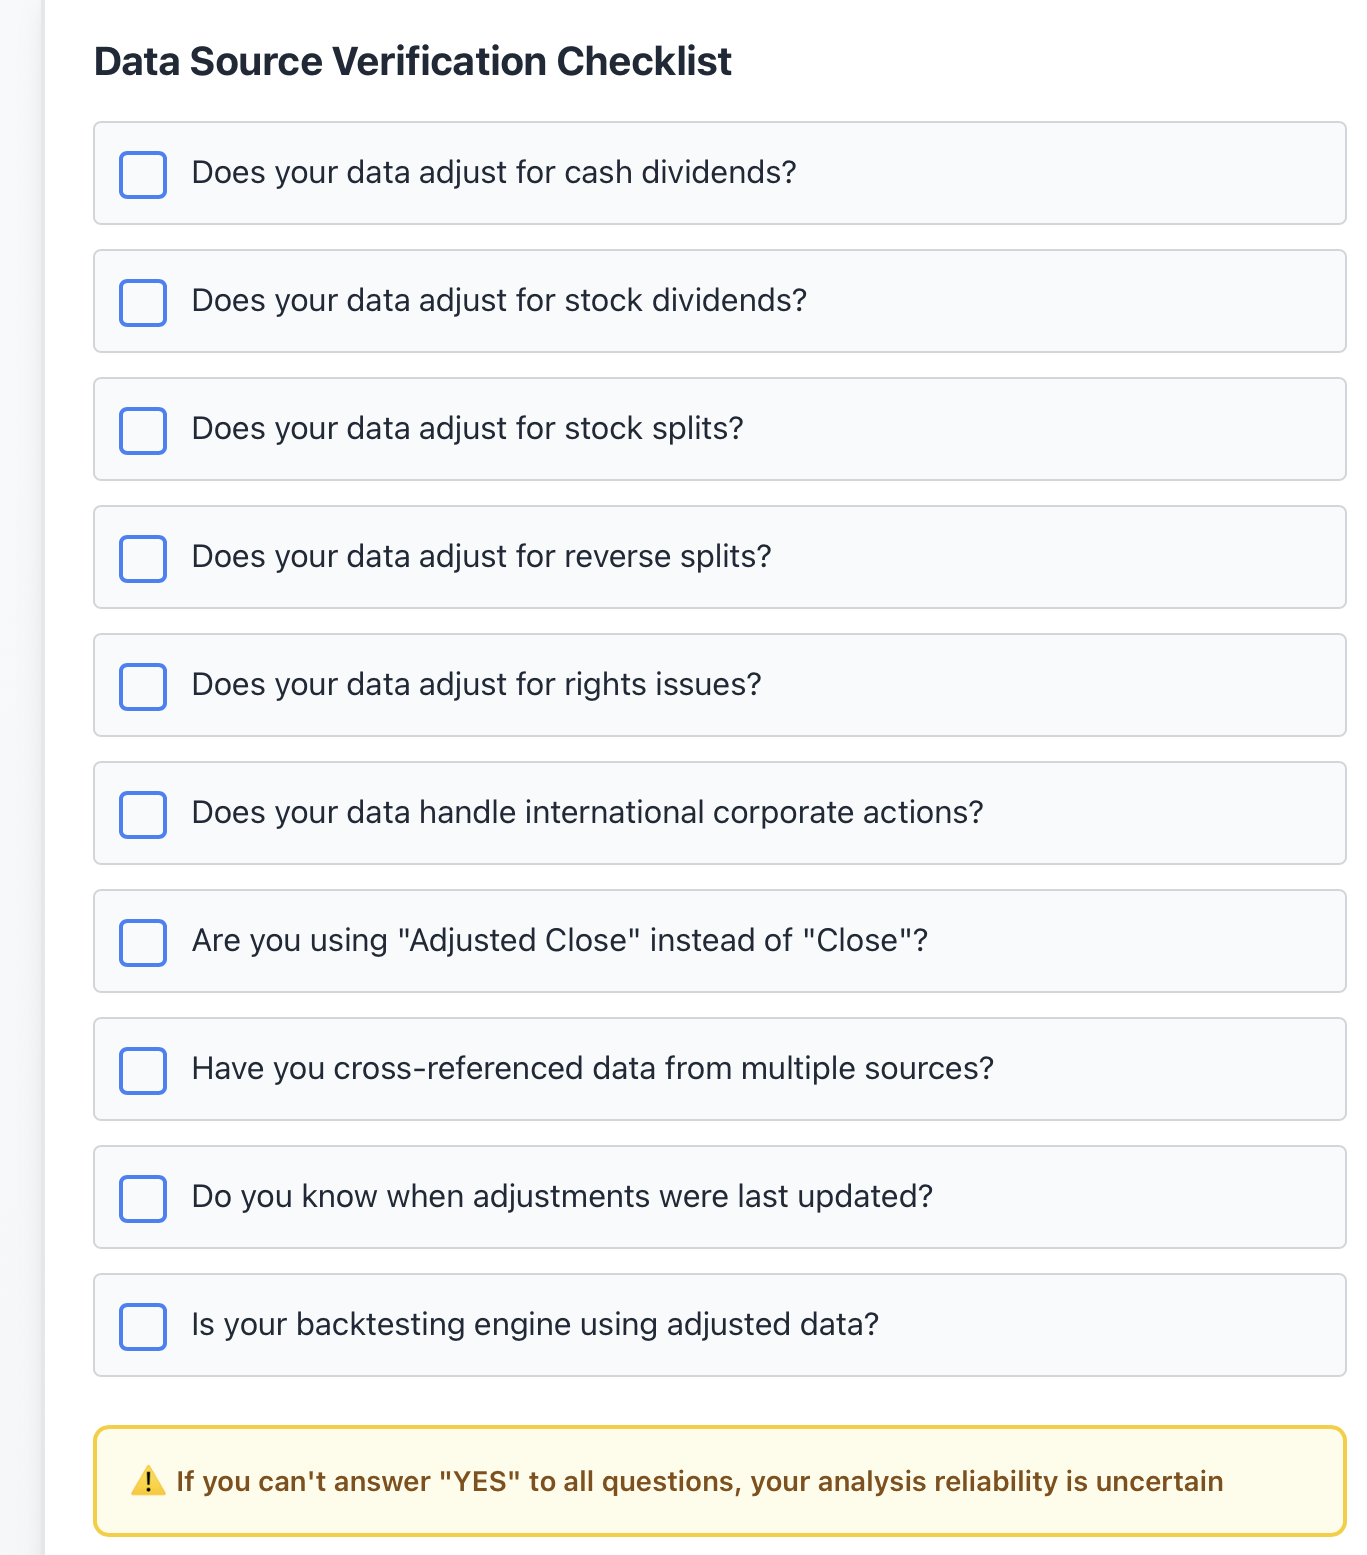
Remember that adjustment data updates dynamically. Historical prices get retroactively adjusted when new corporate actions occur. A price you downloaded six months ago might need updating if the stock split last month.
Apply Adjustments to Improve Your Trading Accuracy
Knowing adjustments distinguishes traders who guess from traders who know. These price adjustments are not hidden, technical details. Adjustments are absolutely essential to confident, accurate historical analysis; trustworthy technical signals; valid backtesting; and sound portfolio management.
Whenever you analyze a chart, calculate returns, or test a strategy, you are either explicitly or implicitly relying on adjustment information. While modern platforms often automate much of this adjustment work, having an idea of what is going on behind the scenes will help you avoid the traps facing uninformed traders.
The stocks and indices you trade have undergone countless corporate actions throughout their history. Each action required thorough and proper price adjustments to keep the historical data intact. If you ignore adjustments, you are conducting an analysis based on fiction! Your technical levels, signals, and backtest results are wrong, or at least misleading.
Check the adjustment procedures of your data sources today. Using "Adjusted Close" is one way to assess whether adjusted prices were available. It is best to cross-reference any important observations with other data sources.
These simple steps will dramatically improve your trading accuracy and help you avoid costly mistakes.
Ready to see how adjustments impact your trading strategies in real time? Open a demo account on Tradewill today and explore adjusted price data across stocks and indices.
Disclaimer: The content of the blog does not represent any position of Trade W, does not serve as any trading-related decision advice, and does not endorse any third-party.