

 Trade W
Introduction: Why Support and Resistance Matter in Forex
Support and resistance are the key concepts of technical forex analysis.
These levels are important decision levels where the price either bounces or breaks. Whether you are a new trader or an experienced trader, knowing support and resistance in forex trading is key to market timing and improving your profitability.
Think of watching EUR/USD bounce between 1.0800 and 1.1000 over and over again. What you are watching is more than price movement; it is the market's psychological behavior in price action.
This article will explain the base theory, provide real examples, and help you apply support and resistance trading in the live market confidently.
What Are Support and Resistance in Forex?
Support is a price point that, on the larger market, means demand exceeds supply, buyers enter, and prices stop falling. Resistance is a price point which, on the larger market, means supply exceeds demand, sellers are in control, and the price stops rising. These are not exact lines. They are zones; think of them as "floor" and "ceiling" within a price structure.
Prices behave much like a bouncy ball responding to a floor (support) and a ceiling (resistance) within a range-bound market.
Types of Support and Resistance
Support and Resistance Types
In order to identify reliable trade setups and fine-tune your entry and exit strategy, understanding the various support and resistance types in forex is imperative. The scope for potential static or dynamic risks increases the chance of potentially identifying valid ideas around price behavior.
-
Horizontal Support and Resistance
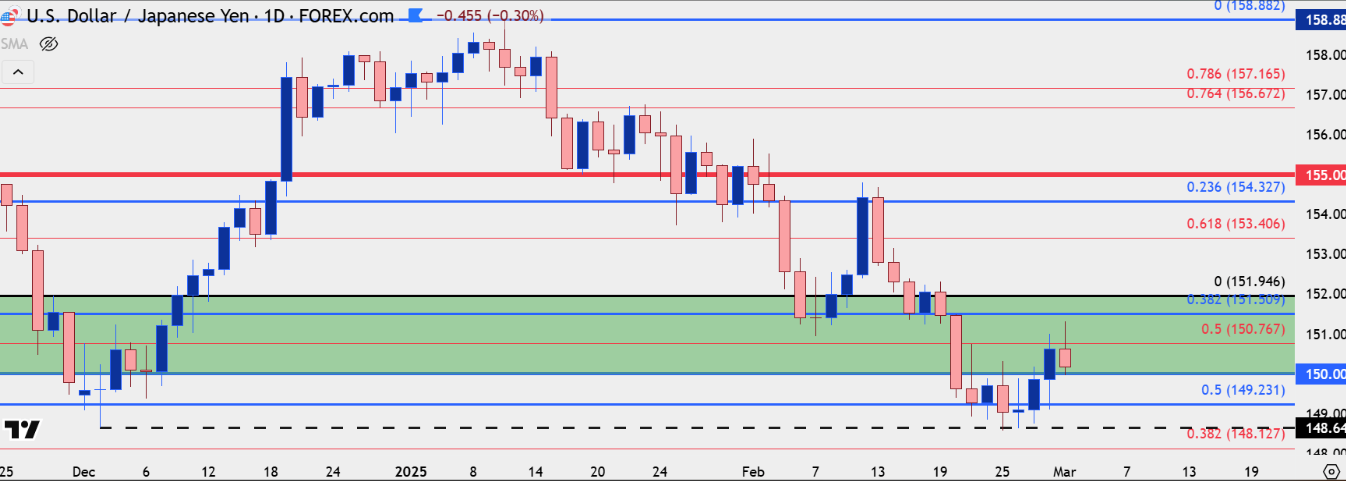
Horizontal support and resistance are the most commonly used levels by traders in technical analysis based on past highs and lows at which the price has reversed or stalled in the past. Horizontal support and resistance can be regarded as psychological zones that traders want to know how to trade around. Many traders will open or close a position at these levels as they are an ideal place to set a specific entry point, stop loss, and take profit.
The Chart below shows USD/JPY bouncing multiple times between 146.50 - 149.00 in a 4-hour time frame, illustrating the effectiveness of horizontal levels in identifying the range the price is consolidating at.
-
Trendline Support and Resistance
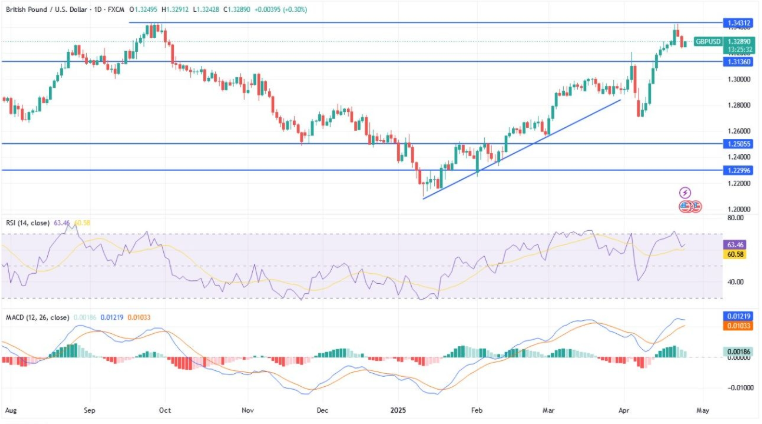
Trend lines are angles that connect a collection of higher-low features in an uptrend or lower-high features in a downtrend. The lines illustrate logical attributes acting as dynamic support and resistance trading zones that regulate price movement during a trend. The directional price action among touch points of consecutive features signifies a possibility that the price may continue to follow the trend.
In the example below, GBP/USD in a 1-hour chart shows price action that respects an uptrend line. Notice there are at least three touches granting valid status to the trend line as a respected support line in a bullish trend.
-
Moving Averages as Dynamic Support/Resistance
Moving averages, specifically the 50 EMA and 200 SMA, are increasingly popular as dynamic support and resistance areas as they are reactive to the price. Most institutional traders pay attention to moving averages to identify trend direction and to enter short-term trades on pullbacks. If the price continually bounces off of a moving average, this confirms to us that the level is being respected by the market.
In the example below, after using the daily chart of the EUR/USD currency pair, the price has continually used the 200 EMA for support, indicating the 200 EMA is being respected as a dynamic support level in the context of an uptrend.

-
Psychological Support and Resistance
Psychological levels are whole numbers (1.0000, 1.1000) or non-whole numbers with a common decimal fraction ending (0.6500) that attract trader attention and large order flow. Psychological levels often hold strong support and resistance due to the clustering of actual buy and sell orders. Trailed by other traders, they each gravitate when placing orders to clean remembered figures.
The chart below shows AUD/USD suffering every inclination of progressing above 0.6500. The numerous attempts show how psychological levels work as major barriers to price movement.

Source
Support and Resistance Types Comparison Table
How to Identify Key Support and Resistance Zones
Are you curious about how to identify support and resistance in forex? Check out this simple, step-by-step process to identify high probability levels with confidence:
-
Begin with the higher timeframes (D1 or H4): These only help paint the bigger picture to find major zones that carry more weight in the market. Price action on daily and 4-hour levels can reveal places where the big players (institutional traders) have placed their orders.
-
Identify zones that have at least 2-3 touches: An area of valid support or resistance usually contains multiple price rejections. The more times a level has been retested, the more powerful that level becomes.
-
Draw zones - not lines: Price seldom reacts to a single price point. Instead of drawing thin lines, you can draw shaded rectangles to mark areas where that price has repeatedly bounced or reversed around.
-
Use candlestick confirmation: Patterns like pin bars, engulfing candles, or doji candlesticks give some indication that the price may respect that level again.
-
Apply supporting indicators: Tools like RSI (which is used for divergence) or volume indicators can be a valuable resource in confirming whether momentum is present for a bounce or possibly a breakout.
Take the example of a GBP/JPY chart; it may show a price-respecting horizontal support zone after a few touches, followed by a good bounce. Then, as another attempt breaks the level, there is a quick reversal, a classic fakeout setup.

Top Forex Support and Resistance Strategies
To trade support and resistance properly, we need to be able to use well-defined strategies that allow traders to time their entry and exit. Here are three of the best and most popular methods: turnaround, breakout, and fakeout (false break) setups.
-
Reversal Trading
Enter if the price approaches support or resistance and you see a reversal candle (e.g. hammer, engulfing).
-
Example: EUR/USD bullish engulfing at 1.0800 support.
-
Stop-Loss: below support zone
-
Take-Profit: close to the next resistance
-
Pros: high risk-reward opportunity
-
Cons: the risk of fake outs in a trending market

-
Breakout Strategy
Trade a strong candle close beyond a key level. For a good set-up, volume and a retest could be used.
-
Example: GBP/JPY breaks, then retests 185.50 before going higher.
-
Stop-Loss: below breakout candle
-
Take-Profit: Fibonacci extension or previous highs
-
Pros: you can get on strong momentum
-
Cons: false breaks

-
Fakeout (False Break)
Trade is when the price breaks a level but then quickly comes back inside the range.
-
Example: USD/CHF broke 0.9000, then closed lower.
-
Stop-Loss: just above the fakeout wick
-
Take-Profit: mid-range or previous zone
-
Pros: entry is precise, and stop can be tight
-
Cons: You would need to react quickly for confirmation.

Best Tools and Indicators for Support and Resistance Forex
Properly applying tools can greatly enhance the accuracy of support and resistance strategies. The important tools include:
-
50 EMA (Exponential Moving Average) and 200 SMA (Simple Moving Average) - both determine the dynamic support/resistance, as well as the trend direction.
-
Fibonacci Retracement - allows traders to find retracement levels and certain areas of confluence inside an existing trend.
-
RSI (Relative Strength Index) or MACD (Moving Average Convergence Divergence) - identify overbought/oversold and divergence.
-
Volume profile - shows where institutional and trader interests are around larger price levels.
Example: You can have a powerful long setup when the 61.8% Fibonacci retracement lands in a support zone in conjunction with a bullish divergence in the RSI, as in AUD/USD.

Common Mistakes to Avoid
Even though it seems easy to understand, there are a lot of people who misapply support and resistance trading based on things that can be avoided;
-
Drawing lines! Instead of wider zones.
-
Entering trades without confirmations.
-
Using low timeframes for very important levels.
-
Forgetting to recognize what the trend is and going against the market structure.
-
Trading without stops and making emotional trades.
Pro Tip: Make sure you zoom out first in order to see the overall market structure, and the zoom back in for the entry itself.
The Psychology Behind Support and Resistance
To analyze the forex market using support and resistance effectively, we must understand market psychology. Obviously, traders and institutions remember and act on significant levels. Round numbers carry the most order flow, especially after breakouts, where most of the order flow is completely emotional buying or selling.
Support and resistance not only act at technical levels; they represent collective market behavior, fear, and greed. They're the actual visual footprints of crowd psychology on the charts!
Why Support and Resistance Still Work in 2025
Support and resistance still work extremely well, even today, with the increasing use of automation and AI trading systems. As long as there are human beings in the market, price movements will be driven by human emotions, crowd dynamics, and market memory, just as it was done decades ago.
To sharpen your trading edge:
-
Learn how to draw clean and reliable zones.
-
Master only one forex support and resistance strategy in each stage.
-
Back-testing and refining your approach consistently before you trade live.
Are you prepared to put these strategies to the test with no risks involved? Open up a free demo trade account with Tradewill and use your knowledge to trade forex, utilizing support and resistance levels. Would you like more free tools and guidance?
Join our mailing list and receive our free PDF cheat sheet on support and resistance. Subscribe and receive weekly forex trade setups and some exclusive insights into support and resistance trading strategies that work.
Disclaimer: The content of the blog does not represent any position of Trade W, does not serve as any trading-related decision advice, and does not endorse any third-party.