

 Trade W

Markets are moving quickly. Prices can change in a matter of seconds; trends can reverse without warning, and many traders end up with several indicators on their charts trying to keep up. The result? Analysis paralysis.
The Traders Dynamic Index was created to help with this problem. It integrates momentum, trend direction, and volatility into one indicator, so you don’t have to look at several different indicators in multiple windows. At a glance, you can determine what the market is currently doing, where it is heading, and the strength of that movement.
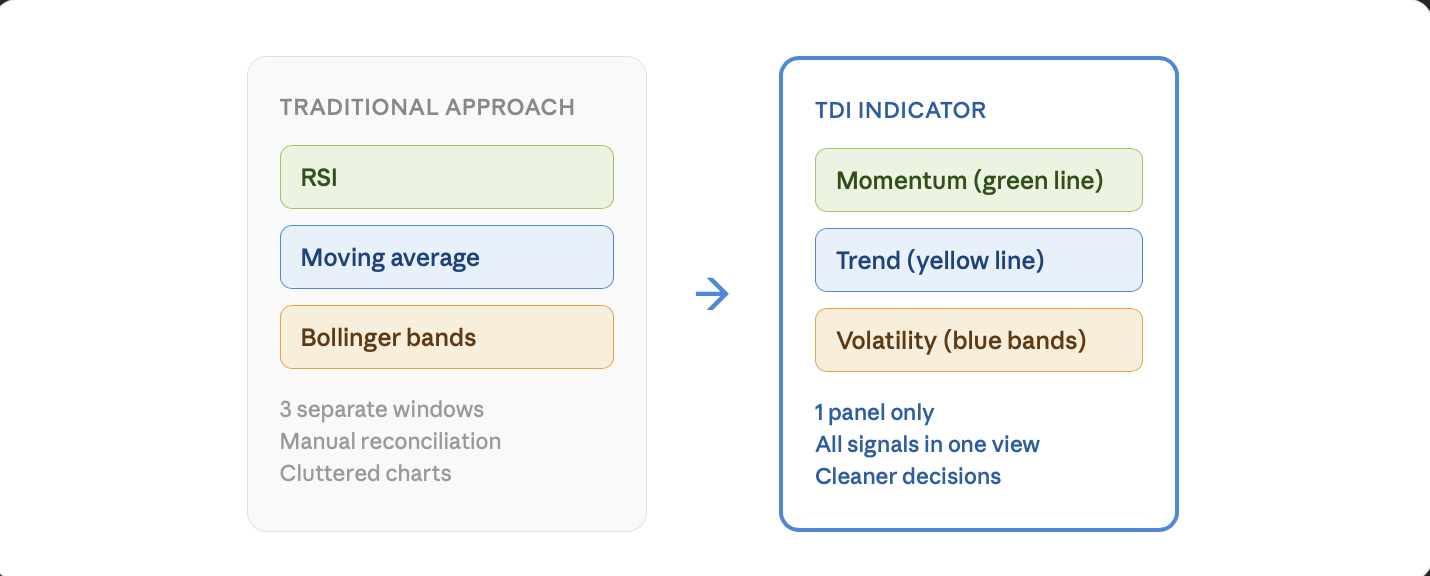
This guide covers everything: what TDI is, how each of its components works, the three signals experienced traders rely on, and how to build a complete strategy around it.
What Is the Traders' Dynamic Index?
The Traders Dynamic Index is an evolving technical analysis approach that combines three popular technical analysis techniques, resulting in one integrated indicator. Therefore, all types of price movements can be evaluated by traders using TDI.
The three indicators within the TDI include: Relative Strength Index (RSI), Moving Average (MA) and Bollinger Bands (BB). Each indicator can perform its own unique function; RSI measures the speed of price movement as well as how strong (i.e., increasing or decreasing) that price movement is, while MA allows the trader to smooth out the noise within the price action so they may see which way the overall trend is trending; Whereas, BB’s, which define the expansion and contraction that occurs in the market at any point in time.
Traders can use TDI to find possible entry points for trading; to confirm price direction reversals, to assess price momentum before entering into a trade, and to filter out high "probability" type setups from low "probability" type setups during high volatility.
Understanding the Four Lines of the TDI Indicator
The TDI isn't one line — it's four, and each one serves a specific purpose. Once you know what each line represents, reading the indicator becomes intuitive.
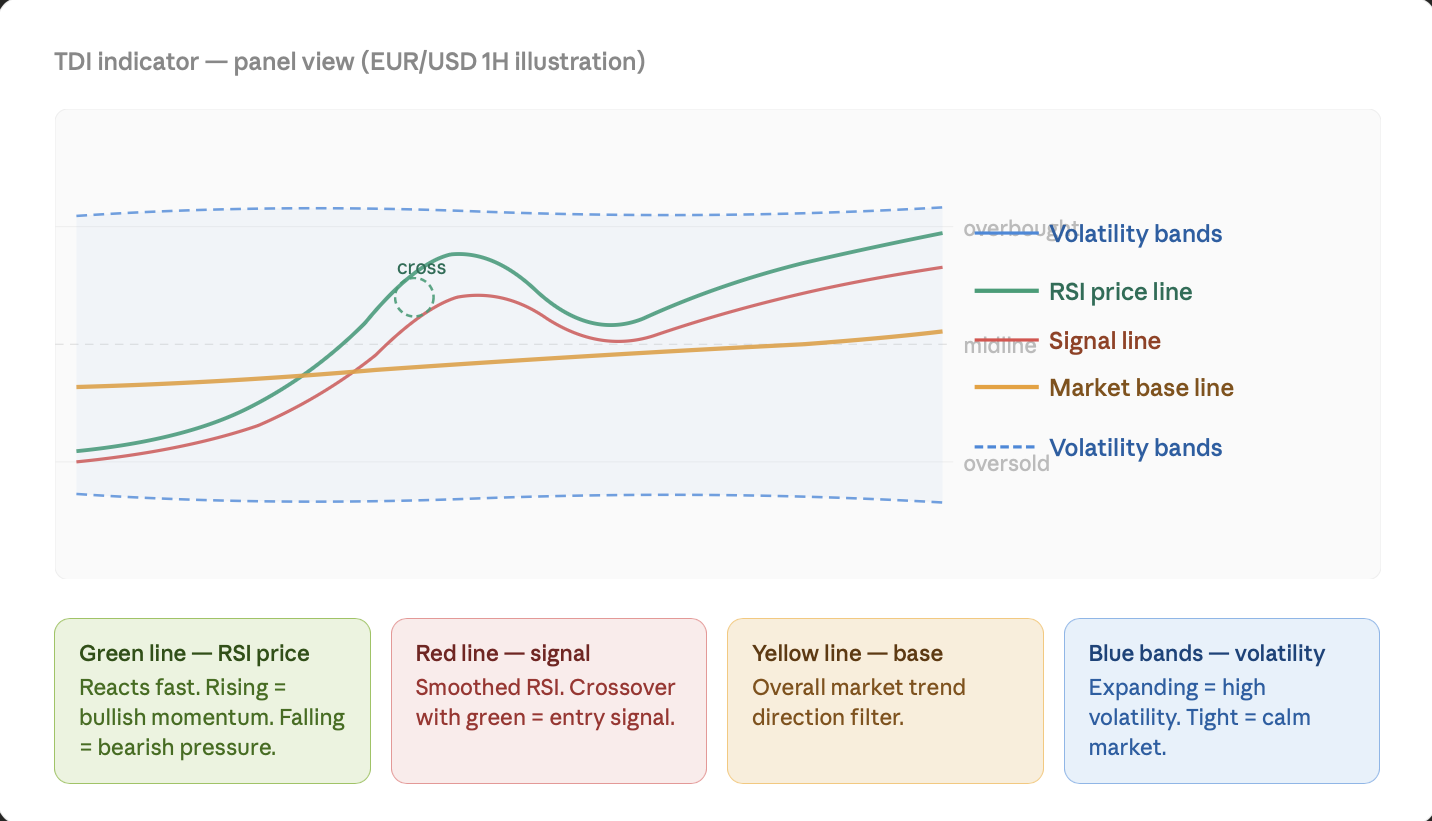
The RSI Price Line (Green) is the most reactive line of the TDI, with regard to tracking the price momentum directly and eagerly, with rapid movements to reflect the buying and selling momentum.
When the green price line climbs, buying pressure has built up. When it falls, the selling pressure takes control of the market.
The Signal Line (Red) acts as a smoothed-out version of the Green RSI line; however, it lags behind Green because it is a more reliable way of filtering out any "noise" caused by volatility.
When the green price line crosses above the red signal line, it indicates an opportunity to buy. Conversely, when the green price line crosses under the red signal line, it provides an opportunity for selling.
The Yellow Market Base Line indicates where the trending direction of the overall market is currently situated.
When the Green RSI price line is above the Market Base Line, the market is currently in a bullish trend and vice versa for a bearish trend.
The Blue Volatility Bands are similar to Bollinger Bands; when the bands tighten together, it indicates that the market is calm. When the bands are expanding apart, it provides an indication of an increase in volatility; if the Green RSI price line moves outside of the Volatility Bands, it provides an indication that the market price may be overextended.
3 TDI Signals That Identify Major Market Moves
Knowing the components is one thing. Knowing what to watch for is what makes TDI actually useful in live trading.
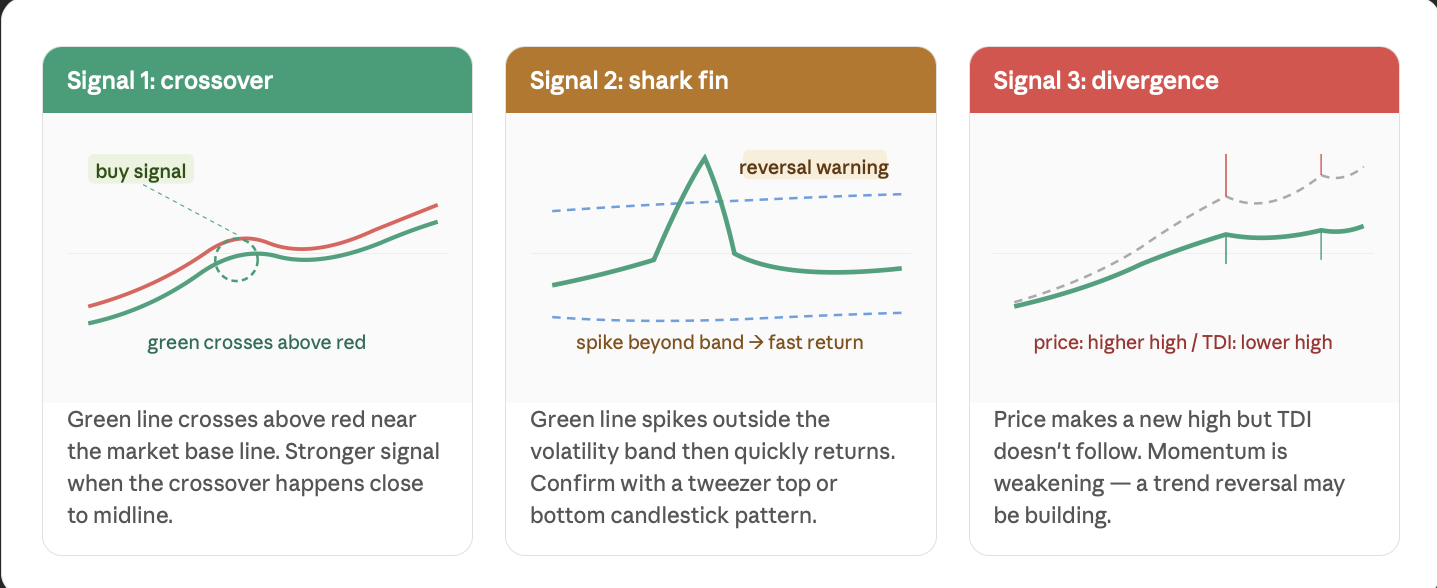
Signal 1: TDI Crossover
Bullish momentum is defined by the green line crossing above the red line, while bearish momentum exists when the green line crosses below the red line. The importance of the crossover increases when it occurs close to the Market Base Line. A crossover that takes place well above or below the centre point of the bands is likely to have less strength and could be fading rather than beginning a new trend.
Signal 2: Shark Fin
The green line climbs sharply outside of the volatility band and quickly rolls back. The spike-and-roll shape forms a shark fin-like pattern on the chart and indicates that the market was overextended in one direction and is now correcting. Many traders will wait for a candlestick reversal pattern that forms at the same price level before making trading decisions based on the shark fin pattern.
Signal 3: TDI Divergence
If price makes a new high and the TDI green line forms a lower high at the same time, the upward momentum of the bounce is weakening. This does not mean that the price will reverse immediately, but it does provide a cautionary signal that the trend is losing strength. The opposite is true as well; if the price makes a new low and TDI makes a higher low, then that divergence could indicate an upward reversal.
How to Create a High Probability Trading Strategy Using TDI
The TDI is at its most effective when it confirms a decision you've already made based on the action of price. Many traders use an approach that combines TDI with supply and demand areas.
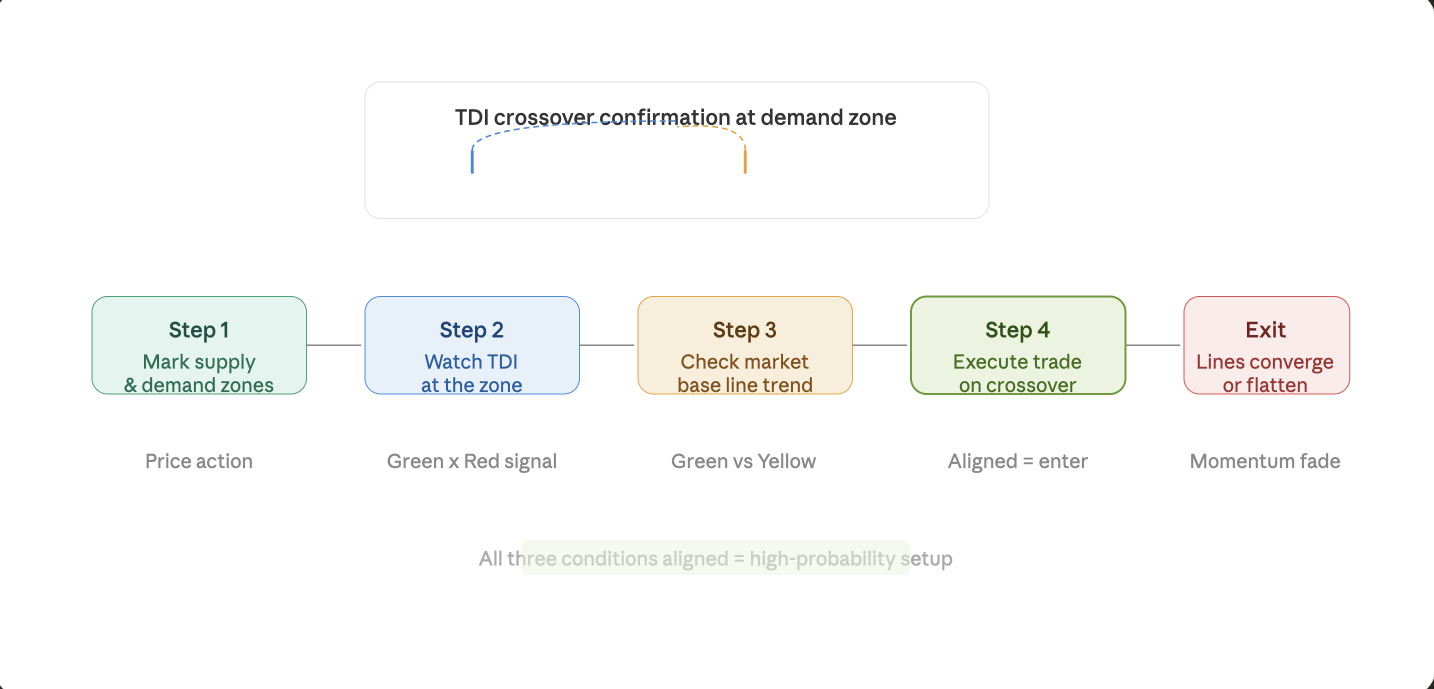
To trade long and short, this is the process you'll follow:
Step 1: You must mark both a supply zone and a demand zone on your price chart where there have previously been sharp price reversals, indicating either aggressive purchasing or selling by buyers/sellers. This marks the "supply" and "demand" zones.
Step 2: The TDI will then confirm your trades by indicating whether or not the price returned to the designated supply/demand zones, by confirming the position of the green and red lines at each zone.
Step 3: Check your Market Base Line. If the green line is above the yellow line while testing a demand zone, it indicates a larger trend that supports your entry. If the Market Base Line gives conflicting signals, then it is best to stay out of the trade until those signals agree.
Step 4: Enter the trade after confirmation using both the Market Base Line and the TDI, and manage the exit of your trade as soon as there is convergence or flattening of the green and red lines.
Using TDI During High-Volatility Events
News events are when most traders get burned. CPI releases, central bank rate decisions, and employment reports can move markets by hundreds of pips in seconds.
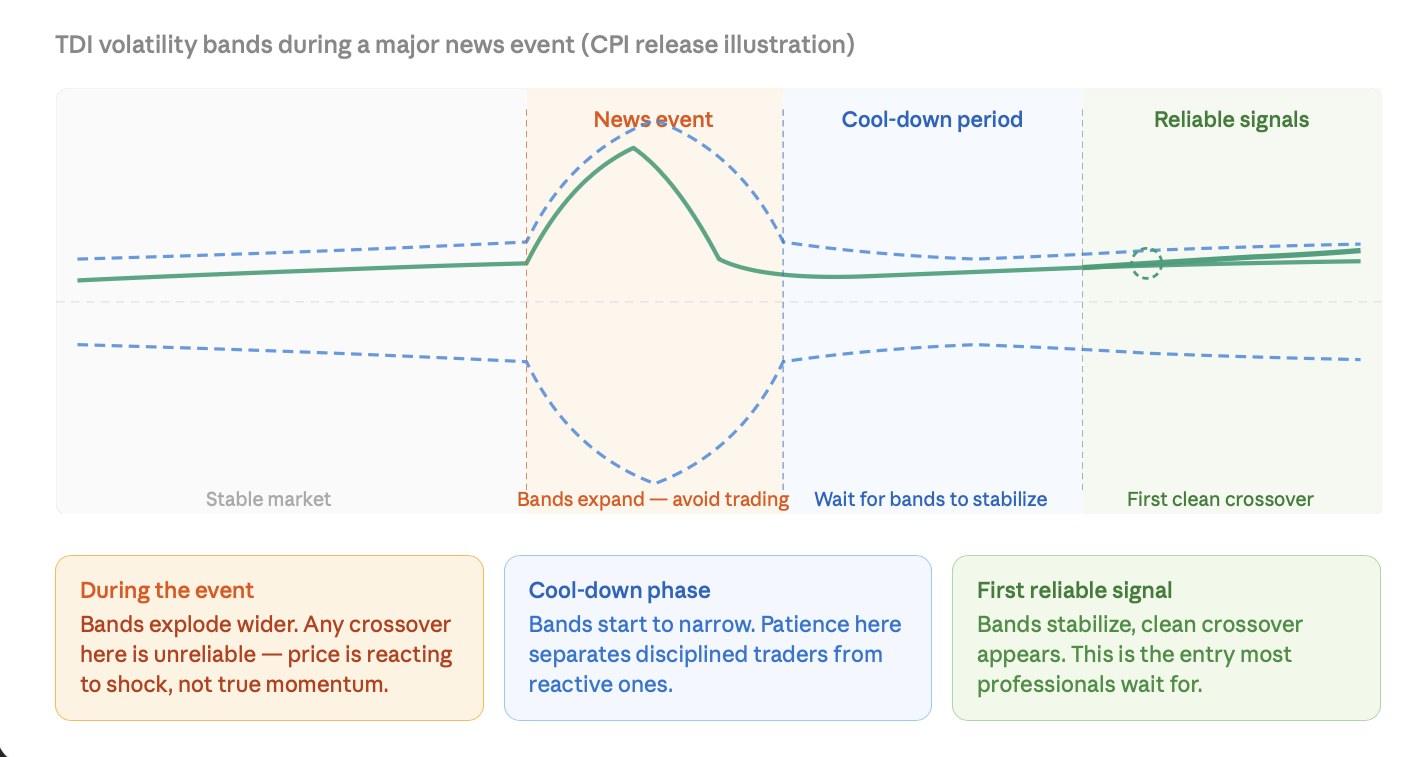
The volatility bands of the TDIs can be seen expanding widely when large news events occur. Crossovers that occur during these expansions are often false signals because the speed of price movement does not give TDI enough time to show momentum shifts with price.
A better choice would be to wait until the bands begin to contract. After waiting for the bands to stabilise and see your first clean crossover after things settle down, an indication at that point will have much more value.
Different markets will produce different results. Bitcoin and gold create more dramatic expansions of the bands than major Forex pairs like EUR/USD, which will settle much sooner after a major announcement.
When TDI Gets It Wrong
It should also be understood that TDI will not always provide valid signals, and a major difficulty in using TDI is the accurate recognition of its limitations.
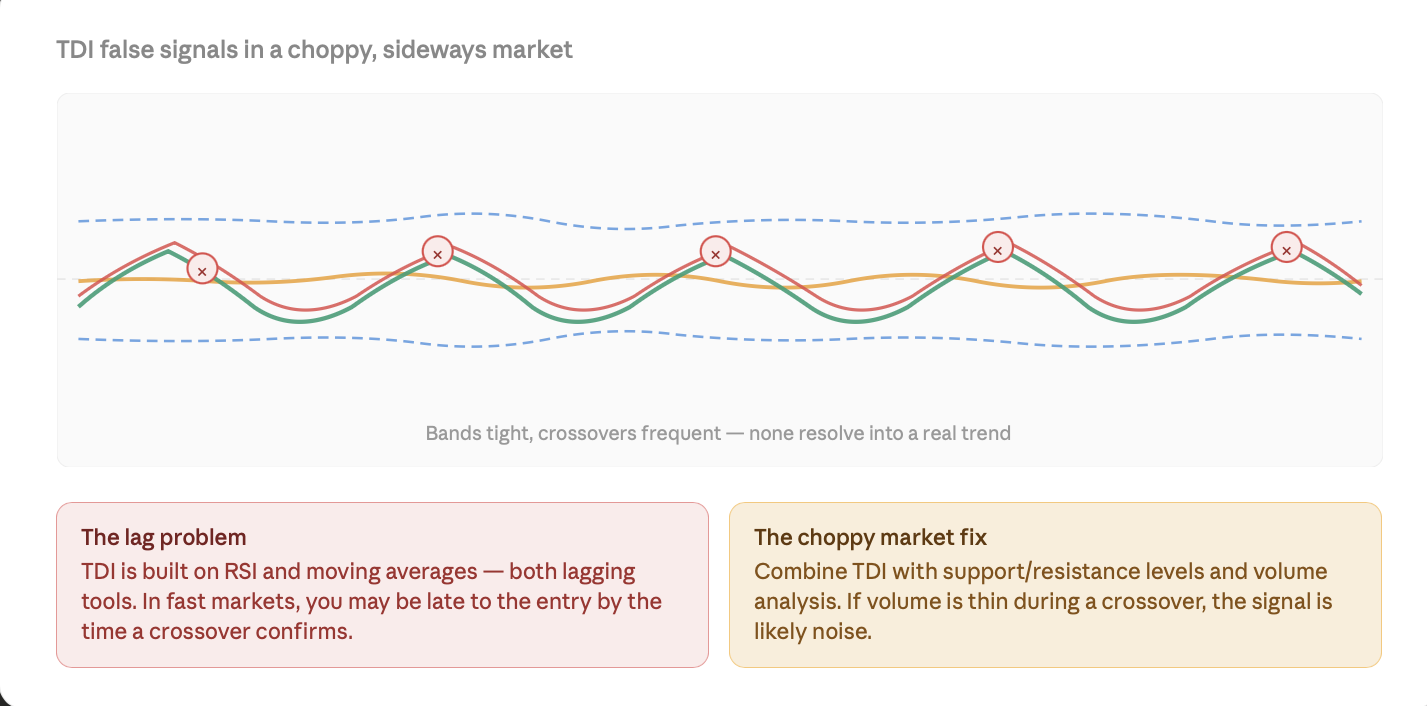
The greatest difficulty is lag time. Since TDI is based on RSI and moving averages, it verifies the actions that have recently taken place, but it cannot predict what is going to happen. In a fast-Shifting market, it can result in entering right before the move is done.
Another issue with TDI is that it creates frequent crossovers for sideways-moving prices or no clear trend, and will typically produce false signals. Constantly crossing green and red lines will also, while merging, limit the width of the underlying bands; therefore, there is nothing that results in a tradeable signal.
Using support and resistance levels in conjunction with TDI would be useful, but if TDI is creating crossovers, and the price keeps rebounding within a two-level support and resistance area without breaking out, it would be wise not to enter.
TDI Across Markets at a Glance
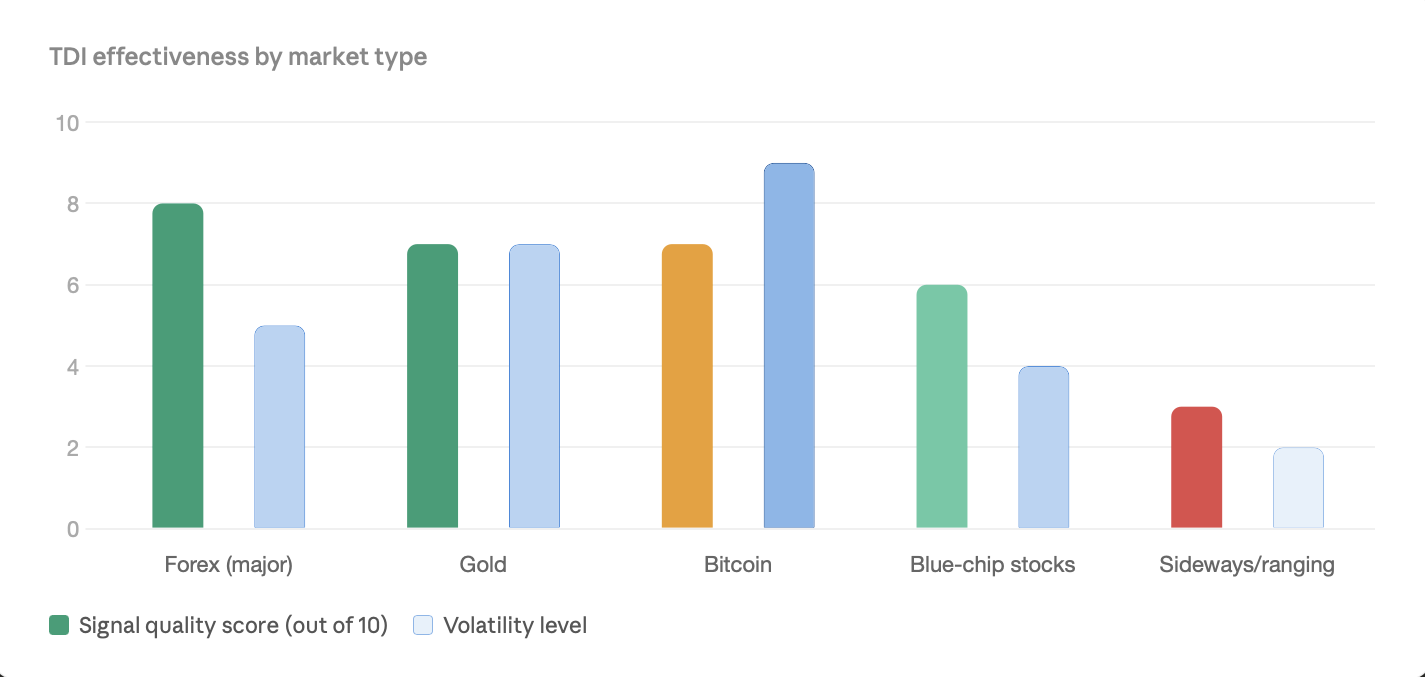
The TDI indicator performs well in trending markets with good momentum, such as the major Forex pairs (EUR/USD, GBP/USD). While TDI also works in trending markets for Crypto, you need to adjust your band thresholds further out due to the much greater volatility of these markets. Don't ever trust the TDI alone to drive your trades when an asset is in a narrow range of prices.
Frequently Asked Questions
What is the Traders Dynamic Index? The Traders Dynamic Index is a technical indicator that combines RSI, a moving average, and Bollinger Bands into a single tool. It shows market momentum, trend direction, and volatility all in one chart panel.
Is the TDI indicator good for forex trading? Yes. TDI is widely used in forex because currency pairs tend to trend consistently, which suits TDI's crossover and divergence signals well. It's particularly useful for timeframes of one hour and above.
What timeframe works best for TDI? Most traders use TDI on the 1-hour, 4-hour, or daily charts. Shorter timeframes, such as the 5-minute or 15-minute chart, increase noise and false signals significantly.
Is TDI better than RSI? TDI includes RSI as one of its components, but adds trend and volatility context that RSI doesn't provide. For most traders, TDI gives a more complete picture than RSI alone.
Can beginners use the TDI indicator? Definitely. The four-line structure takes some time to internalise, but once you understand what each line represents, TDI is actually easier to read than managing three separate indicators at once.
How accurate is the Traders Dynamic Index strategy? Accuracy depends heavily on how TDI is used. When combined with supply and demand zones and proper risk management, TDI signals become significantly more reliable. On its own, like any indicator, it produces false signals in choppy or trendless conditions.
Final Thoughts
The Traders Dynamic Index is solidifying itself as an 'all-in-one' tool by essentially fulfilling its purpose. TDI contains, in one easily read and applied indicator, higher time frame directional moving averages (MA), relative strength indexes (RSI), and Bollinger Bands.
TDI's true value lies in how accurately it can depict the market context through the MA lines, where the current price resides regarding key levels of support and resistance, the broader direction of the market, and the expansion or contraction of volatility.
Traders will get the most use out of TDI who do not care about every crossover being a trade signal, but how that particular crossover spent an appropriate amount of time in the context of other levels of support and resistance, trend direction and market volatility.
You must be able to identify the four lines, identify the three signals and apply TDI to the overall price action framework for it to really become a very significant and valuable component of your trading decision-making process.
Ready to put TDI signals to work on live charts? TradeWill's platform gives you real-time data and advanced charting tools built for exactly the kind of analysis this guide covers — start trading on TradeWill today.
Disclaimer: The content of the blog does not represent any position of Trade W, does not serve as any trading-related decision advice, and does not endorse any third-party.