

 Trade W

A common occurrence is the bragging about a high return (e.g. 40% for a year). The discomfort of this number would be that if that return was made with 3 times as much risk as what was considered the market benchmark (the S&P 500), then the return was nothing more than just leveraging money to get a lucky gain.
The Treynor ratio is one of the only ways to cut through all this BS. Most investors chase return, while smarter ones measure their efficiency in generating return. The Treynor Ratio is used to measure how much actual alpha you generate over your benchmark & will be a critical number for success in a volatile, high-beta environment in 2026, particularly in the tech industries.
1. What the Treynor Ratio Actually Tells You
The Treynor Ratio shows the percentage point difference between the excess return you get for every unit of systematic market risk you take on. It’s basically your return relative to the market risk heat level you are exposed to.
The formula looks clean:
Treynor Ratio = (Portfolio Return - Risk-Free Rate) / Beta
To make this easier to understand, let's look at the important terms:
-
The Portfolio Return is how much money was earned by an investor (for example, 15% or 20%).
-
The Risk-Free Rate is how much money could have been earned by an investor in government bonds (for example, around 4%).
-
Beta is how much volatility or movement an investor's portfolio has compared to the overall market.
Here's a concrete example. Say your tech portfolio returned 15% last year. The risk-free rate is 4%. Your portfolio beta is 1.2 (meaning it's 20% more volatile than the market). Your Treynor Ratio would be:
(15% - 4%) / 1.2 = 9.17%
That 9.17% tells you that for every unit of market risk, you generated 9.17 percentage points of excess return. The higher number wins. Always.
2. Why Total Risk Is the Wrong Lens
People often focus too much on total volatility. It's a big focus for the Sharpe Ratio too, but with a diversified portfolio, most of the volatility you experience will be from systematic risk, the risk inherent in all assets, the risk of a market-wide decline.
Unsystematic risk and other company-specific risks will be eliminated with proper diversification, so why measure them at all?
The Treynor Ratio ignores "noise" altogether and measures exactly how well you are compensated for taking market risk by adjusting your return based on how much market risk you assume. The Treynor Ratio is based on the Capital Asset Pricing Model (CAPM), which states that the market has some level of efficiency and thus you will earn a premium for carrying systematic risk, but not for carrying the risk of a company.
In short, Treynor assumes that you are smart enough to have diversified the components of your portfolio that you shouldn't take risks in.
3. Treynor vs Sharpe: When Each One Matters
This is the question that trips up investors constantly. Which metric should I use?
Use Sharpe for:
-
Single stocks or concentrated positions
-
Portfolios where unsystematic risk still matters
-
Comparing unrelated asset classes
Use Treynor for:
-
Diversified stock portfolios
-
Evaluating fund managers
-
Comparing market-correlated strategies
-
Professional trading systems
An example is two investments:
-
A diversified S&P 500 ETF has a Sharpe ratio of 0.65 and a Treynor ratio of 8.2%.
-
A concentrated investment in Tesla has a Sharpe of 1.1 and a Treynor of 4.8%.
The concentrated investment in Tesla has a higher Sharpe ratio (i.e. more return per unit of total risk), and the ETF has a higher Treynor ratio (i.e. more return per unit of Systematic Risk) than does Tesla.
If you already own lots of technology stocks, then you would not want to add a position in Tesla because of its idiosyncratic volatility or how much individual security variation lies outside of the systematic market movement.
As such, from the perspective of a well-diversified portfolio context, the S&P 500 ETF is more efficient than its concentrated counterpart.
For that reason, professional investors use the Treynor ratio to measure what is important when building a solidly constructed portfolio.
4. The CAPM Connection: Where Treynor Really Shines
Treynor lives in the CAPM world, where the Security Market Line (SML) is the referee. The SML tells you what expected return an asset should deliver based on its beta.
The formula: Expected Return = Risk-Free Rate + Beta × (Market Risk Premium)
If an asset is positioned above the security market line (SML), then it's undervalued (you're receiving a higher return than what Risk requires), and vice versa, if it's below, then it is overvalued.
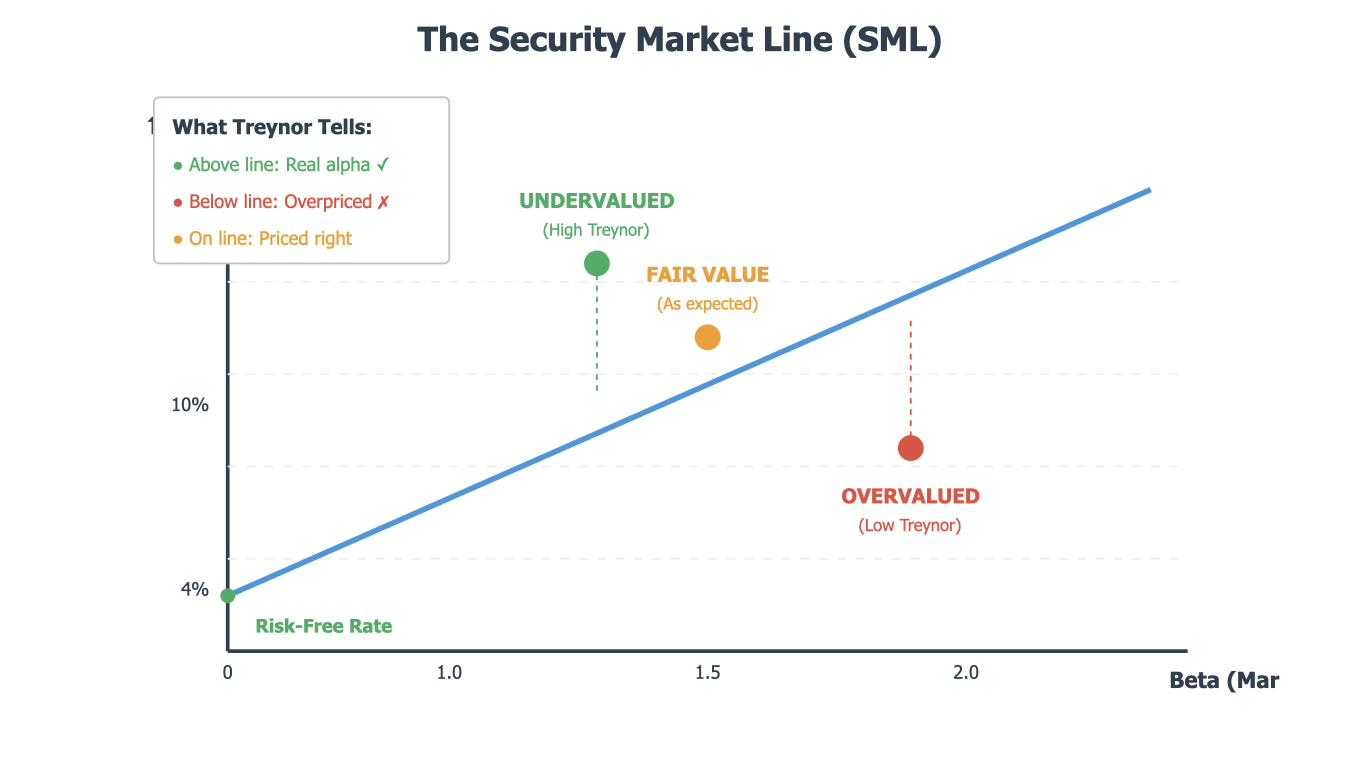
Treynor is a measure of whether you are receiving more or less than the value of an investment at that price. A high Treynor means you're being compensated more than the model indicates, based on the SML.
With stocks in the Magnificent Seven having higher betas than most other stocks, some of them can justify their betas through returns that exceed Treynor, while others cannot. Treynor will assist you in identifying which stocks create alpha.
5. The "Magnificent 7" Test: High Returns, Low Efficiency
Using Treynor can help differentiate between true performance and increased risk due to high beta.
Investors often get excited about high returns, such as the 60% return on a stock over 12 months. However, if the stock has a beta of 1.8 and the overall market is up 25%, Treynor will reveal to investors that the performance includes a large beta-based component. The Treynor ratio indicates that the total return, inclusive of how much can be attributed to movements in the overall market, will be closer to 30% than the actual 60%.
This means the return seen in 2026 will be more relevant than the return published in 2025. Investors have a lot of mega-cap concentration in their portfolios, and, therefore, the Treynor ratio is capturing valuations that are missed by simple return measures.
Asset managers who charge 1.5% AUM but provide returns consistent with the market on mega-cap stocks are providing investors with a negative return. Managers who provide a return of 2-3% in excess of market returns on similar beta are providing clients with positive returns.
6. Building a Recession-Resistant Portfolio Using Treynor
Let’s evaluate portfolio risk not just as a measurement tool but as a way to manage a portfolio through the use of the Treynor.
First, by setting a target beta amount for a portfolio, if you expect volatility, you could use a lower target of 0.8-0.9; if you expect to see bullish behavior you may use a higher range of 1.1-1.3. Finally, create your positions such that if you combine them, they will match your targeted beta and yet also will provide the highest possible Treynor rating value.
For example:
-
40% low-beta dividend stocks (beta 0.6, Treynor 7.2%)
-
30% balanced growth (beta 1.0, Treynor 8.9%)
-
20% high-beta tech (beta 1.5, Treynor 9.1%)
-
10% gold or defensive plays (beta 0.2, Treynor 3.1%)
You may have a blended portfolio with a beta of 0.88 and a Treynor of 7.8%. This indicates you are managing risk effectively and efficiently. You are also following strict rules about rebalancing in case your individual holdings drift by 0.1 or 0.2 in beta.
To make this operation even easier, check your Treynor score quarterly. If your Treynor begins to decline – even when returns remain the same – it indicates that your portfolio is generating less revenue and getting more difficult to achieve the same profit. When this occurs, it is time to consider rebalancing your portfolio or determining how to adjust your position in those securities.
7. How to Calculate Treynor in 5 Minutes
You do not have to have any expensive software to do this. The steps are:
Step 1: Get the return of your portfolio over the time frame you chose (3 years, 5 years, etc.).
Step 2: Find the beta of your portfolio. You can take the data from your brokerage, or you can calculate it by plotting your monthly returns versus the S&P 500's monthly returns and drawing a line through the points.
Step 3: Look at the risk-free rate (currently about 4% for annualised T-Bill rates).
Step 4: Plug these numbers into the formula: (Return - Risk-Free Rate) / Beta.
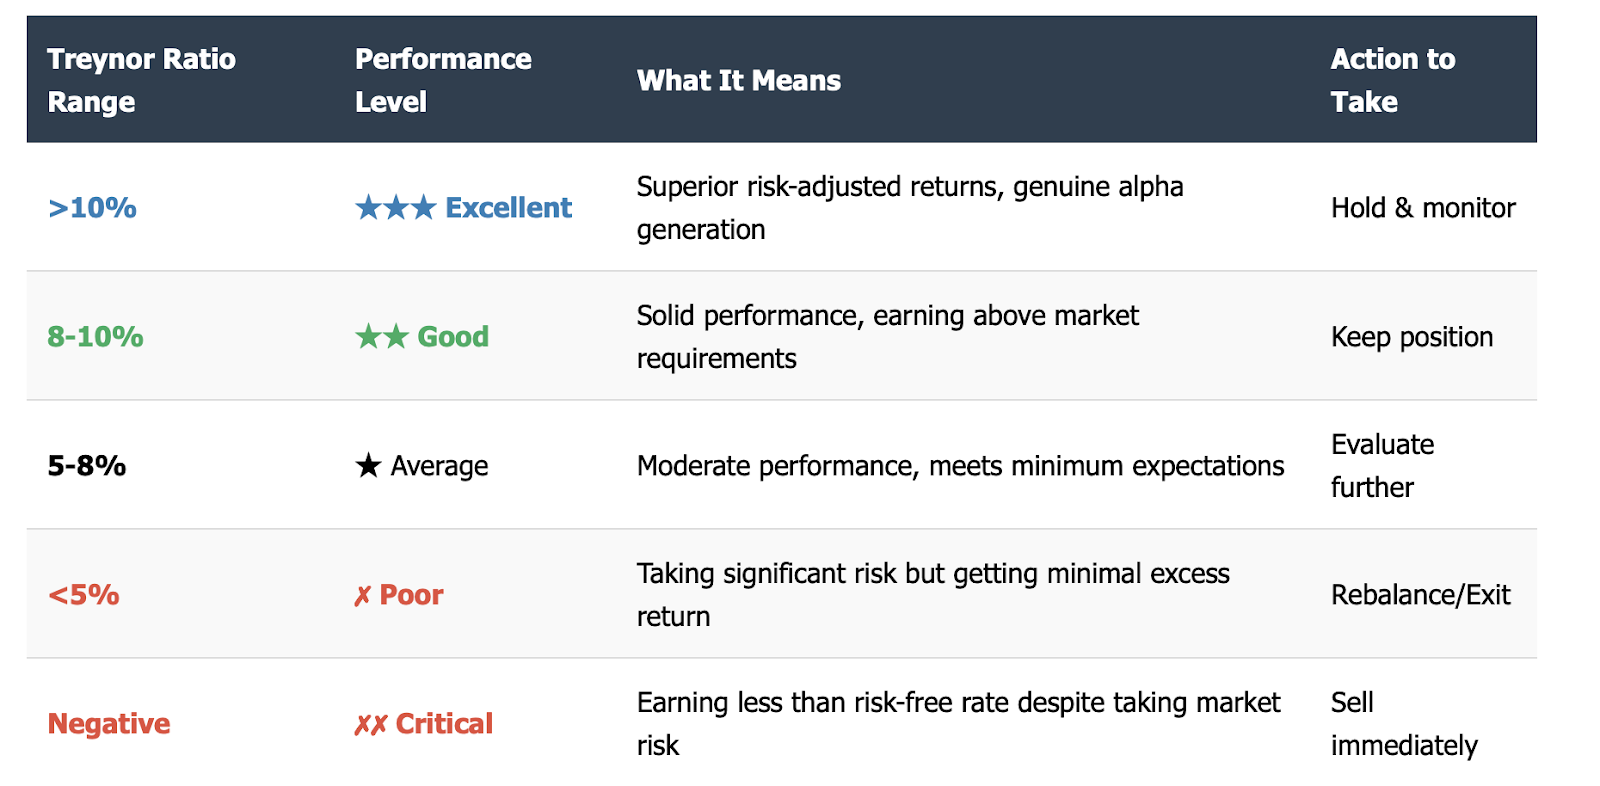
Step 5: Evaluate. Any result greater than 8% is considered good, above 10% is considered great; less than 5% means you are taking a lot of risk in terms of returns.
8. The Illusion That Kills Portfolios
The psychological trap is this: when the market is hot, and you have high amounts of leverage and invest in high-beta positions, you feel much smarter than your friends will because you can achieve greater returns than they can.
Let’s say you are using 2x leverage on a beta 1.5 tech position. Let’s also say the market is ripping and you are up 45%, whereas your friend is up 18% holding an unlevered S&P500 position. You feel like you have just outsmarted your friend, but when you look at the Treynor ratio of each of your investments, you will see that you have taken on 3 times the risk for 2.5 times the return. The math doesn't add up.
Now, let’s say it is 2027 and the market has corrected. You are down 40% because you still hold tech stocks leveraged 2x, while your friend has an unleveraged position in the S&P500 and is only down 12%. Who is going to feel like a genius now?
This is why Treynor is important from a psychological perspective. It forces you to confront the uncomfortable truth of your strategy during the good times, so you are not negatively impacted by the bad times.
9. The Real Limitations: When Treynor Breaks
Truth is, Treynor is not always great at what he does.
For starters, stock prices do change over time, which means that their betas also do. You may have calculated Netflix as a growth stock, but it shifted to being a defensive play.
A 2-year beta calculation does not mean that you will have success reproducing or forecasting the same beta in the next 2 years.
During March 2020, we witnessed many correlations across stock markets go to 1.0. Therefore, the beta on any stock that you have calculated means nothing! All stocks moved with the overall market.
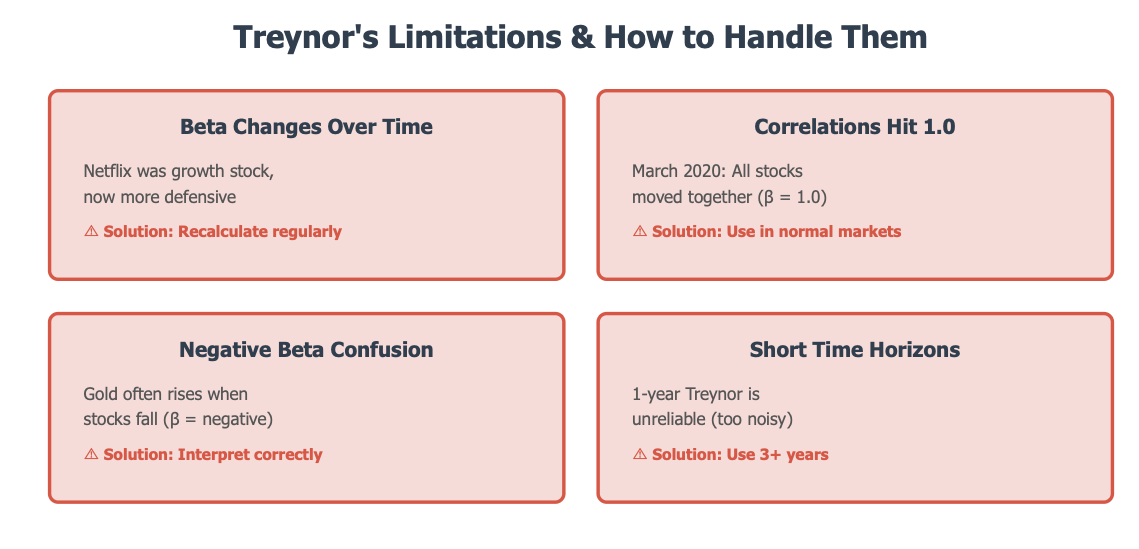
Negative betas can also create confusion. For example, an asset such as gold typically increases when stocks decline. So if you have a negative beta on Treynor, you now have a negative beta, creating a confusing situation. As long as you interpret it correctly, it still works.
When using Treynor as your investment metric,c you need to ensure that your investment horizon is long enough. One year is not reasonable; therefore, re I would suggest going with a 3+ year horizon.
These limitations will not eliminate Treynor as an investment metric. They just indicate that you need to utilise Treynor with other metrics rather than alone to make your investment decision.
10. Treynor vs Jensen's Alpha vs Information Ratio: The Full Toolkit
What if you want to go even further with fine-tuning? Use all three methods together.
Treynor measure assesses the effectiveness by examining one's excess return generated by exposure to market risk.
Jensen's alpha identifies how much an investment has outperformed in relative terms to Capital Asset Pricing Model (CAPM) expectations.
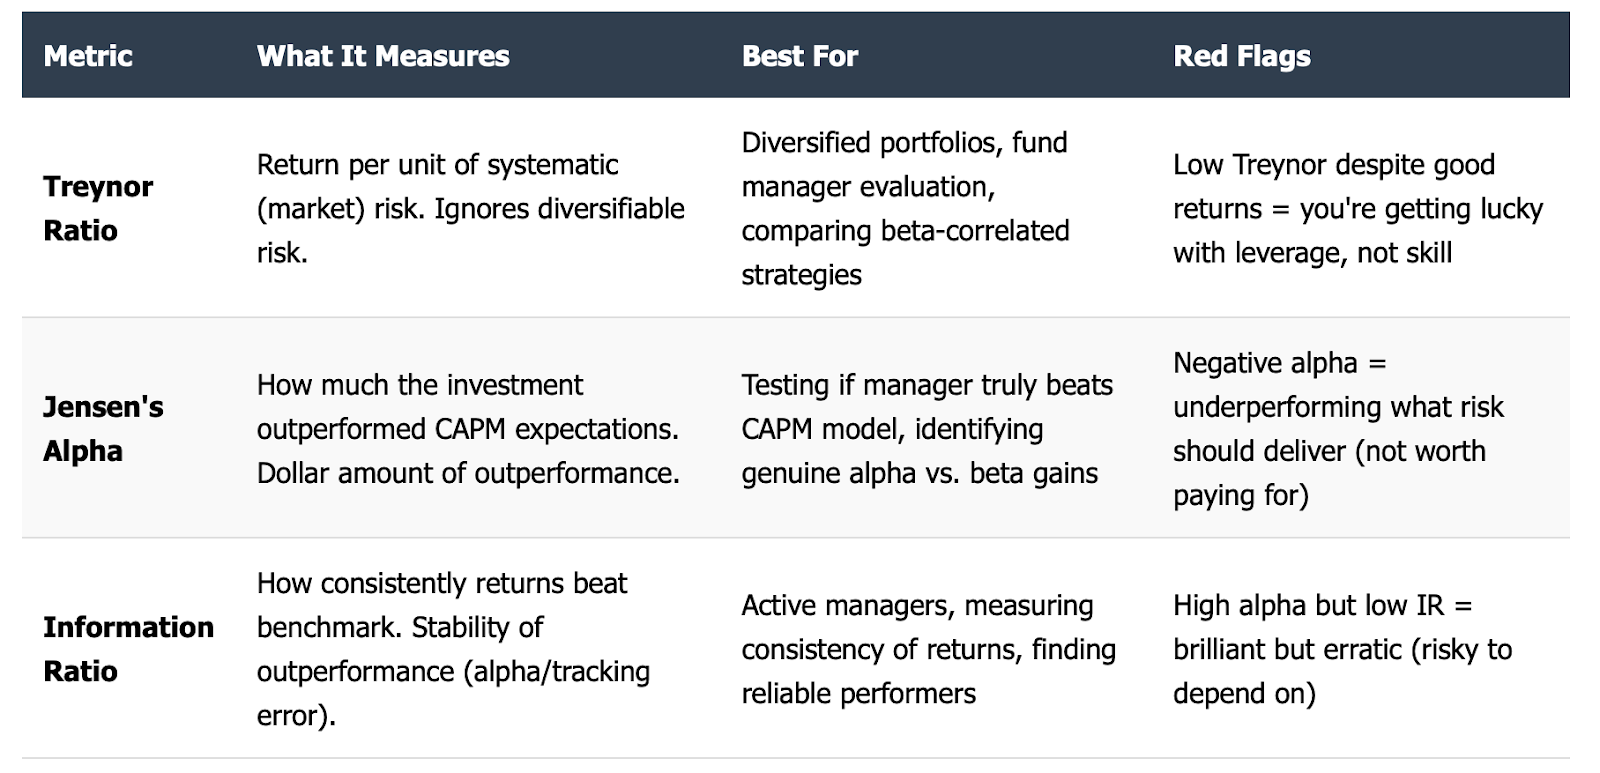
Information ratio measures how stable an investment return is above its benchmark.
For a fund manager:
-
High Treynor but negative Alpha? They're taking smart risks but underperforming the CAPM. Probably not worth hiring.
-
High Treynor, high Alpha, low Information Ratio? Brilliant but erratic. Risky to depend on.
-
High Treynor, high Alpha, high IR? That's your manager. Keep them.
11. What's a Good Treynor Ratio Anyway?
In a short answer, a return above 8% is considered to be good, while a return above 10% is considered to be very good.
However, it does depend on the context. While interest rates were low in 2021, the expectation of "good" changed. With high interest rates today, that definition tightens.
Can you have a negative return? Yes, because if you are taking a risk with your money but are not getting any higher returns than if you had your money in a risk-free investment, it is a sell signal. Stop Immediately!
What about cryptocurrency? That is not really true. The beta of Bitcoin is erratic and incorrectly measured. The beta of asset types like Bitcoin utilises methodology based on assumptions of a specific market that simply do not exist in the cryptocurrency space; instead, they rely on alternative methods when valuing a digital asset.
The Bottom Line
It is easy to falsely report returns. Simply take more risk. The Treynor Ratio removes this illusion. It tells you if you are really producing alpha or simply beta amplification with a good story.
With so much concentration in Technology and macroeconomic uncertainty in 2026, this distinction is even more important than ever. Those who focus on the Treynor Ratio will create sustainable, actual outperforming portfolios; those chasing absolute returns will eventually fail.
Make your choice of which category to put yourself in. Your future will appreciate it.
Start Measuring What Actually Matters
Are you using the correct portfolio strategy? Stop guessing and find out if your current strategy is successful. Use the TradeWill Treynor Ratio Calculator to evaluate all positions in your portfolio and discover which investments have real alpha potential within them.
Calculate your Treynor ratio free on TradeWill and see if you're earning your risk, or just earning volatility.
Disclaimer: The content of the blog does not represent any position of Trade W, does not serve as any trading-related decision advice, and does not endorse any third-party.