

 Trade W

For centuries, traders have used candlestick charts to analyse market trends, and there are many reasons for this. Every candle illustrates who had control during that trading session, how far they drove the price, and if they could sustain that control.
As you evaluate a series of candles, you begin to see patterns develop; one of the most reliable of these is called the tweezer bottom pattern. The majority of trading opportunities arise from reversals in the price trend, so knowing when a price drop has ended can lead to tremendous profits. This is exactly what the tweezer bottom candlestick pattern shows you.
This guide provides an overview of the anatomy and implementation rules associated with this pattern from a technical analysis perspective. It is one of the most straightforward patterns a trader can use; however, it is not always successful on its own. Elements such as context, confluence, and discipline are equally important to consider while trading.
What Are Tweezer Bottom Candlestick Patterns?
A tweezer bottom candlestick pattern is two candlesticks that signify a bullish reversal and comprise two candlesticks that have the same low price point. The tweezer bottom pattern occurs at the end of a downward trend and indicates a lack of selling pressure in the market.
The first candlestick is usually bearish, closing close to the bottom of the range. The second candlestick, although opening at the same low as the first candlestick, has a strong bullish close.
The second time sellers tried to push down the price, they could not. Therefore, the second candle's closing price is an indicator of strong buyer activity, which will be the point of confirmation of the reversal of the price trend.
The tweezer bottom candlestick pattern's name is derived from its similar appearance to a pair of tweezers, with the two equal tips pointing downward. Without the two equalities, the pattern is not a tweezer bottom but rather simply two random candlesticks.
Tweezer bottoms can be located in currency pairs, cryptocurrency market, commodity CFDs and equity index markets, as the underlying psychology is the same for all markets, as they are driven by the same human behaviour of all market participants.
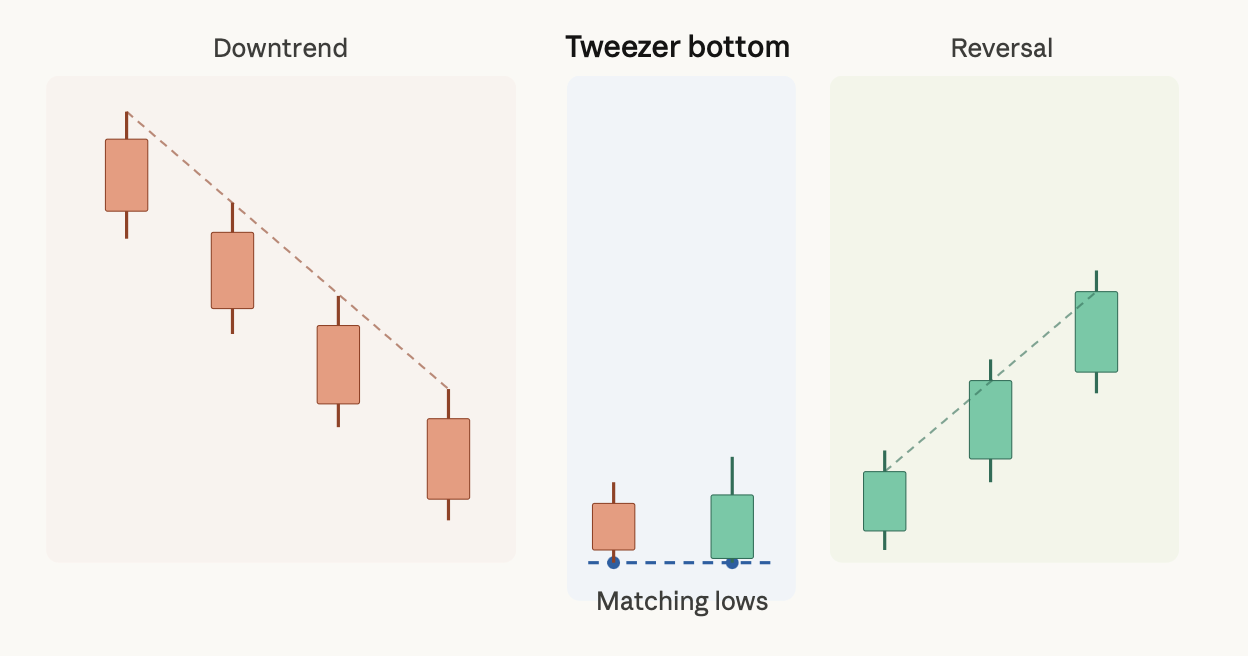
How to Identify a Valid Tweezer Bottom
Identifying price formations correctly is crucial. Many traders look for two candlesticks that have equal lows and call this a tweezer formation. However, in this situation, it is more important to focus on precision than on approximation.
The non-negotiables:
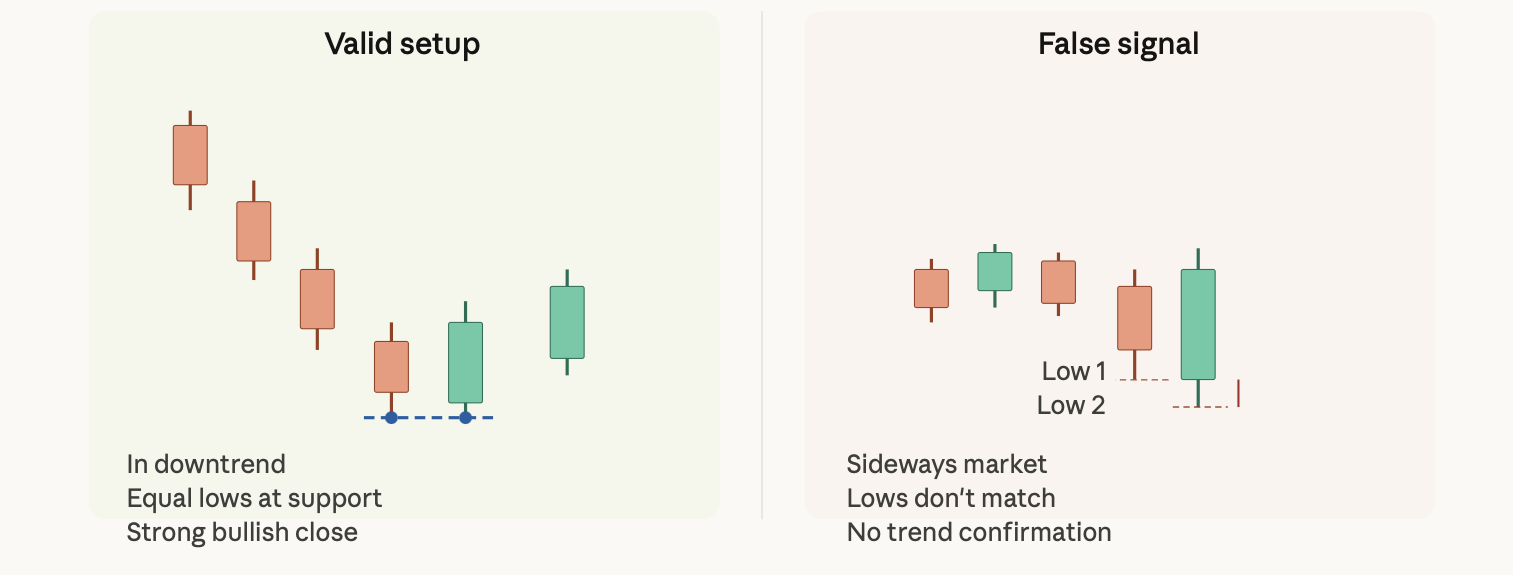
Two candlesticks must make up the pattern exactly. The lows of both candlesticks must be very close together; that is, their wicks must be at or nearly at the same level, with only a few pips or ticks between them. The first candlestick must have been bearish; it must have opened above its low and closed below its high.
The second candlestick must have opened at the same price as the first candlestick’s low and either closed at the open of the first candlestick’s low or showed significant rejection of price. When the second candlestick is bullish, it is your best friend with a tweezer bottom.
The tweezer bottom needs to form within a confirmed downtrend condition. If you see two candlesticks with equal lows in a range-bound or choppy market, disregard this as a tweezer bottom because the overall downtrend context gives this signal its validity and weight.
The strength of a tweezer bottom equally depends on its distance from a key support level. The strongest tweezer bottoms do not form at random locations on the price chart; rather, they form at historical buying support, at key levels of support, at round numbers, and at prior swing lows.
Ideal timeframes for trading this pattern:
The 1-hour timeframe (H1) has a lot of setups, but also has a lot of noise. The pattern works well on the 4-hour (H4) and Daily charts because the lows of the pattern are much more structurally sound, and the price action that follows tends to be cleaner. New traders should start with the H4 and Daily charts until they have learned what a quality setup consists of.
How to differentiate from random double lows:
In a downtrend, double lows can be formed simply by any normal fluctuation. When trading the tweezer bottom formation, the second candle's low must be confirmed with a bullish close to be valid, while a second bearish candle matching the low of the first candle would constitute continuation of the downtrend only. The key element to the tweezer bottom being a reversal pattern is that the second candle closed above the prior close of the first candle, showing that buyers have entered the market and are now in control of the price, preventing further declines.
Why the Tweezer Bottom Works: Seller Exhaustion and Market Psychology
All price patterns demonstrate the battle of buyers vs. sellers. If you understand what actually occurs during a tweezer bottom, you can become much better at trading by reading the market as a story rather than purely following signals without comprehension of what is actually happening.
Sellers are in control of the market when the market is trending down. Each candle made a lower low; sellers have sold into every rally, and there was nothing left to sell; buyers were thrown out. Finally, we arrive at a significant level of support.
The first candle of the tweezer bottom plays out as expected: sellers took down the candle and closed at the bottom of the candle for the session.
The second candle is when the story changes: price opens at the previous session's low, which is the same level that sellers thought needed to hold in order to continue to control price.
However, instead of breaking the prior low, buyers began to absorb all incoming sell orders. As sellers pushed down the price, buyers held the price from moving lower. After buyers accumulated all sell orders they could, buyers pushed back against the downward trend.
Sellers are exhausted; the market is telling you that sellers who have been willing to take the price down have now run out of every ounce of "ammo" they were willing to risk. Sellers have attempted to take out the level they could not take out twice and have failed to break. This second failed break should be an important price for you as a trader.
Short squeeze effect: Traders using stop losses will have them above the support, right below the level of support. As the price begins to move back up after failing to break support for the second time, it triggers those traders' stop losses (in order), thereby providing momentum for the reversal of the price. What began as a consolidation of the price began to change into a momentum shift, with the short squeeze providing even more volatility to the price.
Institutional footprint: All large institutions will not buy at once; they accumulate their position over a period of candles using the support area as their key level to accumulate. The two-candle formation of a tweezer bottom is a tell-tale sign that a large institution has accumulated enough of their position to begin a momentum push upward; candle 1 is when the institutions begin to absorb shares, and candle 2 is when they have completed or confirmed their accumulation and momentum shifts.
More importantly, the tweezer bottom is not simply two candles with matching lows; it is proof of an actual shift in control during the exact moment of price.
Building a High-Probability Setup: Confluence Matters
While the tweezer bottom can produce good trades when used individually, the best trades come from stacking evidence. The concept of Confluence refers to having multiple separate reasons pointing to the same conclusion.
Start with location: The pattern must be developed in either a demand zone or at a key support level. A tweezer bottom created in the middle of a chart with no structural foundation around it is much weaker than one formed precisely at a level that price has previously hit already six weeks prior. Each signal will get upgraded with a location.
TDI indicator confirmation: The Traders Dynamic Index is based on the RSI line with smoothing. In using the TDI as confirmation, when the green signal line drops below the oversold mark of 32 and produces a "shark fin" shape, curling back up from below, it is a signal that your candles are confirming an increase in momentum towards the same direction you believe your trade will head towards. It is not a substitute for what is happening regarding price action, but rather a second opinion.
Multi-time frames alignment: Establish the pattern on the H1 chart. Then take a look at the M5 chart to find your precise entry. When you have the tweezer bottom at support on the higher timeframe while starting to show signs of bullish momentum on the lower timeframe, then you are receiving the same message with two different perspectives and are able to trade that with a lot of confidence.
Having a pattern in isolation is merely a hint; whereas when you have a pattern with demand zone support, confirming indicators of oversold condition, and multi-timeframe alignment, it becomes a trade.
Entry, Stop Loss, and Risk Management
This is one of the biggest benefits of using the tweezer bottom pattern when trading - it provides a helpful structure for each of the elements of your trade setup.
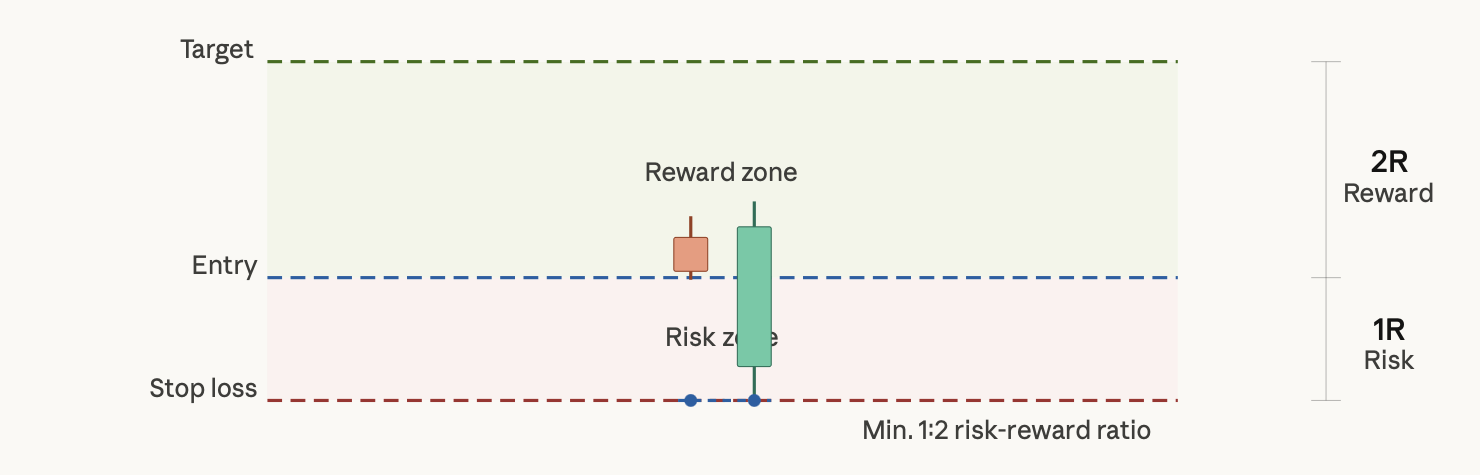
Entry Timing: You should wait until the second candle has completely closed before entering your trade. Entering during the middle of the second candle will yield no confirmation; however, some traders will choose to enter on a break above the first candle's high, providing them with a third level of confidence in their trade. This entry would come slightly later than the previous entry method; the momentum behind this trade will be much stronger.
Stop Loss Placement: You will want to place your stop loss just below the matching lows and give yourself a few pips of space or breathing room for your stop loss. This is the level at which you will invalidate the tweezer bottom pattern. If the price breaks below the matching lows of the tweezer bottom pattern, you will need to exit your position ASAP, as this would no longer be a valid pattern. The stop loss will be defined. A strong reason for using the tweezer bottom pattern is its defined stop loss.
Target Selection: Your first logical target for taking profits when the price reaches the previous resistance level or swing high will be. Sellers have previously entered their sell orders at this level, and it will also provide a price target that the price can reach before hesitating again. You can use Fibonacci extensions or harmonic pattern price targets to determine where you would expect to take profits while in trending markets as well.
Position sizing: If you want to use position size correctly, set your risk for every trade at one to two per cent of your account. You should then adjust your lot size to be able to lose that exact amount if the price hits your stop. Trades in volatile markets like crypto will have larger stop losses, which cause you to use a smaller position size so the percentage of your risk stays the same. You should never use your confidence level in the trade to determine how much you are going to use to position yourself.
If you have a high confluence tweezer bottom setup, you can get a 1 to 2 risk/reward ratio very easily. At a 1 to 3 risk/reward ratio, even with a 40 per cent win rate, you will ultimately have a profit in the end.
Tweezer Bottom and Bullish Pin Bar Market Reversal Patterns - Know The Difference
Both of these patterns represent a market reversal at support; both of these patterns show a rejection of lower prices. However, they differ in terms of their structure and the amount of time it takes to complete the signal.
A bullish pin bar pattern is one candle with a long lower wick with a small body that is towards the top of the range of the candle, and completes the rejection of price within one candle. Bullish pin bars are quicker to form than the tweezer pattern because they are created faster, therefore giving a signal faster, and the downside to this is that the signal is not backed by any other price activity.
The tweezer bottom pattern is a two-bar pattern. One will fail at the resistance level, then the second will try to test that low for a second time, and once again will fail to go lower and then will reverse the trend.
So this process of two bars is what traders refer to as "confirmation", and since they have another chance to go lower and didn't, the two-bar pattern provides a stronger case than the single bar pattern via the additional confirmation candle.
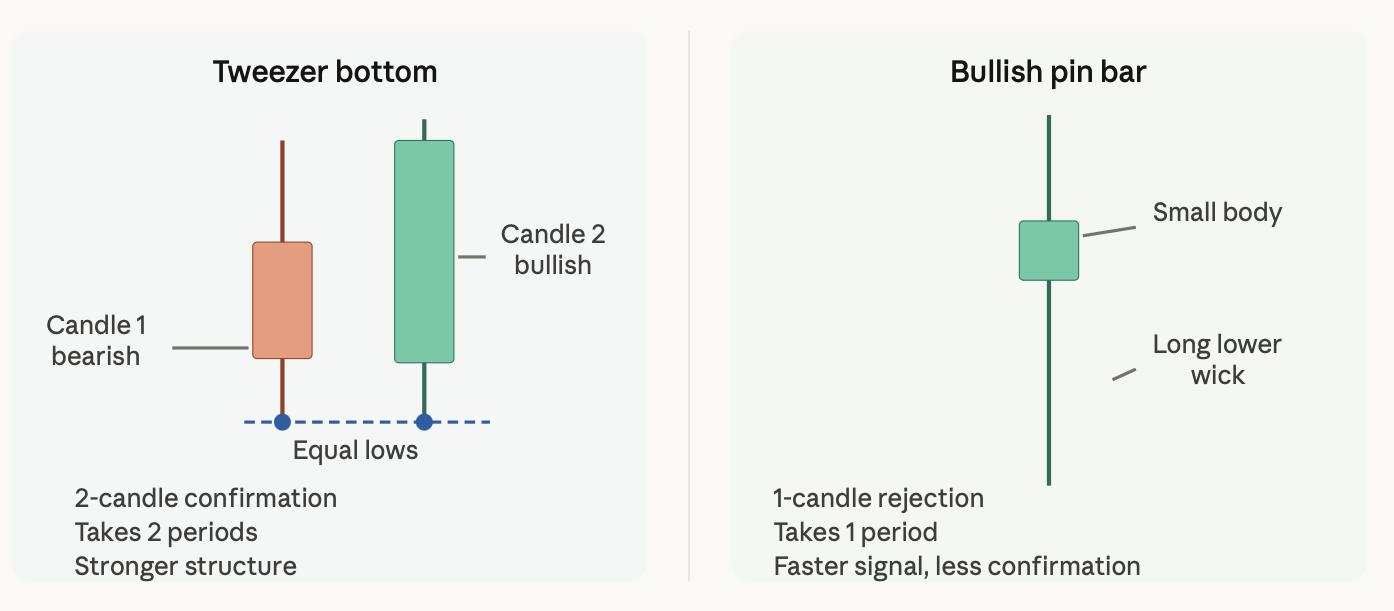
In trending markets where momentum is present, pin bars often show the same level of effectiveness as in trending markets but produce sharper and more decisive single rejections. In choppy markets, tweezer bottoms use two candles to create more filtering on the available noise. You should have both pin bars and tweezer bottoms as part of your trading arsenal and use them with demand zones, multi-timeframe alignment, and clear trend direction.
Common Mistakes That Kill This Trade
Trading in sideways markets is a bit more difficult than trading in trending markets. The tweezer bottom is a reversal pattern, and therefore needs to have an existing trend to be able to reverse. You cannot have a valid tweezer bottom unless there is a downtrend first. That's it.
In addition, don’t worry about how far apart the lows are. If the two lows are about 10-15 pips apart on a daily chart, that’s absolutely fine. However, if they're 40 pips apart, then the matching lows criteria are not met, and therefore, this pattern has no way to provide you with a structural meaning. You must be strict regarding this rule.
Another error that traders make involves entering before the candle is closed. Traders see the second candle starting to move up; so they enter, and then that candle pulls back and closes down, thereby confirming that the tweezer bottom was not valid. Again, you must wait for the close.
If the tweezer bottom forms in a vacuum, with no meaningful support beneath, then it is a very low probability setup. The tweezer bottom gives you an indication that the sellers have failed, and the support tells you why the sellers have failed to continue in the trend. You must have both.
Another mistake that traders tend to make is that they skip entering their stop loss in the trade once they enter the trade and the tweezers bottom. The tweezers' bottom will produce the best location for your stop loss. If you place your stop loss correctly, therefore, and your trade fails, as trades do, you are protected from further loss from the failed trade. This is simply the nature of trading.
Tweezer Bottoms in 2026 Markets: Gold, Stocks, and Indices
Macro variability has been at the forefront of the market, with the release of the Consumer Price Index (CPI) as well as central bank decisions and events that have taken place around the globe, resulting in very quick, large moves across all different asset classes. This is the type of environment in which tweezers work the best.
Gold (XAUUSD): When there is a surprise in the inflation data, gold will react with very large spikes in either direction, then attempt to stabilise. The low-volatility/high-volatility pattern is a very classic tweezer bottom environment. Look for potential tweezer bottom setups in the areas of key psychological levels like the round numbers of 2800, 3000 or 3200, where institutions define their risk.
Blue Chip Names: Large-cap panic selling creates exceptional tweezer bottom opportunities as it relates to the stock market. This will occur when the global markets overreact to a news event that causes a major sell-off below key support, but then reverses back up. The tweezer bottom pattern appears consistently and provides accumulation of shares for larger investors, while providing retail traders the ability to participate in the same opportunity as opposed to chasing price movement.
Major Indices such as the Dow Jones and Nifty 50 exhibit textbook tweezer bottoms on the daily chart after there are oversold readings due to geopolitical shocks and Federal Reserve communications.
Take a moment to pull your TradeWill Charts and review the past month of price action on the DJIA (Dow Jones Industrial Average). Identify every valid tweezer bottom that occurred near significant support. Observe what occurred after the formation of each tweezer bottom, and it will be obvious how well-defined the pattern is.
From Entry Signal to Long-Term Capital Growth
A single pattern isn't what's needed for successful trading. A successful trading strategy would include executing all individual trades according to the original trading plan in a disciplined manner while thinking about how one can continue to grow their account through compounding.
An individual tweezer bottom setup represents an individually executed trade. The amount of buildup of equity that one will accumulate from this individual trade over a period of time is based upon one executing this same tweezer bottom setup without deviation in execution and controlling one's risk appropriately by allowing the winners to run out to their targets, by cutting losers as quickly as possible, and by only risking a very small amount or percentage of the account on any individual trade.
This is where a trader can also begin to think about their trading through the CAGR. A trader who executes trades that create very small to modest gains, but very consistently and with proper risk control, will frequently outperform a trader attempting to create very big gains but without any discipline or risk control.
In order for a trader to create a long-term successful growth pattern, the trader must not only have an edge in their trade execution but also compound that edge over several hundred trades.
Frequently Asked Questions
Are tweezer bottoms reliable reversal signals? They're solid when used correctly, meaning in a downtrend, at support, with a strong bullish second candle. On their own, without confluence, reliability drops significantly.
Which timeframe works best? H4 and Daily are the most reliable. H1 works but requires more filtering. Avoid M5 and M15 for this specific pattern.
Can they be used in crypto? Yes. Crypto markets are highly volatile and produce sharp support rejections. The pattern performs well in crypto when combined with strong demand zones.
What's the difference between a tweezer bottom and a double bottom? A double bottom is a multi-day or multi-week chart pattern with a distinct valley shape. A tweezer bottom is a two-candle formation, much shorter in timeframe and more precise in its low matching.
Does volume matter? Higher volume on the second candle, especially toward the close, strengthens the signal considerably. It confirms that buyers are genuinely entering, not just momentarily absorbing sellers.
Should beginners use this pattern alone? No. Always combine it with at least one additional factor, a support level, an oversold indicator reading, or a multi-timeframe confirmation. Patterns in isolation invite overtrading.
Is it better than a pin bar? Neither is universally better. The tweezer bottom offers more confirmation through its two-candle structure. The pin bar is faster. Use both, and let context decide which is more relevant to the trade setup you're analysing.
Ready to put this into practice? Open TradeWill's multi-timeframe chart view, pull up your preferred market, and start marking every tweezer bottom that appears at a defined demand zone this week. Track what happens at each one, and you'll build real intuition for the pattern faster than any amount of reading alone will give you.
Disclaimer: The content of the blog does not represent any position of Trade W, does not serve as any trading-related decision advice, and does not endorse any third-party.