
 Trade W

Candlestick patterns convey price actions through stories. Although they cannot predict future price movements, candlestick patterns provide insight to current buyers and sellers. Fewer candlestick patterns convey this than the Tweezer Top candlestick pattern.
When trading Forex and CFDs, you may have experienced a potential uptrend that reversed unexpectedly and might wonder what you missed. Usually, there was a soft angle of change trend, but it may not have been recognisable without proper context.
In this guide, the Tweezer Top candlestick pattern will be examined in detail so that you can learn what it is, why it occurs, and how it relates to Supply & Demand Zones and Order Blocks. Additionally, you will learn how to create a trade plan to generate clean entries, stop-loss and target prices. Whether you’re new to trading or just need to enhance your existing edge in trading, the Tweezer Top pattern should be added to your toolbox.
As a first point, no candlestick pattern is perfect in isolation. The best way to trade Tweezer Tops is when they fit within the context of overall market conditions on higher timeframes, with confirmation from high volume and a momentum signal. All of this will also be discussed.
What Is the Tweezer Top Candlestick Pattern?
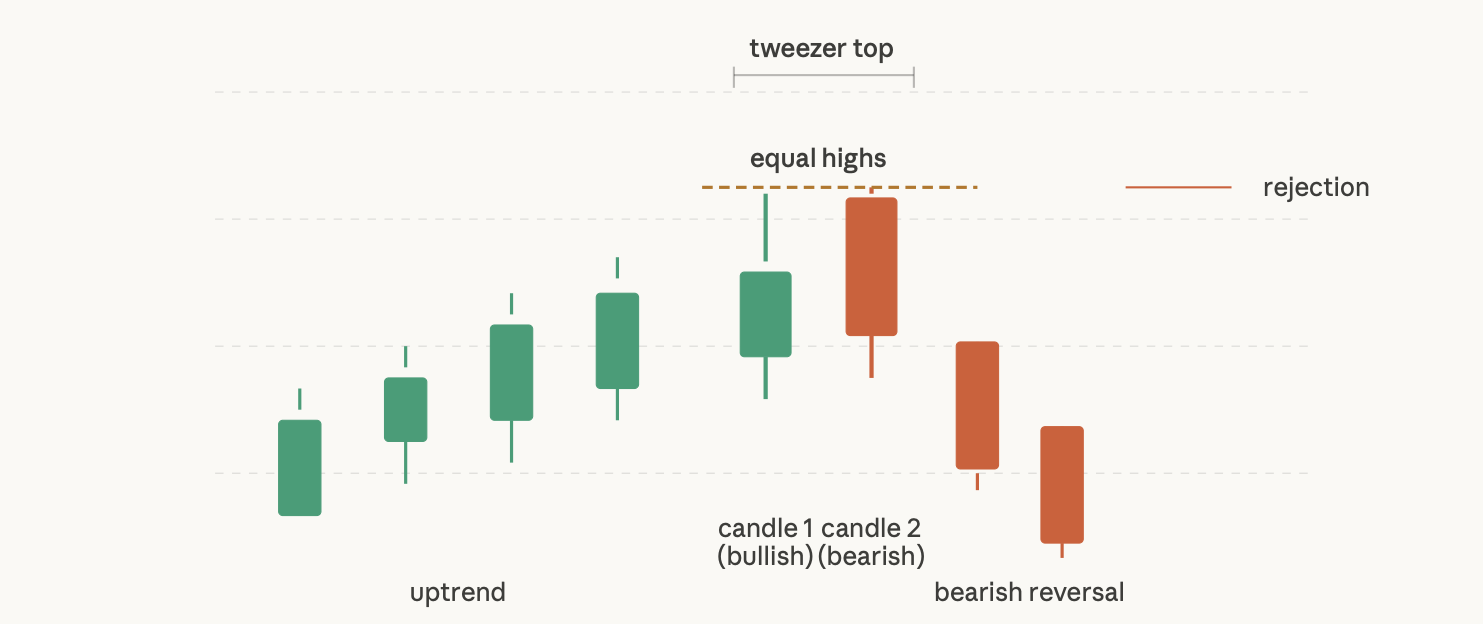
A Tweezer Top is a bearish reversal market pattern formed by two consecutive candles that have created very similar highs, and thus signifies a bearish reversal.
A sample bearish reversal example would be a stock that reaches $50 on a Monday, slightly back, and then returns on Tuesday but without breaking the price. If the level opens lower on Wednesday, the price will continue its decline.
The pattern consists of the two matching highs, and when the price does not move higher, a signal is generated.
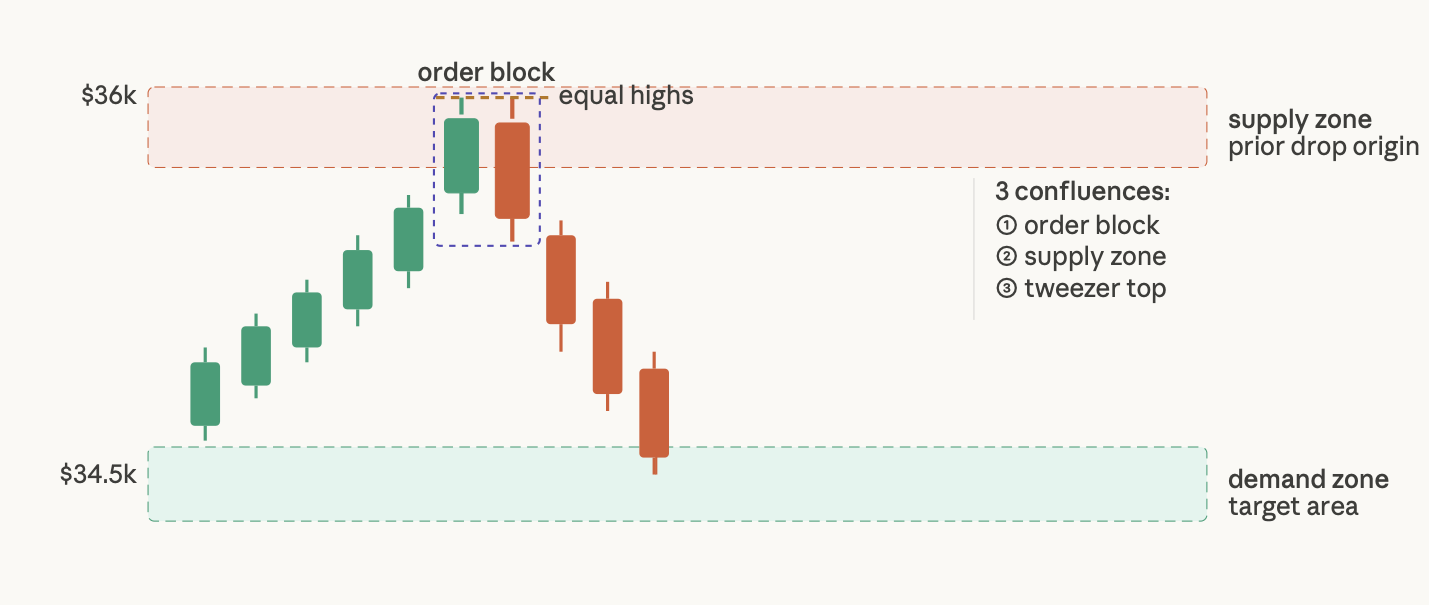
In the cryptocurrency market, there may be a scenario where BTC/USD hits $36,000 on a Tuesday, retests again at $36,000 on a Wednesday, and then drops to $34,500 by Thursday. Therefore, the two-candle pattern created at the level of resistance, combined with the inability to break the level of resistance, is an example of a Tweezer Top.
How well the market functions psychologically must also be taken into consideration. The first candle demonstrates the existence of bullish momentum. The second candle shows that bullishness is unable to carry through, and thus, no further highs can be achieved at that level.
When institutions that accumulated shares during the uptrend start to sell their positions at that level of resistance, retail traders who believe in a breakout will be trapped. Once the price drops below the previous low established by the two-candle pattern, sellers start to enter the market, triggering a momentum shift in price.
How to Identify a High-Probability Tweezer Top
All double highs do not qualify as valid, high probability Tweezer Tops (Ttops).
Two Candle Setup: The first candle must be strong, close to a new high. The second candle should open at approximately the same level as the first, reach approximately the same new high, and then close lower as a bearish candle. The two highs do not need to be close to the same pixel-perfect level, but they should be at least close enough to see that the price is being rejected in that area twice.
A valid high probability Tweezer Top must have an upward trend behind it. A Tweezer Top found during the middle of a sideways price pattern is noise, but has more significance appearing after the completion or establishment of a sustained rally.
Wicks provide a clue; if there are long upper wicks, this is an aggressive rejection by sellers; if there are short upper wicks and a bearish close, that would still be a valid partner to this setup; also,o some degree of bearish rejection would exist.
The Confirmation Candle that follows this pattern must bear a bearish close in order to provide confirmation; once the pattern has printed, then at the low of the two candle high printing, if there is a breakout below the previous low, that confirms the reversal.
Volume is also at a relative extreme for the second candle; in this instance, during the down share, the second candle formed via volume on the downside move clearly demonstrates the number of sellers that were willing to sell.
An illustrated example: On the daily chart of (ETH/USD, the price broke the $2300.00 level down to the new $2200.00 price level within the next three-day period, creating a Tweezer Top pattern. The second candle was bearish, and volume spiked during the downside; therefore, prior to the price, the notes would confirm the reversal.
Combining Tweezer Top With Supply/Demand Zones
What is a tweezer top alone? Only something worth considering. Once it exists inside the supply zone, it is a trade to take seriously.
Supply zones are areas on a chart where the price has fallen significantly before. The fact that there was such a drop indicates to us that institutional selling was active at that price level. If price returns to that zone, those same sellers often return. A tweezer top happening within that supply zone provides us with two independent reasons to assume that there will be a reversal.
Once we utilise a multi-timeframe approach, we can get even more precise. Using the daily timeframe, we are able to establish where the supply zone was and where the tweezer top is located. Dropping down to a 15-minute timeframe enables us to establish an entry point by waiting for the close of a bearish candle inside the supply zone or for a break below the most recent short-term low.
Order blocks further refine our points of confluence. An order block is the last bullish candle prior to a strong bearish move. When a tweezer top occurs at an order block that exists within a supply zone, we have multiple points of confluence from three separate tools pointing us to the same reversal point. This is where we find the highest probability set-ups.
The example of BTC/USD at $36,000 is a good one: The price of $36,000 had a supply zone from a prior price drop and formed a tweezer top right at that level before experiencing a pullback to $34,500. The supply zone provided validity to the pattern, and the tweezer top provided a trigger to the supply zone.
Building a Trade: Entry, Stop-Loss, and Take-Profit
Identifying a pattern is only part of the process, so let's look at how we actually execute the trade.
Entry: You have two valid entry choices. The first option is to enter at the close of the second bearish candle, accepting that you're taking slightly more risk by entering earlier than you would if you waited for tomorrow's price to break below the low of the two-candle pattern, therefore confirming your risk before entering. Generally speaking, conservative traders prefer to wait until confirmation before entering the trade.
Stop-Loss: Set your stop-loss order 5 to 10 points above the Tweezer Top high, thereby giving your trade some breathing room, while keeping your loss defined in the event the pattern fails. If the BTC/USD price is at $36,000, the profit level would be set at $36,200.
Target: For your target, look for the next Demand Zone below current pricing. Since buyers are expected to come in at the Demand Zone and push prices higher from that level, that would be a logical place for you to close or reduce your short position. The next significant Demand Zone for BTC/USD was $34,500.
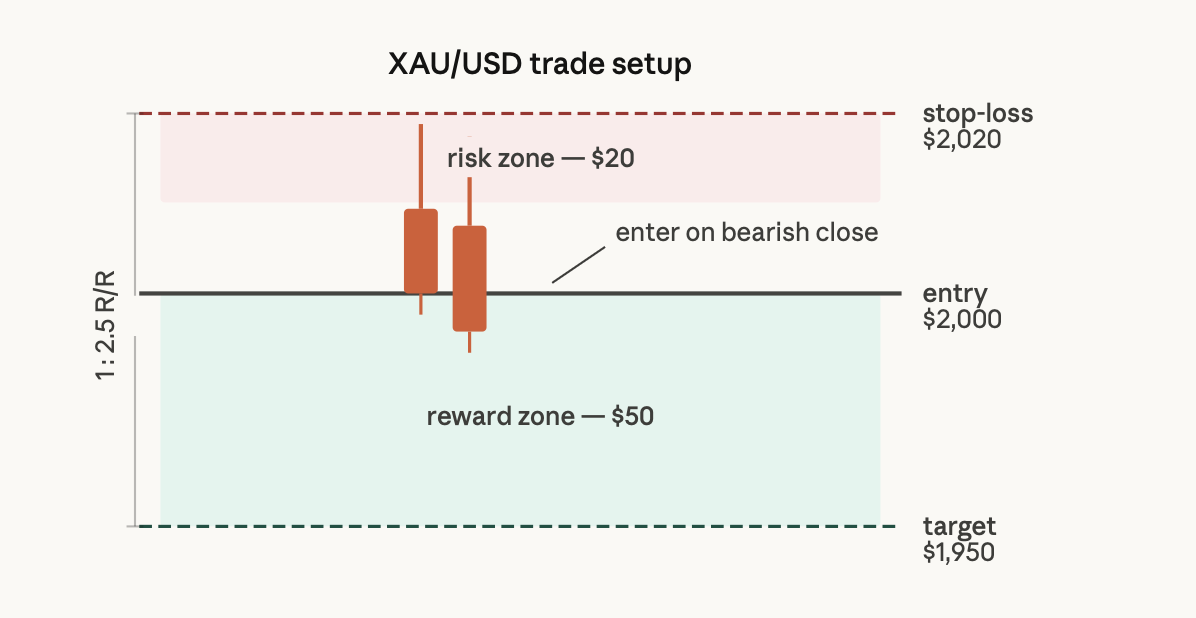
Using Gold (XAU/USD) as an example, if you had a Tweezer Top price at $2,000, with your stop place at $2,020 and your target set at $1,950, you would have established a clean 1:3.5 risk to reward structure with that trade, which is the kind of structure that will allow you to make it through all of the inevitable losers, and still show a profit overall.
Multi-Timeframe and Volume Analysis
The enemy is false signals. Using daily, 4-hour, 1-hour, multi-timeframe analysis and incorporating volume context will help you cut through many false signals and identify real ones.
Using the daily chart, you mark your Supply Zones and find your Tweezer Tops to identify where you're at in terms of meaningful price levels. Once this is established, you can step down to the 4-hour or 1-hour chart to check how the price is acting as it approaches your Supply Zone and also see if there is conforming price action that is happening on the lower timeframe that corresponds with your daily Tweezer Top.
While you're using price action, you can also use RSI and Stochastic to add a second layer of confirmation. For example, if you see RSI greater than 70 happening on the same candle as your daily Tweezer Top, then it shows that overbought conditions have been reached.
If, when the second candlestick is formed, you see RSI curl down off of the first candle, then you will have divergence in price with the momentum curling down. This means you will have a secondary confirmation of the signal you receive from price action.
For the ETH/USD pair, for example, if you have a daily Tweezer Top that has an RSI of 80 with a Stochastic crossover showing bearishness, then you have greater conviction about going short based solely upon candlesticks.
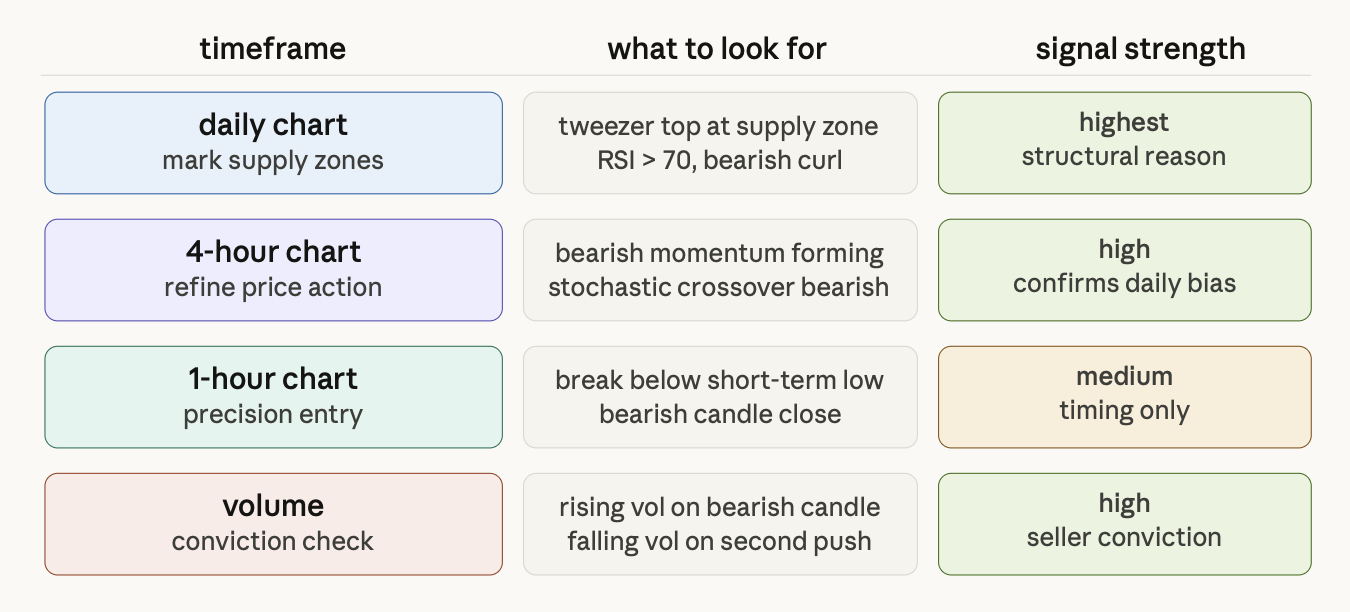
Volume should also be discussed. If the second push to the Tweezer Top high is made on falling volume, then buyers are losing their conviction. If the second push during the bearish close is on increasing volume, then sellers are coming into the market with a large force. This, combined with the previous two examples, will give greater reliability to the setup.
Avoiding Bull Traps and False Breakouts
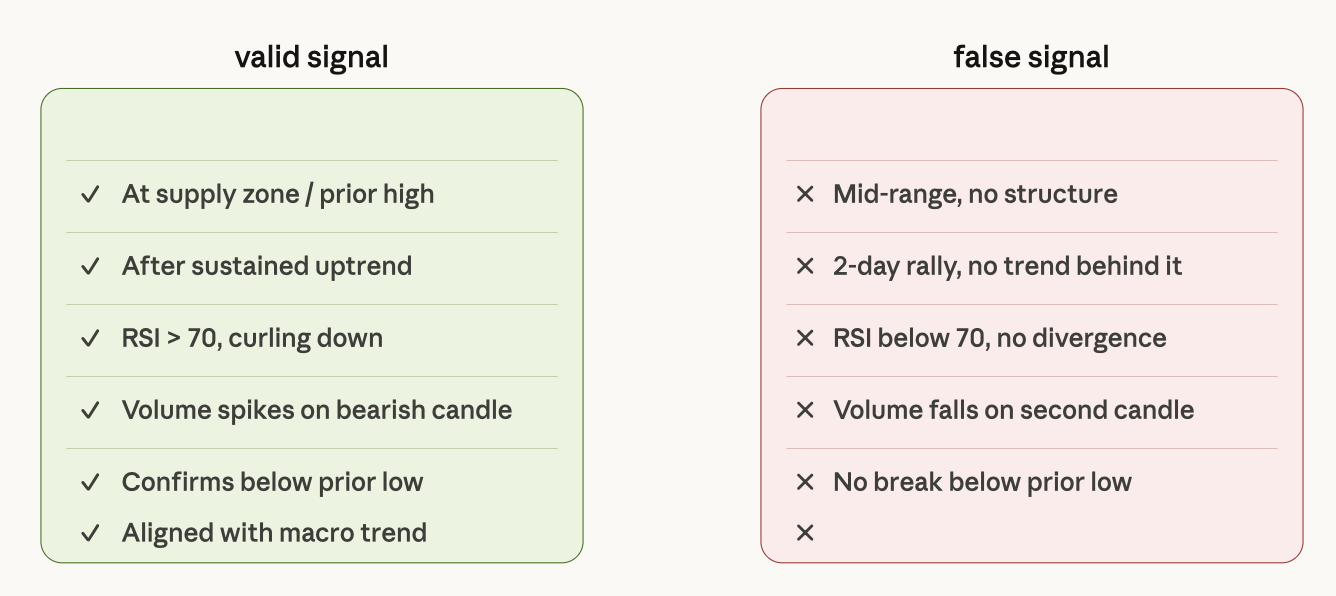
Tweezer Tops do not necessarily imply a market reversal will occur. Here are ways to determine if a Tweezer Top is a legitimate reversal pattern or a weak reversal signal.
Location Matters: A Tweezer Top formed in the middle of a trading range and at the end of a small, two-day rally is different from a Tweezer Top formed at a clear upward peak and within a Supply Zone. ONLY take the Tweezer Top pattern seriously if it is formed at a structurally significant price level.
Context Matters: Is the asset in a significant macro in an upward direction? What are the broader market indexes of choice doing? (e.g., S&P 500; Bullish BTC; DXY) The broader market context matters: a Tweezer Top against strong macro directional force is a more difficult trade than one aligned with macro directional forces.
RSI Confirmation: If an RSI is higher than 70 and turns down with a Tweezer Top, that is a significant confirmation. If the RSI is below 70 with a Tweezer Top, then that is not a significant confirmation.
Using the Put-Call Ratio as an additional sentiment layer for equity traders to analyse the DJIA as a way to confirm bearish sentiment ratings. When a put-call ratio becomes extremely low, i.e. bullish – everybody is long, and nobody is hedging at a Tweezer Top of a DJIA blue-chip stock, then that will increase the signal odds for bearish trades.
For DJIA, consecutive peaks at a significant resistance level in conjunction with RSI equal to 80 forming a Tweezer Top pattern have typically revealed a reversal from bullish to bearish price action. Although the probability for short-term bearish price continuation is not 100% certain, the convergence of this type of pattern provides a higher probability of achieving short-term reversal gains.
Risk Management: The Trade Plan That Keeps You in the Game
Without a risk management plan, even the best trade setup in the world is going to fail. Here is the complete outline of such:
You enter the trade after the second bearish candle closes or on confirmation of a break of the previous low. If the trade has already moved down 2% below your trade set-up, you do not chase the price.
The stop-loss will be placed at 5-10 points above the Tweezer Top high, with no exceptions. If the price closes above the stop-loss, your trade is invalidated, and you are out of the trade. This loss is smaller than invalidating the trade after it has already moved to a small loss before invalidation has occurred.
Your target will be the next Demand Zone; you do not move the target up or down looking for more profits; you let the trade reach its logical ending point.
For Gold XAU/USD: entry is on the second candle close at $2000, stop-loss is at $2020, and target is at $1950. The risk is $20 per trade with a reward of $50, giving you a 1:2.5 setup. If you complete this process on 20 trades, your success rate can be below 50%, and you can still generate a profit.
One exception to note is that if you are comparing the Tweezer Top to the Tweezer Bottom, which is its bullish mirror image at the bottom of a downtrend, both patterns are showing exhaustion at a critical level by forming equal highs or equal lows.
Gold and DJIA: Tweezer Top in Real 2026 Markets
Now, let's get into what asset classes that investors are watching now.
Gold (XAU/USD): After a CPI surprise to the upside causes a big jump in price, generally, the initial reaction is bullish. A subsequent †Tweezer Top†, if formed at or near a Supply Zone after this spike up,p tells you that sentiment is mostly priced in, and the professional traders are already exiting.
The major Supply Zone level has been used repeatedly as a site to mark off from to reverse from, and when the Tweezer Top at that level is confirmed by an RSI divergence, that has been an excellent indication of a short-term reversal.
Dow Jones Industrial Average: Regularly, the Blue Chip stocks forming Tweezer Tops at resistance levels is another clear sign that institutions are distributing their stocks. When institutions liquidate large blocks of shares, they do not typically liquidate them all at once; they do so in waves at the same pricing level. This results in the formation of identical or near-identical highs. When these formations are confirmed by a corresponding RSI measurement (above 75), it typically indicates a multi-day pullback will result near the time of the formation of the Tweezer Top.
Harmonic Pattern Alignment: If you trade harmonic patterns, a Tweezer Top formed at the D-point of a Gartley or Bat pattern is one of the strongest formations of all. The D-point alone represents a highly probable reversal area, so when you get a Tweezer Top there, it reinforces the bullish momentum created by the harmonic analysis. Integrating two different types of technical analysis at such a high probability reversal area is incredibly bullish, leading to a strong likelihood that you will make a significant profitable trade if you take advantage of the aforementioned research.
FAQ
What exactly is a Tweezer Top? It's a two-candle pattern where consecutive highs are nearly identical, appearing at the peak of an uptrend and signalling a potential bearish reversal.
How do you confirm the signal is valid? Look for a bearish close on the second candle, a break of the prior low on the next candle, RSI divergence above 70, and the pattern sitting inside a Supply Zone.
How does it work with Supply/Demand Zones? A Tweezer Top inside a Supply Zone means price is hitting pre-established resistance. The pattern gives you the trigger, the zone gives you the structural reason.
Is it useful for short-term trading? Yes, particularly on daily and 4-hour charts. Shorter timeframes work too, but the signal is noisier and requires tighter filtering.
How do you avoid false breakouts? Only trade the pattern at structurally significant levels (Supply Zones, prior highs), confirm with RSI, and wait for the break of the prior low before entering.
Ready to put the Tweezer Top to work? Pull up last month's XAU/USD or DJIA chart on TradeWill and find two live examples using the exact filters from this guide before your next trade.
Disclaimer: The content of the blog does not represent any position of Trade W, does not serve as any trading-related decision advice, and does not endorse any third-party.