

 Trade W

What Are Candlestick Patterns and Why They Matter
Many people may feel confused when first looking at a trading chart with the many colours of candlestick bars going up and down. These candlestick bars are telling you a more extensive story than just the price movement; they represent all of the psychological aspects related to fear and greed for both the buyers and sellers, and how they interact with one another.
A candlestick chart is one of the best visual aids in trading, as it not only shows you the daily open, close, daily high and daily low, but it also shows you the complete picture (bullish versus bearish). By looking at a single candlestick at the end of one trading period, you can see whether the buyers or sellers won that battle.
Candlesticks enable you to see the psychology of the trader; therefore, it is essential to understand how candlestick patterns are formed. For instance, a long green candle with a long upper shadow indicates that the buyers pushed the price up aggressively during that session. On the other hand, a small-bodied candle with long upper and lower shadows indicates indecision between buyers and sellers; both sides fought hard for control, but no one side was able to gain a clear advantage over the other.
Candlestick patterns were invented in Japan during the early 18th century by a rice trader, Munehisa Homma, who used the patterns to predict the price of rice. Munehisa Homma learned that human emotions drive the market and create recognisable patterns. The same patterns that he created all those centuries ago are still used by financial institutions today at large banks and hedge funds to determine when to enter into or exit out of trades.
For those just starting, candlesticks can be thought of as traffic lights for determining your next trade. When you see a green candle, it indicates opportunities for you to enter the market to go long. Red candles indicate caution. Certain patterns serve as yellow lights or caution signs; this type of pattern tells you change is coming.
A good example of this is the EUR/USD currency pair. If a "hammer" candle forms on the EUR/USD currency pair (Eur/US) at a significant support level (e.g., daily support) at the close of the London session, large trading institutions recognize this candle as a potential high-probability reversal point; in other words, it signals that sellers were trying to push the price down, but the buyer's willingness to step in and buy at the close was stronger than the seller's willingness to push down the price.
The components of a candlestick are straightforward; however, they contain a wealth of information. The rectangular body of the candlestick shows you the range between the open and closed prices; the thin lines above and below the candle, known as wicks or shadows, show you the high and low for that type of session.
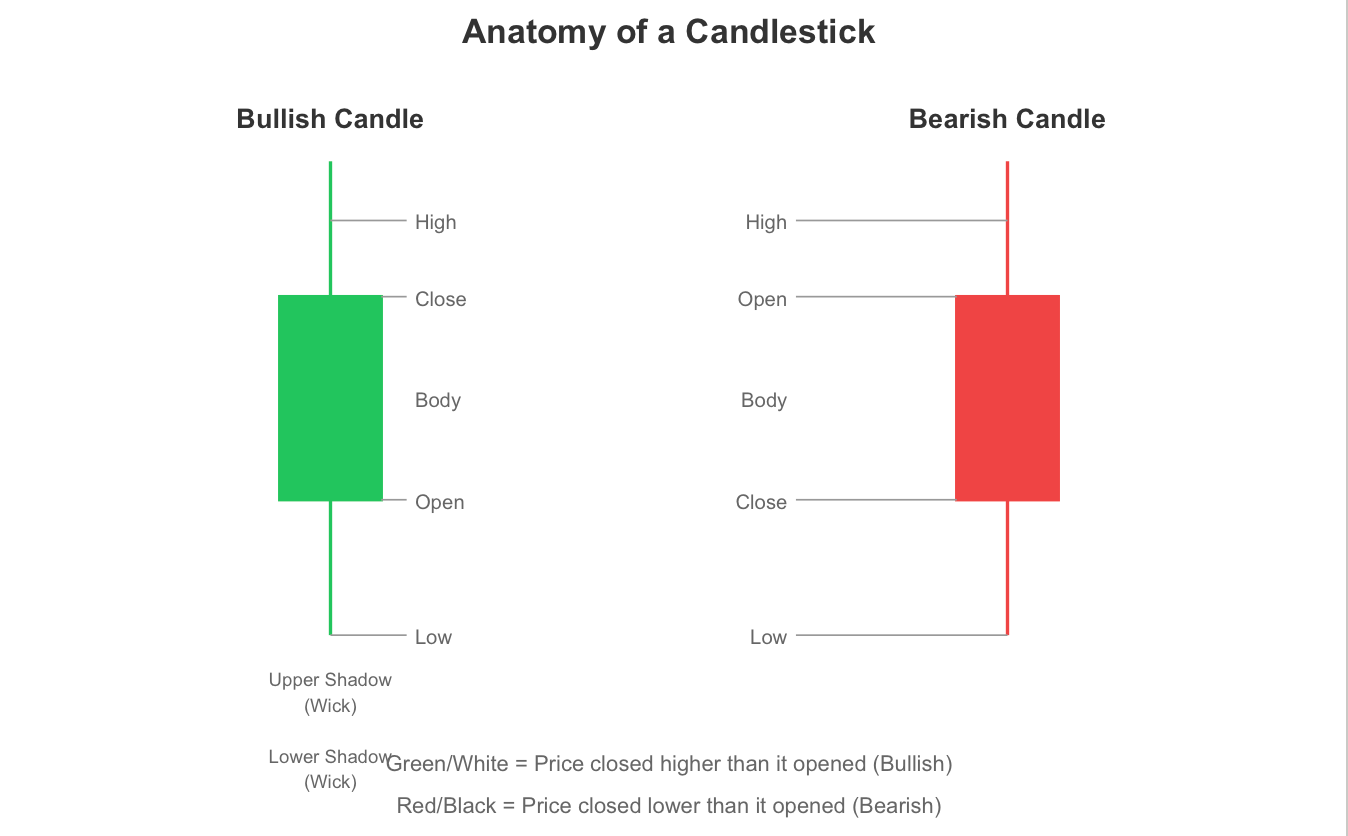
A green or white candlestick occurs when a security closes above its opening price for the day; conversely, a red (or black) candlestick occurs when it closes below its opening price for the day. However, you must go much deeper into your study and understanding of the different types of candlestick patterns to attain a complete understanding of them.
Understanding Core Types of Candles: Essential Candlestick Types You Must Recognise
You need to understand the basics of candle patterns in Forex Trading. Many types of candles can be traded on Forex; however, you will see, when you read the full report, that there are only a few key candle patterns that are most significant to a trader.
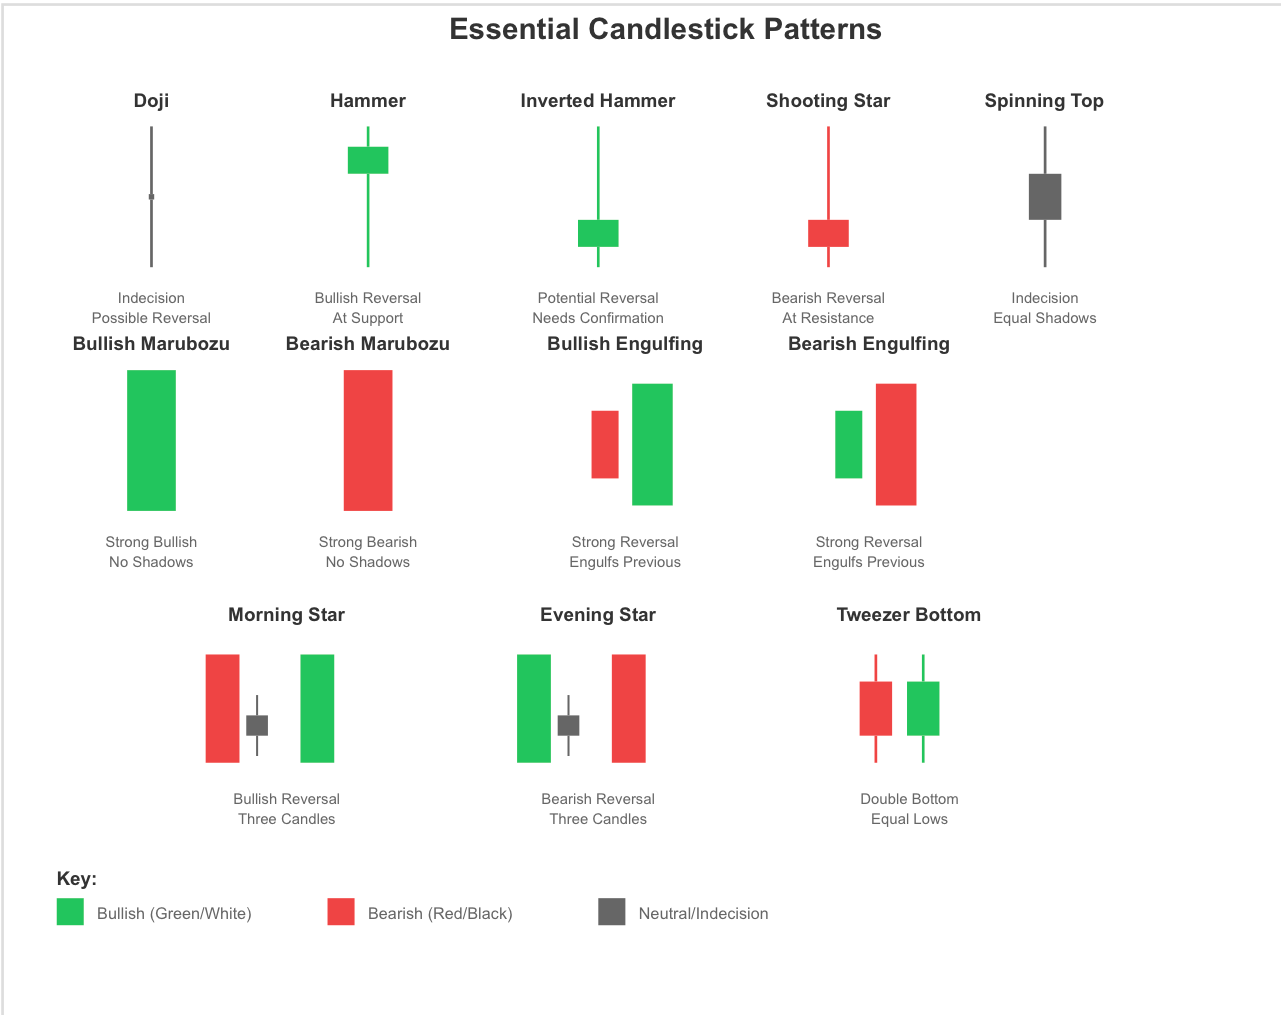
The Doji shows little movement, meaning the open and close have a very small difference between them, i.e. both opened at around the same price point. The best way to think of Dojis is to visualise them as a small ‘tug of war' between sellers and buyers for that trading session. Both teams have equal strength and therefore, no change in price. The Doji indicates that price action may be experiencing an ‘exhaustion of trend' and may 'reverse'.
The Hammer represents the average session of price action over the period that has gone before it. It looks like a hammer; a large, long lower shadow, and a small body near the top of the bar. So, for example, if you see a hammer candle pattern form around a key support area on GBP/USD, it would be a good indication that a downtrend may be ending, and the price is being tested near a low price, but the hammer indicates that buyers reject those lower prices.
The Inverted Hammer candle has a small body at the bottom of the bar and a long upper shadow. The Inverted Hammer candle appears typically at the end of a long downtrend, and is a sign of buyer activity. An Inverted Hammer candle indicates that buyers were attempting to push the price up but met with seller resistance; therefore, while it may indicate a reversal, confirmation would need to be provided by a subsequent candle.
The Shooting Star candle is the opposite of the Inverted Hammer candle; the Shooting Star candle typically appears after a price rally. The Shooting Star candle has the typical pattern of a small body at the bottom of the bar and a long upper shadow indicating seller activity during the trading session as prices decline at the end of the bar. The Shooting Star candle indicates that the buyers rejected higher prices so as to warn traders about a pending price decline.
A Spinning Top has a small body and upper and lower shadows that are approximately equal in length. This structure signifies an indecisive market. The market tried to go up and down, but eventually ended where it began. Adopt the imagery of a tug-of-war where both sides have begun to tire.
There is a strong relationship between body size and candle dominance. A Marubozu is a candle with a large body and very little or no upper and lower shadows. It represents total control of price movement by only one side of the market. A bullish Marubozu that closes at or near its high price indicates that the buyers had control of the market for the entire period without experiencing any significant resistance from sellers. Marubozus typically mark the initiation of an upward trend.
You can identify patterns more easily with colour-coded candles. The green or white candle is a bullish candle and indicates the price closed higher than it opened. The red or black candle is bearish and indicates that the price has closed lower than it opened. If you see a tiny red candle followed by a large green candle that completely engulfs it, this is a Bullish Engulfing pattern, which is one of the strongest signals for a reversal.
To fully appreciate the significance of these candles, you must keep in mind that each candle is representative of the complete trading session for that period of time. For instance, a hammer candle on a 4-hour EUR/USD chart contains four hours of price action, thousands of individual transactions and millions of dollars.
The long shadow below the hammer represents all the traders who sold at the low and are now holding a losing position, and the proximity of the close to the high represents the winners at the higher price points. This creates momentum into the next price move.
Trend Candles vs Reversal Candles: Identifying Continuation vs Reversal Signals
Correctly identifying whether a candle suggests that the trend continues or reverses can greatly affect whether you enter into a profitable trade or get stopped out. In order to determine the candle's message, you must consider the candle's place within the trending market.
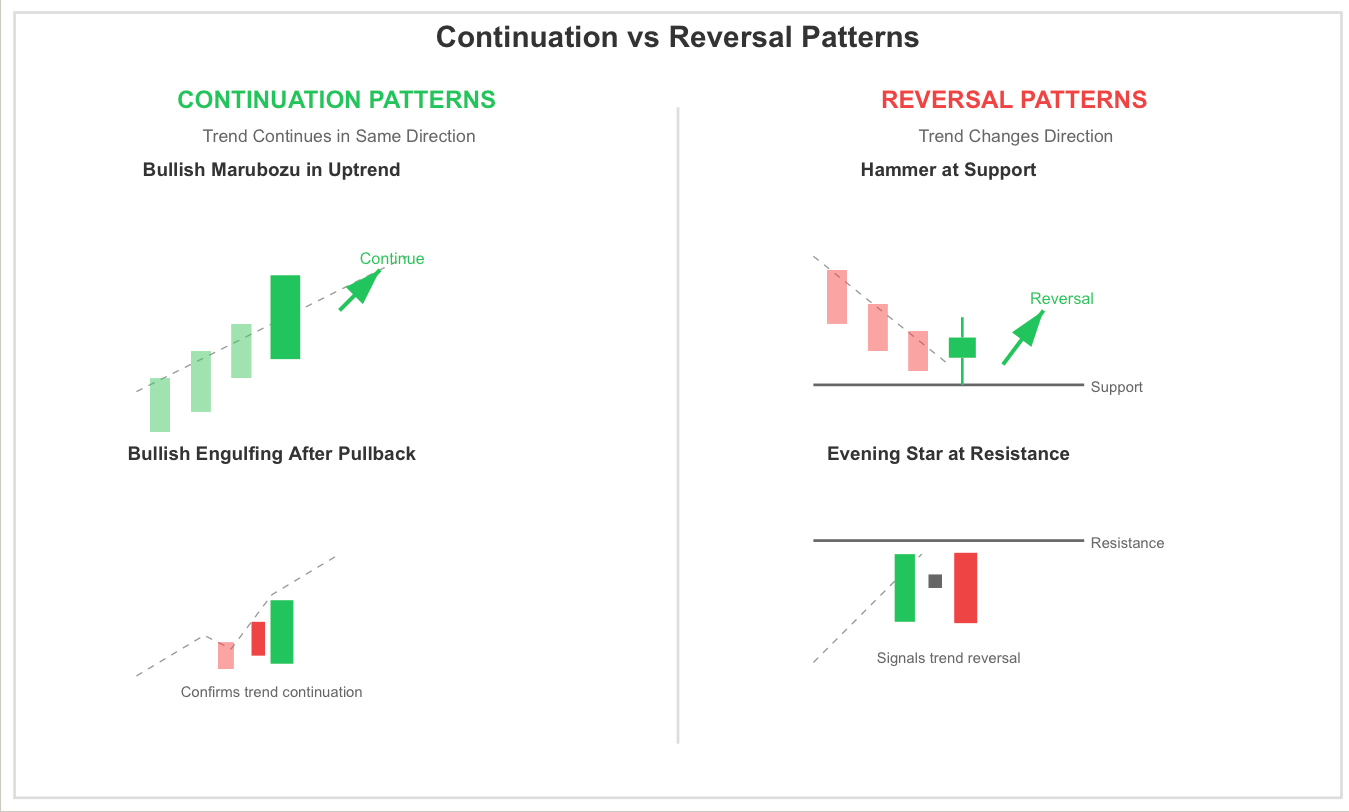
Continuing trend candles will form while a particular market is moving and suggest that momentum is going to continue. For example, a bullish Marubozu is a great type of continuing trend candle because if you see this candle form during an established uptrend, you can have complete confidence that the buyers are still controlling the market, and you should not be looking for any signs of a reversal.
Bullish and Bearish Engulfing patterns can indicate continuing trends or reversing trends based on the location they form in the market. If a Bullish Engulfing pattern forms at a support level while the market is in a downtrend, that would indicate a likely reversal. However, if a Bullish Engulfing pattern forms in an established uptrend after a minor pullback, then that would indicate continuing momentum in the direction of the established trend. Engulfing patterns show strong momentum by demonstrating that the larger candle completely "engulfs" the previous candle in size.
Key Reversal Candles generally indicate where the existing trend is at the end of its run or exhausted. The Morning Star pattern is created by three separate candlestick formations at the base of a downtrend. The first candle outlines the downtrend. Before this candle was a long bearish candle created by the sellers moving lower. Following this is a small, indecisive candle, a sign that the trend is losing support and stopping or resting before forming the final candle that crosses significantly into the first candle's body.
For example, historically, EUR/JPY had multiple weeks of rising trends following a morning star reversal formation at a key support level on a weekly chart.
Looking at the Evening Star, this forms at the top of an upward trend and shows that the uptrend has reached its climax with a long bullish candle before forming an indecisive candle and then forming another long bearish candle, indicating the end of this upward trend and turning back down once more.
In effect, the above consists of three separate candlestick patterns that mark the major reversal points from a downward-moving trend for a morning star, and from an upward-moving trend for an evening star.
A tweezer top or bottom is defined as "any two or more candles that have equal (highs or lows)." Imagine the market testing a level twice and failing on both attempts, for example, using USD/JPY as an example; at major resistance levels, you often see a tweezer top before there is a large drop, as this indicates aggressive seller defence of that price level.
You additionally combine these types of candle patterns with trend lines and support/resistance levels. A random hammer candle means very little, however, if you have a hammer candle located where the price is testing both the 200-day moving average and a major support zone, your set-up has a high probability of success; therefore, those who trade professionally will often wait to see these confluence areas before placing a trade.
To put it another way, the two types of candle formations are similar to ocean waves; a small wave during high tide looks very much like the first wave in a tide change, but the key difference is context. Where is the greater trend? What happened leading up to this candle? Where are the key areas of price action relative to that area? Answering these questions will allow you to tell the difference between a profitable trader and one who chases every candle pattern.
Candlestick Patterns and Market Psychology: Reading Trader Behaviour Through Candles
On your chart, you can see a representation of real-world traders acting in the market and how they react to the price; this is done by looking at your candles. Reading these patterns through the lens of psychology will turn your view from simply seeing forms to actually seeing the psychology of how the market is feeling.
A long lower shadow shows an aggressive buying action as well as fear. An instance would be if prices fall drastically within a given session, but the buyers then push them back up to close near where they began selling. When you see this in your candle, you are seeing a strong demand that overcomes the fear-driven selling. A recent example of this would be during the COVID-19 crash in March 2020. Hammer candles in (XAU/USD) gold created tremendous buying opportunities for traders who could read the psychology behind the candles.
Long upper shadows represent buyers' greed being rejected. In this example, buyers tried to push the prices higher than what they already were, getting excited that they would keep making money. However, sellers stopped that enthusiasm and brought the prices back down. The fact that they closed near the bottom of the candle shows that buyers are now sitting in a sold position that has gone down in value from where they bought it. This creates selling pressure going forward into the following sessions.
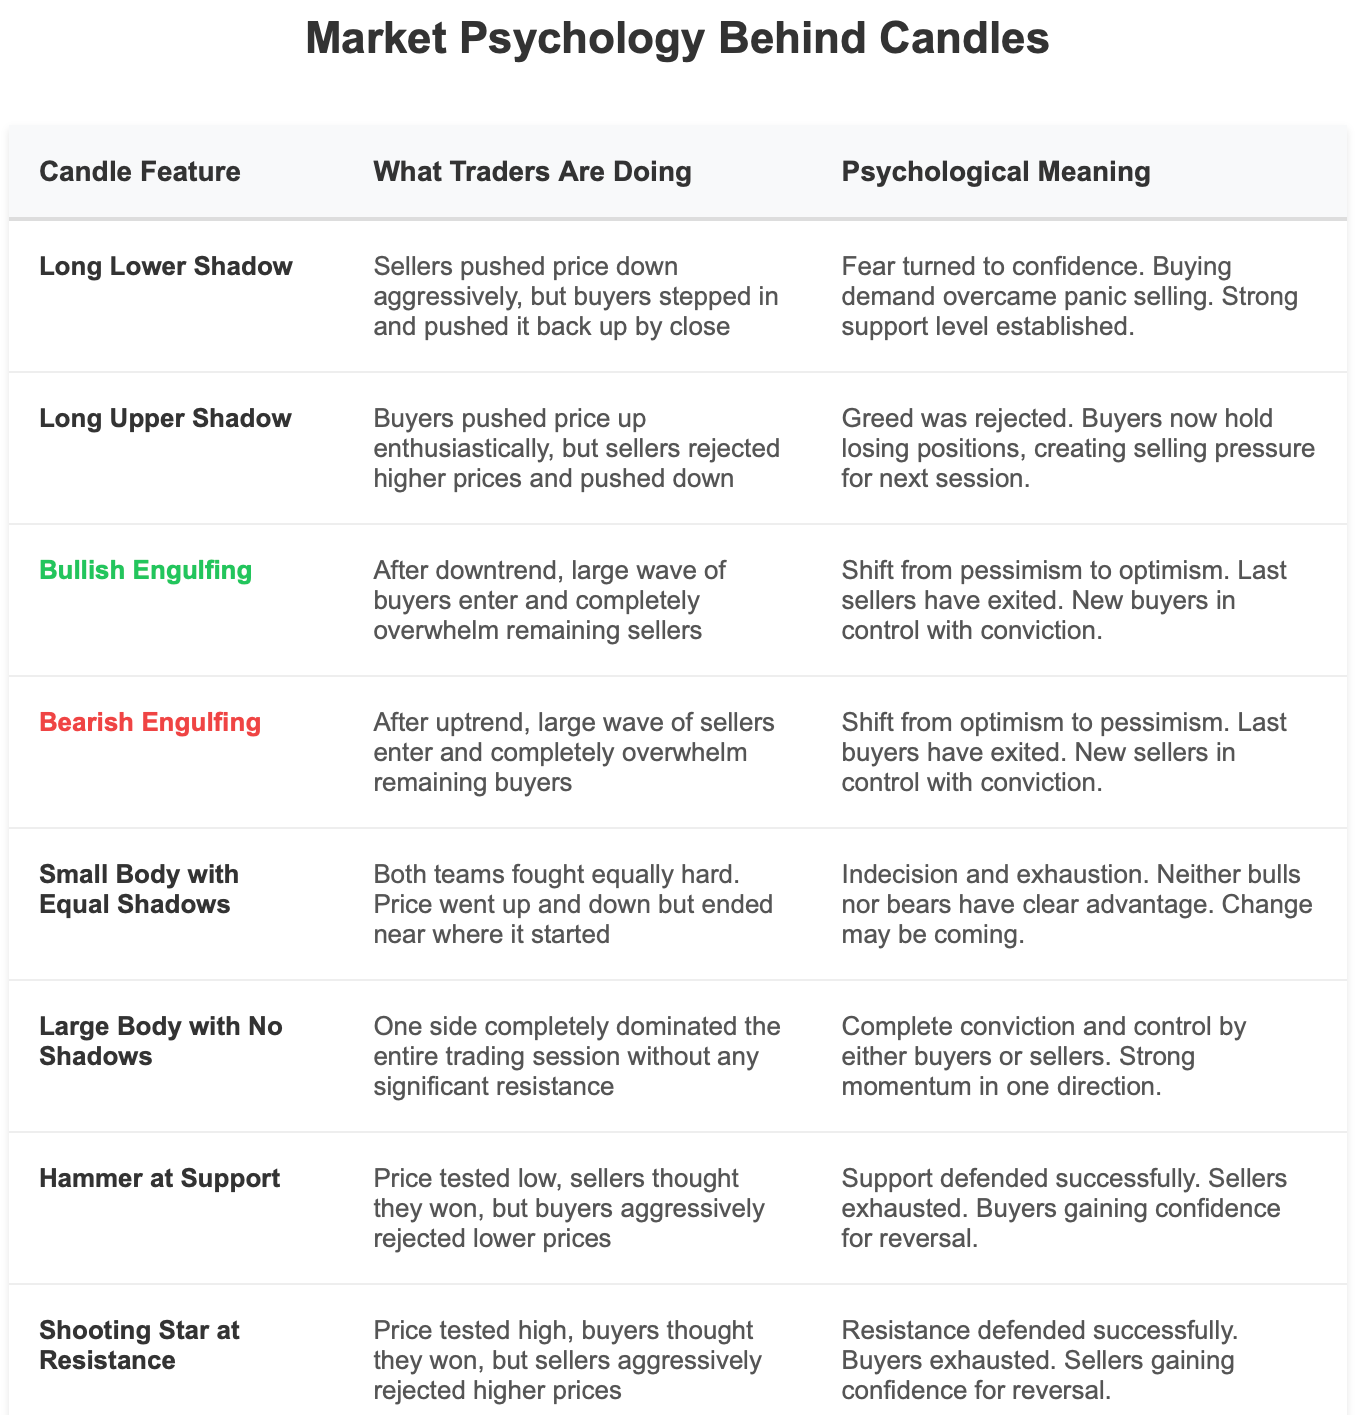
The Bullish Engulfing candle pattern demonstrates a strong shift in market sentiment. At the end of a downward trend, a bearish candle represents the final sell-off by the last sellers. A Bullish Engulfing candle shows the entry of a large number of buyers after the last sellers have exited from the market. The Bullish Engulfing candle also has a body that is higher than the Body of the last candle. When you see a Bullish Engulfing pattern, it indicates that there are many more buyers than there are sellers.
Institutions such as Banks and Hedge Funds track these patterns at the institutional level. For example, if you see a Hammer candle forming on EUR/USD as the London and New York markets are overlapping, there are large institutional players entering the market looking to buy at that level of support. When you see a long lower shadow on a hammer, it is an indication that there are many buy orders being filled as the stop losses are triggered and the retail traders panic sell their positions.
For the beginner trader, consider each candle as representing a mini tussle between two competing teams. The opening price of a candle is where both teams start their tussle. The longer the shadows, the more back-and-forth tussling took place between the two teams. The closing price indicates which team won that tussle.
Longer bodies with shorter shadows indicate that one team dominated that tussle throughout. Shorter bodies with longer shadows show the competition between the two teams and indicate that both sides fought hard for an advantage, but neither side won decisively. This creates potential for an exciting rematch.
Recognising exhaustion is the strongest psychological signal. When you see a downtrend making new lows, but with an increase in the length of the lower shadows, it indicates that buying interest is growing with every dip, and providing greater resistance at lower prices.
Eventually, you will see either a Hammer or a Bullish Engulfing pattern forming to confirm the change in sentiment. Smart traders will enter the market before the majority of traders and place their trades ahead of time.
High-Probability Candlestick Combinations in Global Markets
The use of single candlestick patterns can be beneficial for trading; however, various combinations increase the success rate of a trader significantly. The combinations of candlestick patterns are often most successful when traded on currency pairs such as Gold (XAU/USD) or Cryptocurrency due to the volatility and liquidity levels of these markets.
Bullish candles engulf and completely take out the previous bearish candle, giving a trader confidence to trade long, especially during the London Session when most of the trading volume takes place. When a trader sees the Bullish Engulfing candle at the Major Support for Gold (XAU/USD), the probability of the trade winning is over 70% with the possibility for a short-term bounce.
The Tweezers bottom candlestick pattern shows how many times a market has tested support; however, the market rejected support twice. The next candle is a bullish, good-volume candle that confirms bullish activity in that market and tells the trader that buying power has now been created. In addition, if this pattern occurs at the previous week's low (EUR/USD), traders can expect to find profitable trade opportunities over the next 50-100 pips.
The Morning Star combined with Key Pivot Points is a three-candle reversal pattern in relation to Major Support and Resistance Levels, where professional Traders Mark Important pivot points on the previous week, the previous day and the previous month. The Morning Star Candlestick Pattern, when formed at a Key Weekly Pivot Point from the previous week's closing price and the Low of the Asian Session, often produces a Major Bullish Rally following the Morning Star. In 2024, the EUR/USD has produced this setup multiple times, producing between 80-120 pip gains each time.
The confirmation of volume enhances the above-mentioned patterns. For example, if you see bullish engulfing patterns forming on charts with twice the volume associated with these patterns as you typically would see during a regular period, you know that strong hands are accumulating that instrument. It's my experience that every major rally that has occurred in the last 3 years in the cryptocurrency marketplace has preceded these patterns, followed closely by the volume spikes that typically accompany them.
Think of volume confirmation as the waves that crash into shore. The first wave represents the tide; however, when several waves come in the same direction and have increasing volume, you know the tide is definitely turning, or at least has changed, providing you with an opportunity to enter into a larger position, especially if there is a limited amount of time available before there is another opportunity to enter and/or increase your position.
The fundamental principle of volume confirmation is called "confluence," which is defined as the simultaneous occurrence of three or more signals on the charts of multiple timeframes. A single signal is interesting, two signals are compelling, and three signals make it impossible to ignore.
When you spot a morning star candlestick formation, which is located at a level of weekly support, with an RSI reading below 30, and happening during the early part of a trading session, you will want to build up your position in preparation for a much larger price move.
Using Candlestick Patterns with Technical Analysis Tools
The combination of candlestick charting patterns and traditional technical indicators significantly increases the probability of success when they are used together. They are intended to confirm each other, rather than duplicate their findings.
The Support and Resistance levels assist in providing the context needed to properly interpret and assess candlestick patterns effectively. For example, a hammer in isolation may represent a possible reversal candle by itself. However, if that hammer was located at or near the 50% Fibonacci retracement level of the last major price move, that would be an actionable trade setup on the EUR/USD currency pair. The EUR/USD consistently adheres to these Fibonacci support and resistance levels, and when reversal patterns are identified in conjunction with these Fibonacci locations on the price chart, the probability of success greatly increases.
The Moving Averages serve as a dynamic support and resistance level for price action. When price action retraces to the 50-day moving average and prints a bullish engulfing candle reversal, it adds both a technical and sentimental level of support to continue moving in the same direction as the established trend. The GBP/USD has shown this same price action behaviour during trending moves and has provided traders with low-risk entry points that also offer clear invalidation levels.
The Relative Strength Index (RSI) is used to filter out false signals. Specifically, a bullish engulfing candle pattern is even stronger when the RSI level is below 30 and in oversold territory on the price chart. This combination of signals on a 4-hour EUR/USD price chart has consistently provided traders with great success by indicating technical oversold price levels and/or the transition from bearish to bullish sentiment. The candlestick pattern confirms the indicator alley, indicating events in a clear visual manner using sell volume.
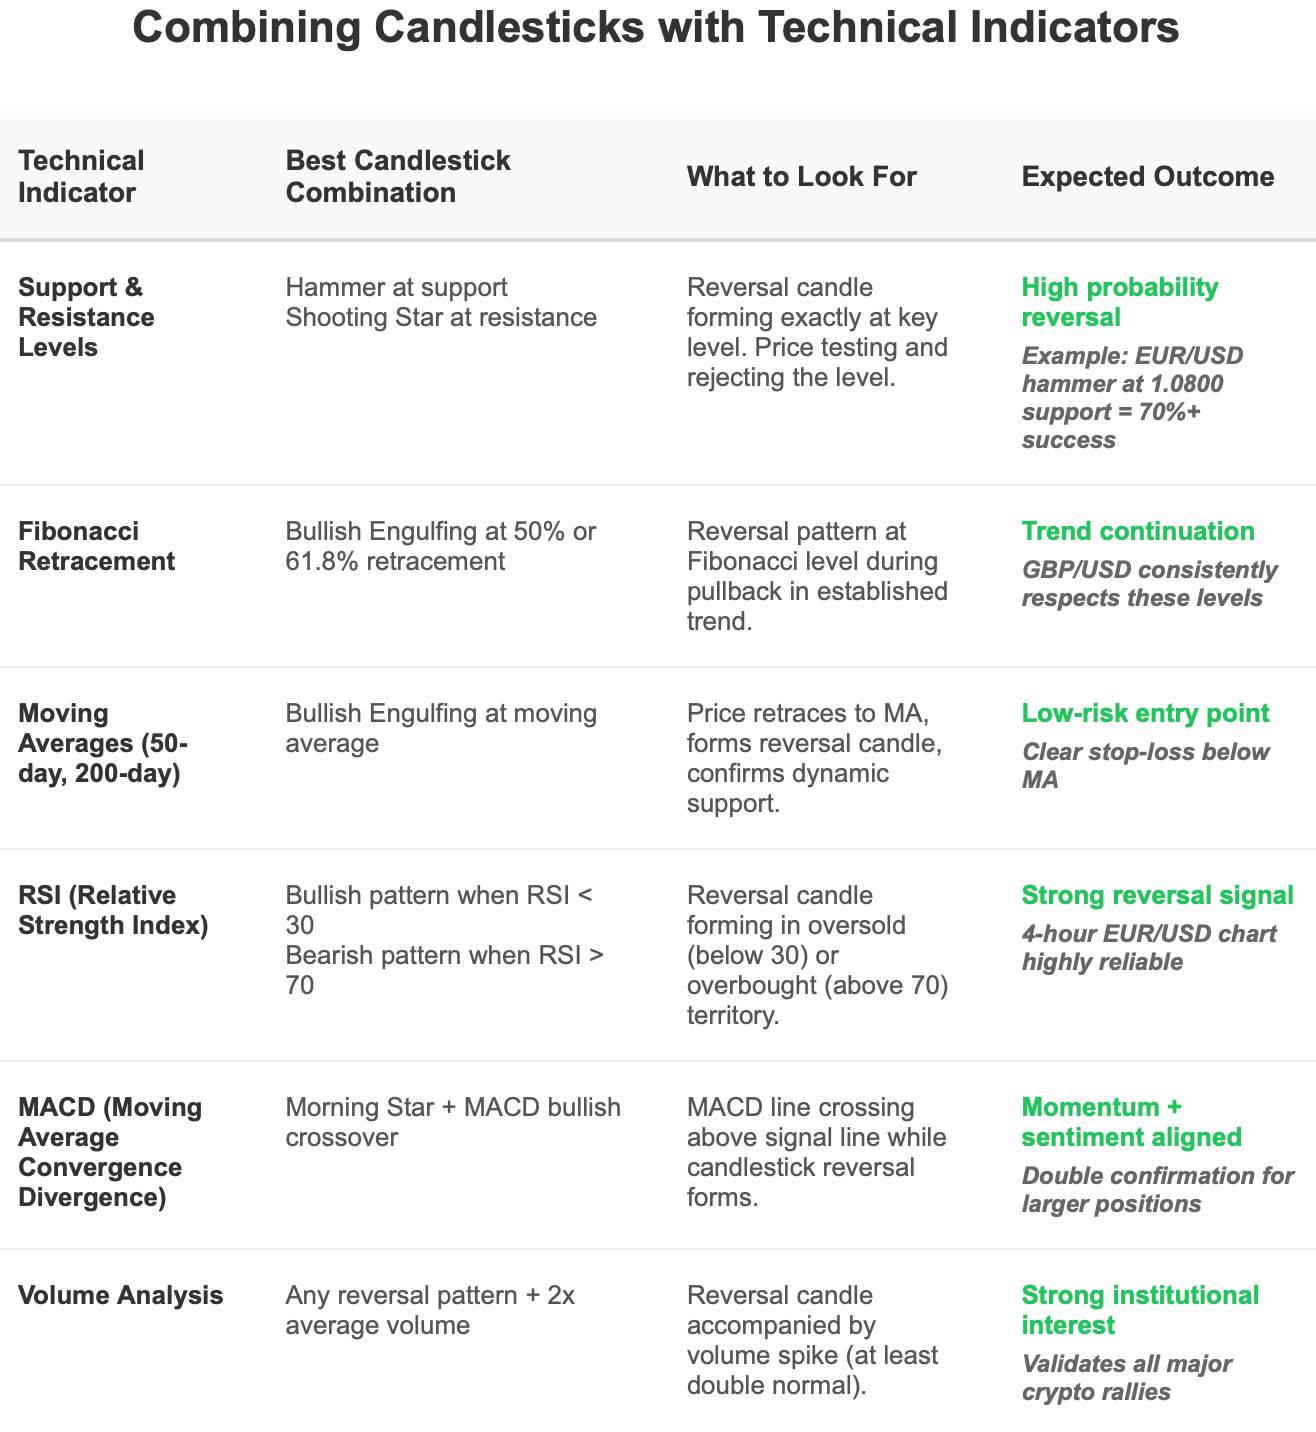
The Moving Average Convergence Divergence (MACD) also serves as a technical signal in conjunction with the candlestick charting patterns. For example, when the MACD signal line crosses above the zero line (positive cross), if the trader also identifies a morning star candle formation on the price chart, the trader has both momentum and sentiment momentum in the same direction, supporting that price movement. Professional traders often await this double confirmation before committing to larger positions.
The trick to avoiding false signals is the requirement for confirmation from more than one source. For example, while the single hammer may not be a good indicator, having the hammer at support along with a bullish MACD cross and an RSI turning up from oversold nature gives that set-up a much higher probability of working out (10 - 15%), making a better risk/reward environment.
Think of indicators and candles like you would think of witness testimonies; if the witnesses all tell you the same thing from different angles, their testimony is credible. If testimony is conflicting, then it is wise to seek out additional corroboration before moving forward. By operating in a disciplined manner this way, you will limit yourself to low probability trades and concentrate on those trades with the highest potential.
Mastering Candlestick Patterns for Smarter Trading
The types of candles we've covered represent centuries of market wisdom distilled into visual patterns. Each of these candle formations, from the most basic like the Doji, up to the very complex combinations like the morning star at pivot point type formations, indicates specific types of information regarding the fight between bulls and bears.
The key takeaway is that context plays an important role. If you see the hammer candlestick candle formation at a random price level, it is simply a shape, while if you see a hammer candlestick candle formation at the pivot point on a weekly basis with the RSI being at oversold conditions and with volume confirmation, it becomes a signal to take a trade. Therefore, the location, trend and confluence will determine if you act upon the formation or simply record it.
Every market has a different characteristic; therefore, you will need to adapt your approach based on the specific market conditions. Forex (FX) has small spreads and a lot of liquidity, so the candlestick candle formations work well on lower timeframe charts for trading FX.
Gold is heavily influenced by macroeconomic releases; therefore, most candlestick formations around economic news releases will be given added significance. The extreme volatility of cryptocurrencies means that you must have larger stop losses and more restrictive risk management, although the candle formations are exactly the same.
If you are new to trading, begin simply and focus on learning how to recognise hammer candlestick candle formations, engulfing patterns, morning stars and evening stars on daily charts. Spend some time using demo accounts to review and identify these candle formations before risking your own capital. Remember: the successful professional trader did not develop into the successful professional trader in one day, and you cannot expect to do so either.
For the experienced trader, the edge that you will have comes from using a combination of psychology, volatility analysis and multiple technical indicators along with candlestick formations. Once you understand the reason for the formation, the situations where they work best, and how to confirm their predictability, you can greatly improve your timing of the trade entry, exit and your risk management.
The mastery of understanding candlestick candles will be a never-ending journey of discovery. The markets are always evolving, new candle structures are appearing, and the candles of the past are losing their credibility.
But the primary premise of understanding candlestick candles remains the same: The candlestick candles represent the emotions and intentions of the market participants. Learn to read the candlestick candle formations easily and with fluency, and you will always have a timing edge for entering and exiting trades for maximised profits.
Ready to put these candlestick patterns into action? Create your account at TradeWill.com and start identifying high-probability setups across Forex, gold, and crypto markets with our advanced charting tools.
Disclaimer: The content of the blog does not represent any position of Trade W, does not serve as any trading-related decision advice, and does not endorse any third-party.