

 Trade W

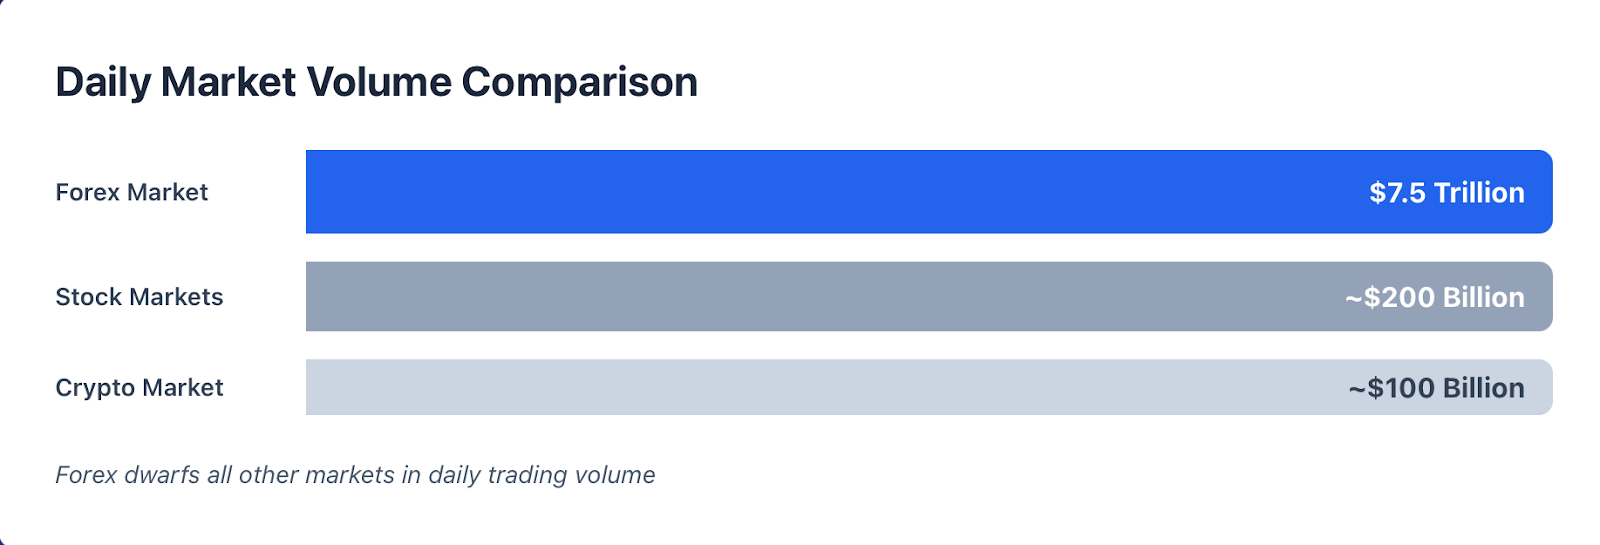
Each day, the Forex market transacts $7.5 trillion; this amount dwarfs the combined transactions of every single stock market in the world. Because there is so much liquidity in the market, there is always an opportunity to trade; consequently, it can be difficult to determine when and where to place a trade. Therefore, you must know what you're doing before entering the market.
In this guide, we have created an easy-to-understand path from novice to a professionally competent trader. We're going to show you how to perform technical analyses, manage risks, use the psychology of trading, develop trading systems, and be successful! This guide is perfect for beginners as well as those wanting to improve their current trading strategies.
Why Forex Day Trading Matters
In Forex Day Trading, traders will look to capture small price fluctuations on Currency Pairs over a series of smaller transactions, where they will enter and exit the trade during a single trading day. Unlike buy-and-hold investment strategies that are typically only utilised after waiting for months to receive dividends, traders will enter and exit their positions in seconds.
This is where the appeal lies within the Forex Market. The Forex Market is open for twenty-four hours each day, five days each week. Traders can trade within the hours of London during their open market, New York during the New York Session, and Tokyo during the hours of Tokyo. The flexibility offered by the Forex Day Trading System is unlike any other Trading System available to the Retail Trader.
For example, daily, the most highly traded Currency Pair is EUR/USD. Although it typically moves between 50 and 100 pips on an average trading day, if a day trader is using leverage when trading these movements, there is potential to generate Real Profit from these movements. However, as the saying goes, with every opportunity comes Real Risk.
Day trading is not a source of passive income. Day trading is an active, time-consuming, and requires a great deal of Discipline to be successful. However, if an individual is willing to take the time and dedicate themselves to learn and practising Day Trading, there is a path to Earn Consistent Returns that few other markets offer.
Core Concepts You Need to Understand
Before starting your first trade in currency markets, it is important to understand the differences between Forex day trading and other methodologies in currency trading.
Comparing day trading versus other strategies:
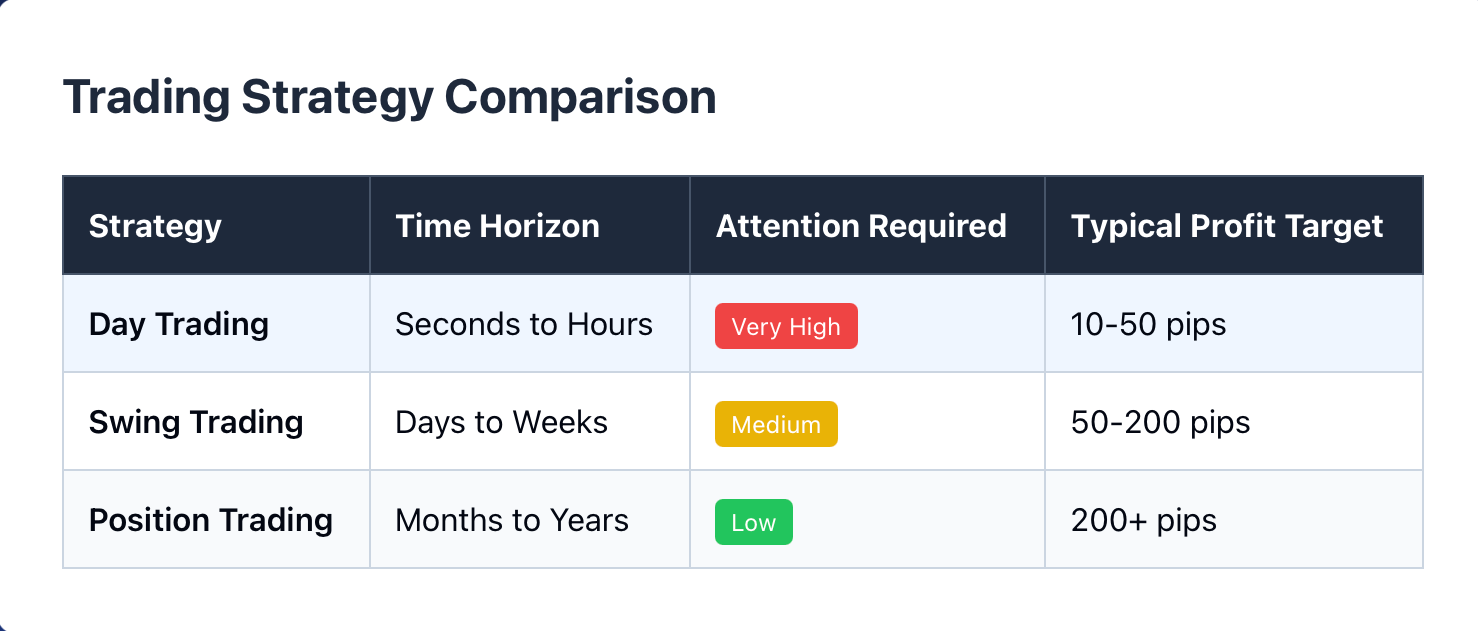
Day traders either close all their positions before the market closes or stop trading for that day. On the other hand, swing traders will keep their positions open for days to weeks, and long-term investors will keep their positions open for months to years. Each of the three trading methods has a specific place; however, compared to the other two, day trading requires the most attention and gives the fastest response time.
Trading Sessions Matter
There are three predominant global Forex Trading sessions: The Asian (Tokyo), European (London), and North American (New York) sessions. The overlap of the London and New York Trading Sessions will yield the greatest volatility, highest liquidity, and largest price movements. The best time to trade the Euro vs. the US Dollar and the British Pound vs. the US Dollar will occur when the two sessions overlap.
During the Asian Trading Session, markets tend to be less active as traders have lower trading volumes and tend to trade with smaller price ranges. The Asian Trading Session provides an opportunity for traders to develop their patience and precision skills.
Essential Terms
Spread defines the type of cost you incur when making trades. The smaller the spread on a trade, the more money you save in transaction costs.
Leverage refers to capital that is provided in order to magnify both positive and negative outcomes of an investment. Leverage of 1:100 means that an investor can control an amount of money worth $100,000 by only having $1,000. Although it can be lucrative, leveraging funds creates a risk of loss.
Margin is another term used to define the type of collateral you must hold to take on a leveraged position or risk.
Slippage occurs when an order to buy or sell is executed at a different price than the price the trader was expecting. It often occurs during periods of high volatility in the price movement of a security or commodity.
Traders need to understand these concepts. Most traders who do not learn the basic principles associated with trading will experience major losses in the first few weeks after opening an account.
Technical Analysis Tools That Actually Work
Price Charts
Open, close, high, and low can be seen on candlestick charts. Candlestick analysis will tell you the story of supply and demand based on the length of time a buyer or seller has held onto their shares or security. For instance, the long green candlestick indicates that buyers were dominant throughout the entire time period; conversely long red candlestick indicates that sellers were dominant. That is why doji candlesticks indicate uncertainty regarding whether or not sellers or buyers are going to take control.
Key Indicators
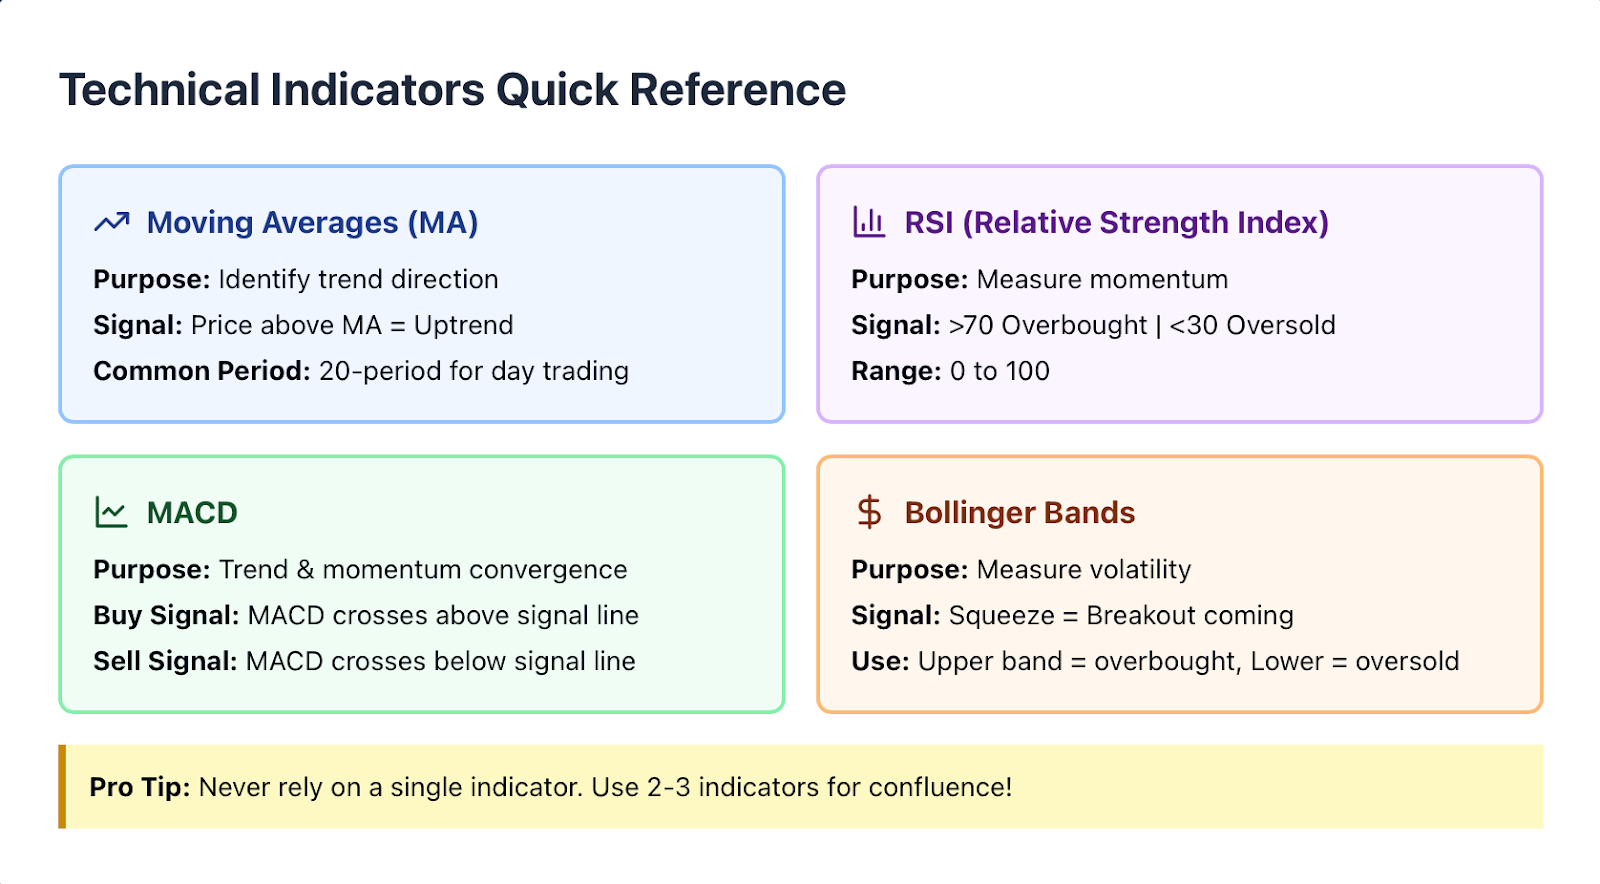
Moving Averages (MA): A moving average smooths out price movement and allows us to see the trend of the market. Day traders typically use a 20-period MA. If the price is above the MA line, then the short-term trend is up. If below the MA line, then the trend is down.
The Relative Strength Index (RSI): Measures momentum on a scale from 0 to 100, over 70 indicates an overbought situation (possible down trend reversal), while under 30 means the market has become oversold (possible trend reversal up); however, in strong trending markets, the RSI can remain extreme for extended periods of time.
The MACD (Moving Average Convergence Divergence): Shows the relationship between 2 moving averages; the point when the MACD line crosses up through the signal line creates a buy signal; conversely, the MACD crossing downward through the signal line indicates an upcoming sell signal.
Bollinger Bands: Show price volatility; if the bands start to squeeze closing, they indicate that a breakout move is on its way. If the price touches the upper Bollinger Band, it may indicate an overbought condition, and if the price touches the lower Bollinger Band, it may indicate an overselling condition.
Support and Resistance
Consider that the buyers will be able to access the Market, and the Sellers will be able to stop the Market. These levels are psychological and not everything about trading, so pay attention to where prices occur.
Trend Lines and Channels give you a visual representation of how the price of GBP/USD moves either up or down - a trend is formed when a higher low is formed and continued until that trend reverses back to the previous low. Another example of this would be GBP/USD.
In late 2021 and into early 2022, GBP/USD formed solid Support at 1.1800 during London Trading Sessions, and those traders who bought while the RSI Indicator was below 30 and the MACD line began to move up have made several successful trades off of those levels.
When you are using Technical Indicators, do not use them individually. You should combine them and use them together for Confirmation. An example of this would be: An Oversold RSI Indicator and Price Sits Upon Support and The MACD Line Moving Upward. This would mean that there is a Confluence of Signals, and it is a good time to enter trades.
Risk Management: The Only Thing That Matters
Stop-Loss Orders
Each trade must have a stop-loss in place. That is the price point at which you recognise that the trade is not working for you and you need to exit. Beginning traders resist this because they feel that it is "locking in" their losses. However, without stop-losses, if you have one losing trade, it could cause you to lose several weeks' worth of gains.
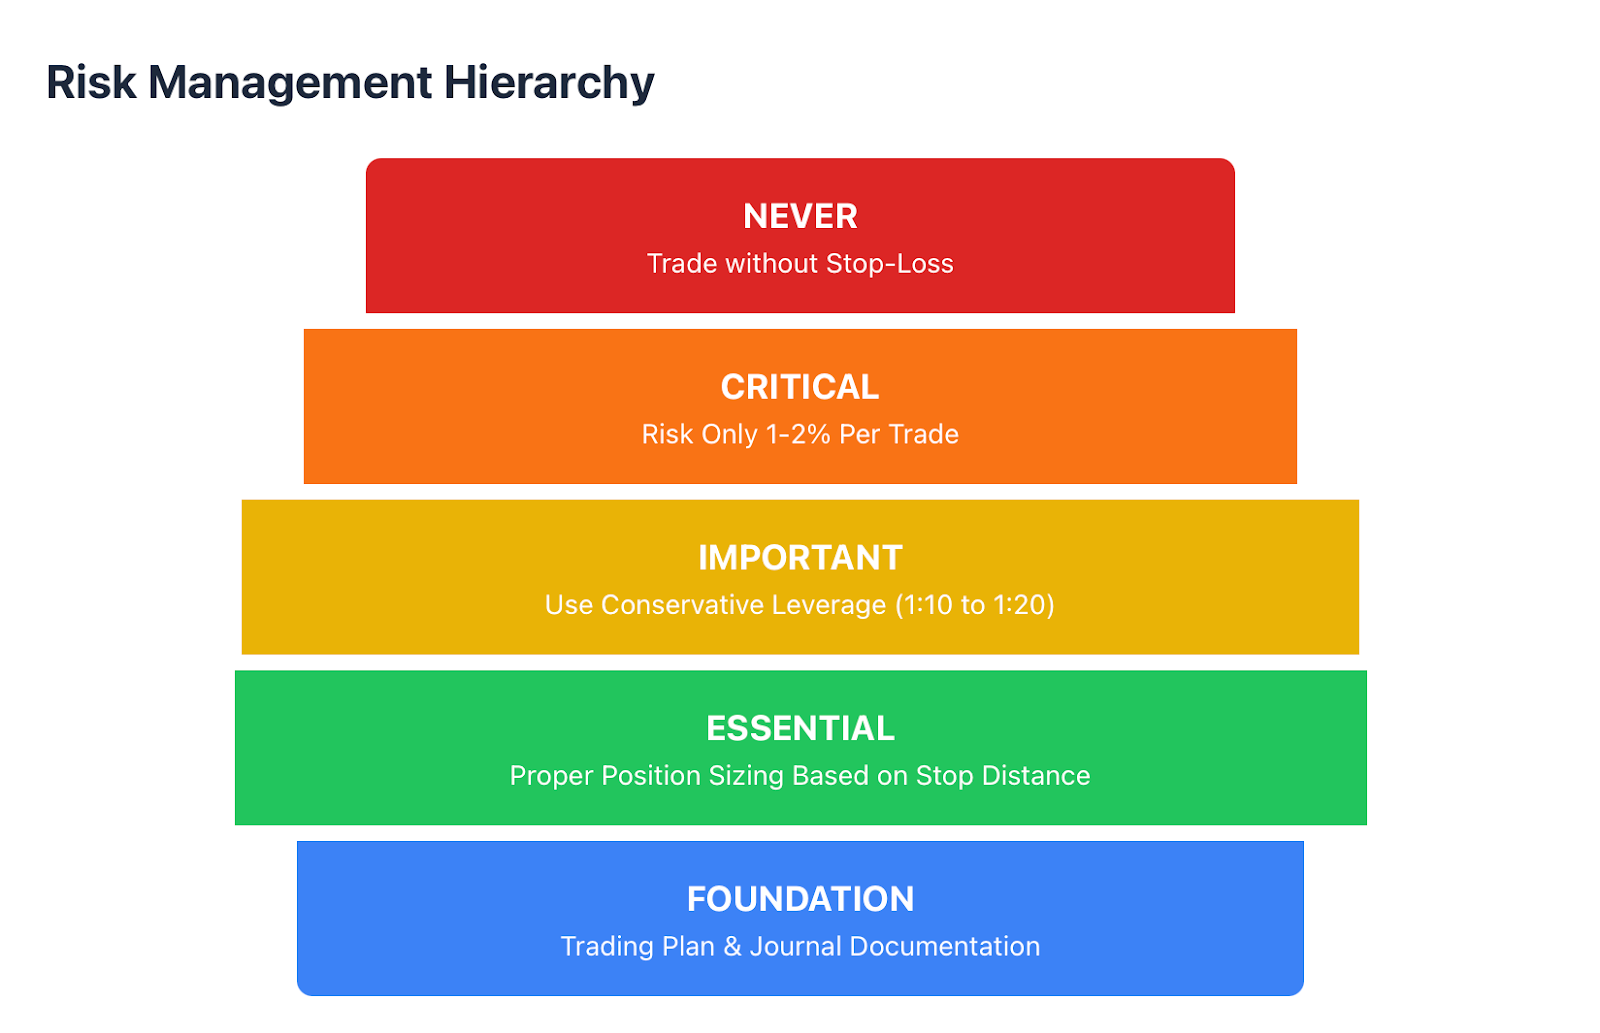
An excellent rule of thumb to go by is to risk between 1-2% of your account size per trade; therefore, if your trading account has $10,000, you should only have a maximum exposure of $100 - $200 on any single trade.
Position Sizing
Only take some of your trading capital on any one trade. You need to determine the size of your position based on the distance of your stop-loss. If your stop is 20 Pips away and you are willing to risk $100, that would be to place a trade with a total value of $5 per pip.
Leverage Control
Although high leverage can be tempting, as brokers may offer you 1:500 and even 1:1000, keep in mind that with high leverage, you can increase your losses just as quickly as your profits. Professional traders will use a lot less leverage than a beginning trader is likely to think. Therefore, if you are a beginning trader, you may want to consider using a more conservative leverage, like 1:10 - 1:20 to start.
Trading Psychology
Accounts are lost to fear and greed. Fear causes traders to exit winning trades prematurely, while greed leads traders to stay in losing trades, hoping that they will eventually turn around.
Another killer is overtrading; you do not have to trade every single day. In fact, at times it may actually be better not trade at all.
One trader in the USD/JPY trade learned this the hard way. He won three trades in a row, then became too confident and doubled his size while not having any type of stop loss. When a news release caused an abrupt shift, he lost an entire month's earnings in just 20 minutes.
Discipline will always be more important than intelligence when it comes to trading.
High-Probability Trading Strategies
In this section, we will look at various Strategies to trade Forex.
Trend Following
Trend following is the most basic trading strategy. The trader identifies the overall direction of price movement and then trades in that direction.
To confirm the trend, use Moving Averages as confirmation. A rising price above the 20MA & 50MA will indicate an uptrend. Wait for price to pull back to the Moving Average(s) before going long.
Reversal Trading
Reversal Trading is more complicated than Trend Trading. You are looking to find the end of a trend. For example; when the price is making a new high but the RSI is making lower highs. This can indicate a reversal of the trend.
Look for volume that confirms the reversal. Volume is typically high when a significant price change takes place and therefore can act as an excellent indicator that a trend reversal is taking place.
Breakout Trading
Breakout Trading occurs when prices have been trading within a range or channel, and then the price breaks out of the range. Price typically breaks out of its range on High Volume with Momentum.
For example, Price consolidation may take place for an hour or two during the London Session with the EUR/USD pair, followed by a breakout upwards. Enter on a break above the upper range with a Stop Loss placed beneath the range.
News Trading
while others focus on trading around them. If you choose to trade around economic announcements, you should know the date of the announcement, anticipate slippage, and allow for a wider stop loss.
For example, during a hawkish Federal Reserve announcement in 2023, the USD Index spiked, and traders who had established a long position in USD/JPY before this announcement made 150 pips within four hours.
Blending different Trading Techniques
Oftentimes, the best way to approach the market is through blending techniques. For example, you might trade with the trend but use a reversal pattern for entry. Alternatively, you might only trade breakout trades, however, exclusively in the direction of the higher time frame trend.
As a rule, always confirm signals using multiple indicators across multiple time frames. Using only one single indicator to signal "buy" is not a good way to validate the entry. You should wait until multiple indicators confirm their respective signals across multiple time frames as well as multiple indicator types.
Building Your Trading Plan and Journal
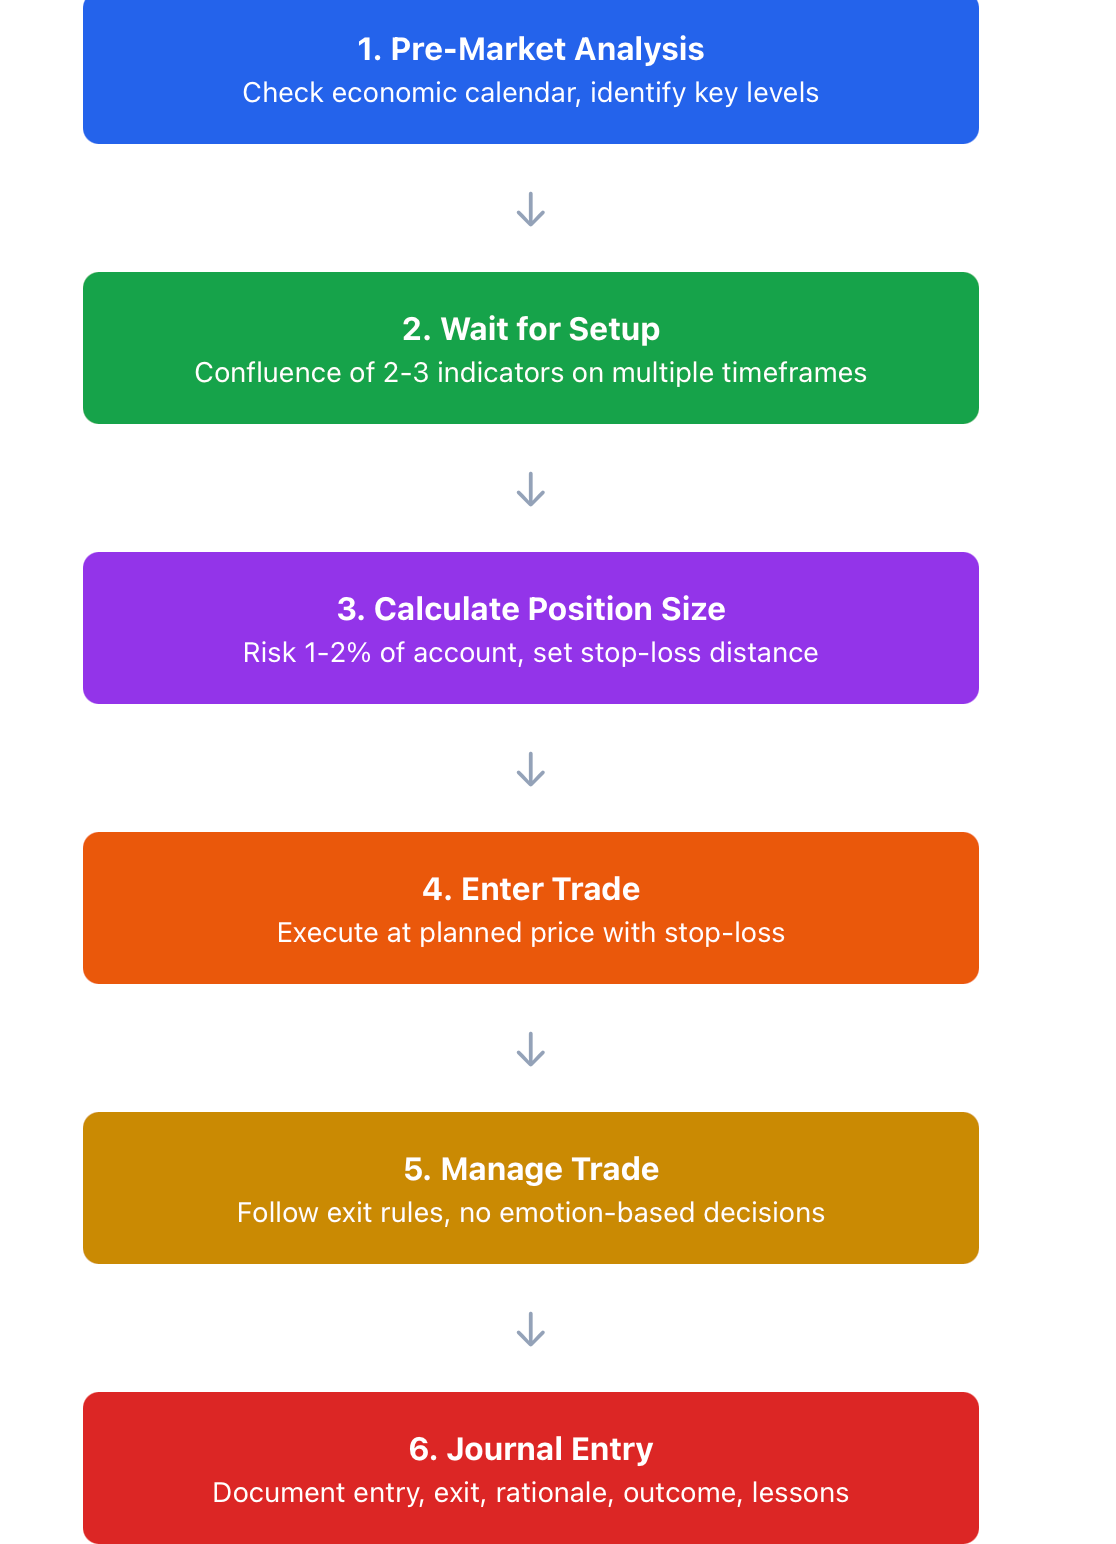
Developing Your Trading Plan
-
When developing your trading plan, write the following down:
-
Your goals, i.e. Daily Profit Target and Monthly Returns.
-
What strategy will you use, i.e. which setups will you use to trade?
-
Your risk parameters, i.e. maximum loss per trade and daily loss limit.
-
Your entry and exit rules: you have to establish specific criteria for both, and have no discretion while placing trades.
Your Trading Journal
-
After every trade, make sure you document:
-
Entry price, exit price.
-
Why did you make your trade, based on Setups and Indicators?
-
Your outcome, i.e. gain or loss.
-
Your right and wrong decisions.
-
What was the condition of the market? How was it at the time of the trade?
Don't think of this as busy work, but as a means to find patterns. Perhaps you have more success during certain trading times or trades and lose during others. Either way, you now have information that is very valuable to you.
Traders who are professionals treat their journals the same way athletes treat training logs. Every training session is valuable.
Common Mistakes to Avoid
Overtrading: Overtrading is often caused by boredom or the inability to identify good trading setups. Remember that quality is always better than quantity!
Chasing Trades: Chasing trades causes you to enter a position after the price action has moved. This is usually the result of trying to enter at the top or bottom of a price move.
Ignoring Your Plan: When you develop your own trading plan, you create rules for how you will trade. If you break those rules during live trading, you open yourself up to taking unnecessary risks, which will lead to losing trades more often.
No Risk Management: Risk management is critical to your success as a trader; we can't stress this enough. If you do not actively manage your risk in each of your trading decisions, then you are simply gambling.
A trader in the USD/CAD market in 2021 lost seven consecutive trades because they kept doubling down on their losing trades rather than walking away. The trader violated every rule in their trading plan and, as soon as they implemented a hard and fast rule of not trading the rest of the day after recording two consecutive losses, their performance improved significantly and immediately.
Finding the lesson from your mistakes quickly is essential. Continuously making the same mistakes will only lead to high costs on the part of the market, as your teacher.
Your Path from Beginner to Professional
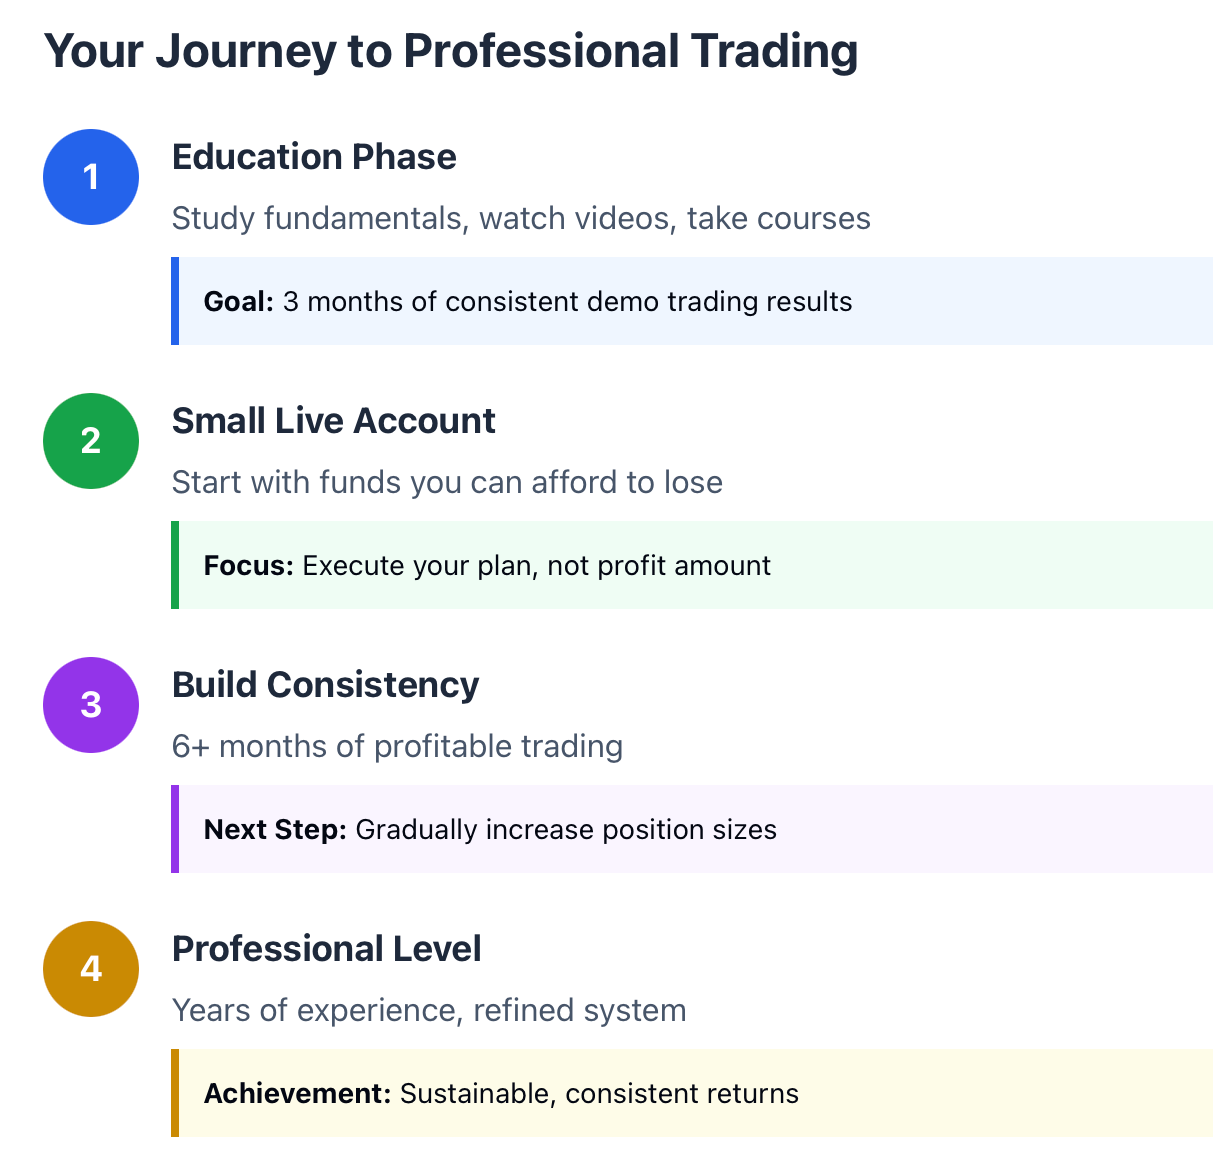
Phase 1: Education.
You must first acquire the fundamental knowledge to succeed at trading by studying, viewing video content, and taking courses before opening a demo account where you can practice with fictitious funds until your results are consistently successful over 3-months. There are no shortcuts to success.
Phase 2: Start With a Small Living Capital Account.
You want to use funds you can afford to lose. Most new traders lose their first account; it's part of your education. Therefore, trade with smaller position sizes while focusing on executing your trading plan rather than the amount of money you are earning.
Phase 3: Build Consistency and Growth.
You can gradually begin increasing your position size when you have achieved consistent profitability for 6 months or longer. As you build your successful trading strategy, you will discover the areas that work best for you individually. Each trader is different, and no single strategy works for everyone.
Professional traders typically take many years to develop the ability to trade professionally.
Building a Complete Trading System
An automated system that is guided by a pre-established methodology is an excellent means of eliminating the influence of emotions on trades.
Strategy Development
Establish what your edge is. Which market conditions do you perform best in? In a trending market versus a non-trending market? High volatility as compared to low volatility?
Backtesting
Build a platform using historical data to determine your win rate, average profit per trade versus average loss per trade, and maximum drawdown. If the methodology does not work for you when you are Backtesting Historical Data, then it will not work live.
If you are using a EUR/USD breakout strategy, you test the system on Historical Data from 2022 to 2023 to determine if the strategy works better in certain market conditions. Is there a difference in the performance of the system during London Trading Hours compared to when trading during Asian Trading Hours with low volatility?
Optimization
Modify the system parameters to identify an "optimal" set of parameters for your strategy. Test different Stop-Loss levels, different Currency Pairs, and different Timeframes; however, do not "over-optimise". A system that was designed with the intent of performing well on Historical Data but cannot be used anywhere else is Curve-Fitted Garbage.
Live Execution
Implement the plan exactly as outlined in your initial plan and monitor the results, only adjust based on "Data" but not on feelings.
2026 Forex Market Outlook
Currency price movements are influenced by a number of factors, including political events, central bank interest rate policy decisions, and the release of various forms of economic data. Each of these influences has the potential to create volatility and opportunity for traders.
Trends in the currency market have been driven primarily by central banks. Through their setting of interest rates, central banks such as the Federal Reserve or the European Central Bank can impact the flow of trillions of dollars. For example, when the Federal Reserve released its decisions regarding interest rates during 2025, the price of USD was significantly impacted by the resultant volatility and price movements created by these interest rate changes.
As an example, if you know when the Federal Reserve is expected to announce interest rates, and you place your trades ahead of that announcement, you can take advantage of the anticipated volatility created by that announcement. This allows you to earn profits from both the bullish and bearish trends that follow the announcement.
In general, if you are an intraday trader, it is important to position yourself on a trade before a major announcement with a stop near your entry point. For example, when the Federal Reserve indicates that interest rates will increase, you should expect the value of the USD to increase as well; similarly, if the European Central Bank indicates that interest rates will decrease, you should anticipate that the value of the Euro will also decrease.
Why Forex Beats Stocks and Crypto for Day Trading
Liquidity: Forex has the greatest liquidity of all markets. Unlike small-cap equities, you can open and close a trade in Forex without affecting the price.
Trading Hours: Forex has the most accessible hours to trade, with a continuous 24/5 market, compared to the limited hours of stock trading.
Leverage: Forex brokers offer more leverage than stock brokers; if used correctly, it increases your profits. Cryptocurrency is also leveraged; however, it is susceptible to extreme volatility and is unstable.
Lower Costs: There is a very small spread between major currency pairs in Forex. The costs associated with Forex trading are much lower than those for stock trading since the vast majority of brokers are now offering zero-commission trading.
High-frequency traders use Forex to repeatedly execute trades that take advantage of very small fluctuations. For example, if you were to place 50 trades in one day on a 0.1 pip spread, the difference in transaction costs between Forex and stock trading would be considerable.
Your Next Steps
If you want to be successful at Forex Day Trading, you must prepare, Discipline, and Learn continuously. The path to success is as follows:
Understand the Basics, Master Technical Analysis, have a Risk Management Mentality; Develop a System; Execute Consistently.
Education and Demo Trading are the first steps. Once you feel comfortable with your skills, the next step is to place a small Live Position. Make sure to maintain a Journal as you learn from each of your Trades.
Talent is not the difference between successful Traders and those who fail; it is Persistence and Process.
Ready to start your forex day trading journey the right way? Head to Tradewill.com for hands-on demo accounts, advanced charting tools, and educational resources built specifically for traders serious about making this work.
Disclaimer: The content of the blog does not represent any position of Trade W, does not serve as any trading-related decision advice, and does not endorse any third-party.