

 Trade W

When it comes to forex trading, knowing when the market is changing course can certainly make the difference between winning and losing. While trend reversals are one of the best opportunities in currency trading, they can also be one of the toughest to identify (and trade) correctly.
What is trend reversal?
The first thing you must know is that reversing a trend means the price movement has changed significantly - essentially, when price movement is moving down is a downtrend (or bearish reversal), and when a market changes from moving down to moving up is a bullish reversal (indicating strong bullish sentiment.)
Think of this similarly to a basketball game where the trailing team has picked up steam and overtakes the leading team. The key word here is "significantly" - essentially, the price direction cannot be temporary pullback or sideways consolidation.
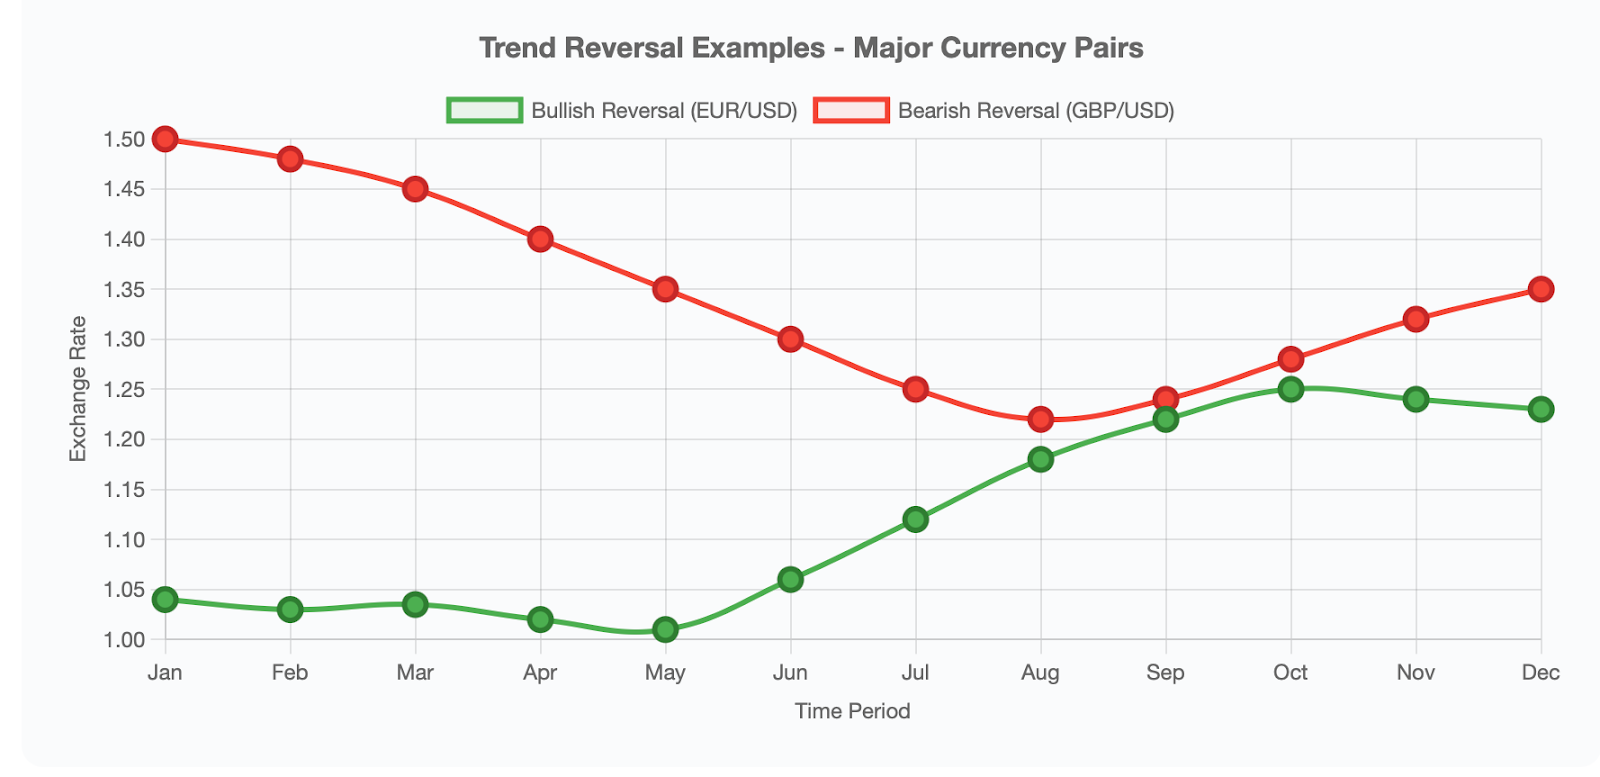
There are two types of reversals in forex:
Bullish reversals: Occurs when a downtrend has finished and the prices start to move in some upward direction. An example of this is the EUR/USD pair at the end of 2018 when the price finished many months in a downtrend and subsequently started a strong sustained upward trend.
Bearish reversals: At some point after an upward trend has finished, the prices will start moving in a downward direction. This frequently occurs when the market changes market sentiment from bullish optimism to frustrating that breeds bearishness.
Here are the distinctions between real reversals and other price movements:
-
Retracements are temporary moves that go against the primary trend only to continue the previous trend
-
Consolidations are price movements that go sideways with no direction
-
Reversals are manifestations of true change in the trend and can last weeks, months, or even years.
Double Tops and Bottoms, Head and Shoulders, and candlestick formations are examples of classic reversal patterns. They are not just decorative images on the chart, they are visible signs of changes in market psychology (i.e., buyers and price becoming sellers).
The biggest mistake beginner traders make is to confuse short term retracements with reversals. Learning to distinguish the difference will open the potential for trading opportunity and help you to avoid losing money.
Important Trend Reversal Signals: How To Identify Forex Reversals Like a Pro
Identifying trend reversal takes more than throwing a wish into the wind. Professional traders rely upon established technical indicators and price patterns which work most of the time.
Technical Indicators Signaling Reversals:
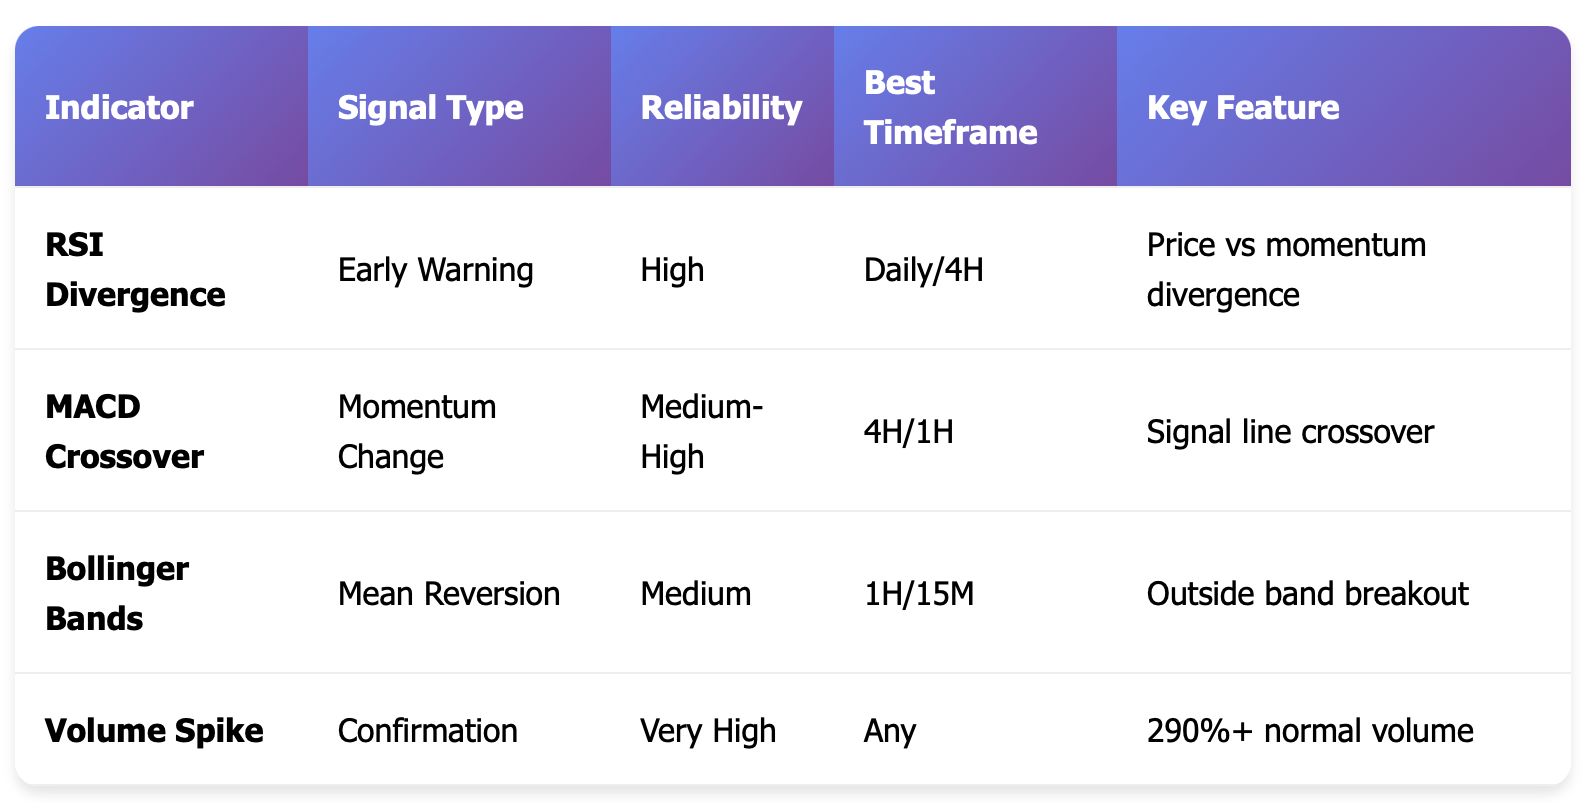
The first type is the RSI divergence, where price makes a new high, yet the Relative Strength Index is unable to achieve a new high. This is often an early warning sign of a looming bearish reversal. The same can be true for bullish reversals.
The second, and equally reliable, indicator is the MACD crossover. Generally, as the MACD line crosses above or below the signal line, the momentum changes directions, especially if coming from extremes.
The third is a Bollinger Bands breakout, where price trades outside of the bands and then subsequently snaps back inside. A reversal often accompanies this event.
Candlestick Patterns for Reversal Trading:
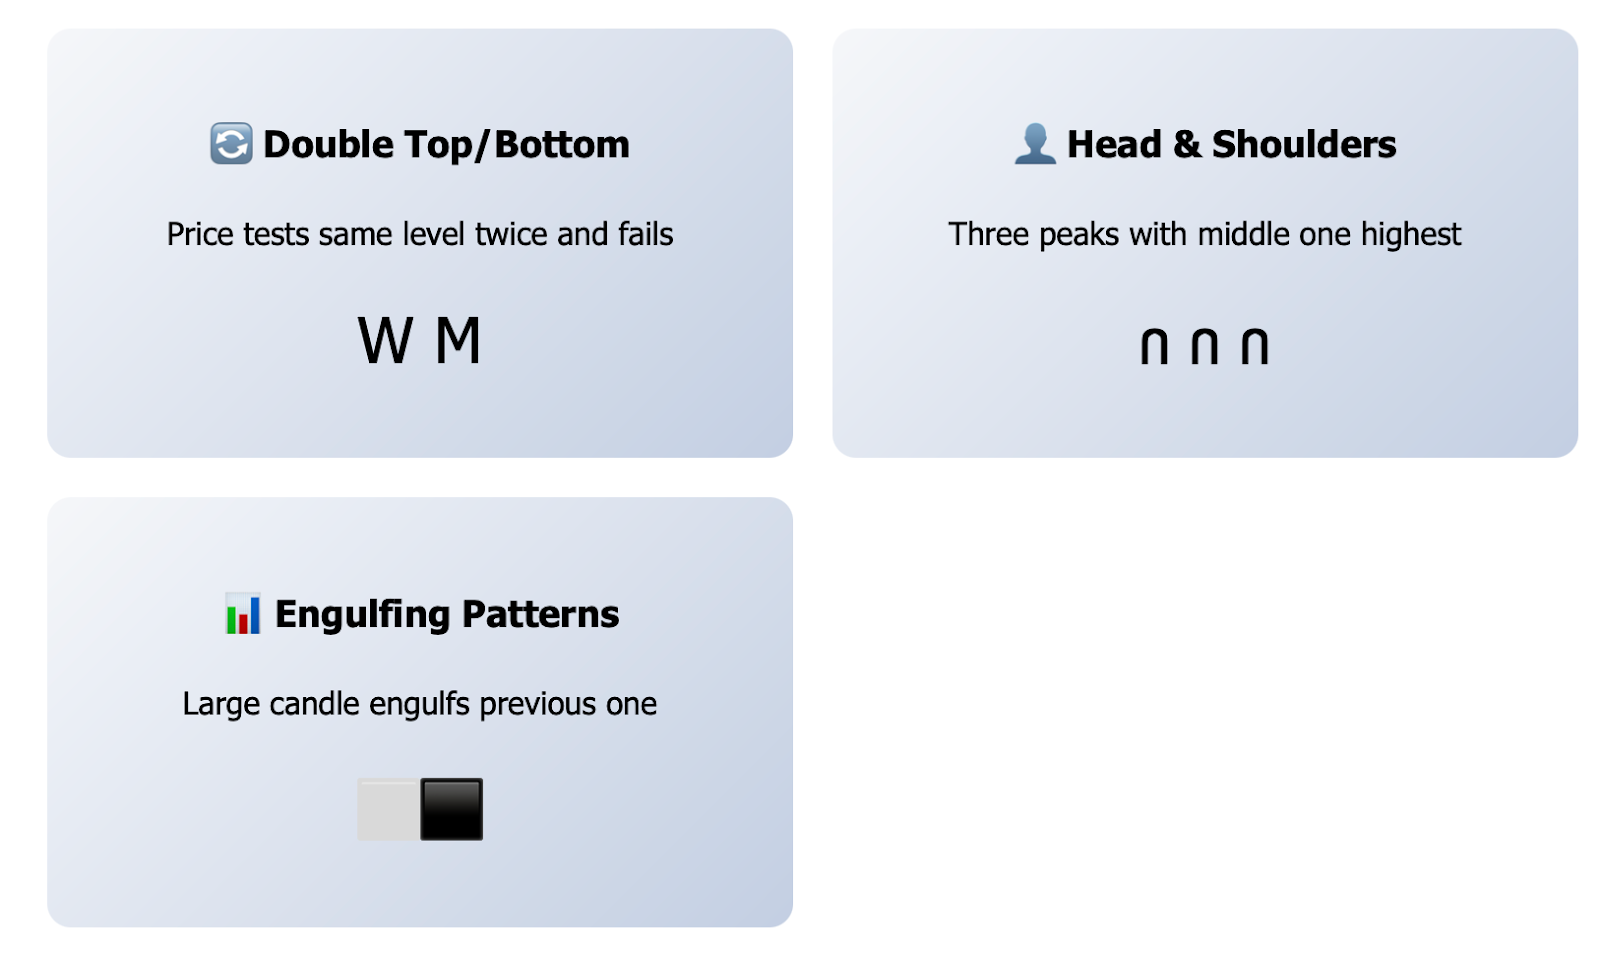
Candlestick patterns with a Double Top or Double Bottom are formed when price tests the same level twice and fails to move above or below the level. This shows diminishing momentum in the current trend, and ultimately, results in a reversal.
Head and Shoulders (and inverted) are known to be one of the most reliable moving average signals for reversals. If you think of an auction with the highest bid being turned down multiple times, at some point, the price has to come down.
Engulfing patterns as well as Piercing Lines provide shorter term signals for reversals, almost always occurring around significant support or resistance levels.
Volume: The Often-Ignored Confirmation
Volume spikes during reversals are not just a coincidence. Generally, when a trend reverses, there is an uptick in trading activity as a greater number of traders hop onto the newly established trend. Dips in volume, on a reversal, can often act as a false positive.
Let’s examine the rise in the USD/JPY pair after the breakout of a Head and Shoulders Bottom formation in early 2020. Upon breakout, an unusually high volume (290% of normal trading) occurred, which will help help validate a reversal is occurring.
The cardinal rule is to never rely on a singular indicator. When you pull together different signals, you might just double your hit ratio. A reversal signal obtained from an RSI divergence, backed by a candlestick pattern and/or volume signals, is more effective reading than just 1 signal alone.
Multi-Timeframe Analysis for Trend Reversals: Confirming Signals Across Charts
Successful reversal trades require an analysis of the entire picture. One candlestick (or series of candlesticks) that appears to establish a reversal on a 15-minute chart may simply be noise on a daily chart. This is the value of multi-timeframe analysis.
Comprehending Timeframe Relationships:
Daily charts depict the greater trend and major reversal formations. They relay the overall market trend and the most dependable signals for continuing that direction.
Hourly charts assist in timing when to enter and exit a trade. Hourly charts are best for assessing price action over a shorter period while still taking the daily chart into consideration.
Minute charts are good for gaining precision in entry points, but alone they will lose perspective.
For example: the daily EUR/USD chart may show a distinct Head and Shoulders reversal pattern, but the hourly chart highlights still slight downward momentum. Again, it might be best to simply wait for the hourly chart to tee up a reversal along with the daily chart signal to begin entering a trade, rather than jumping to conclusions or a trade too quickly.
It's similar to when a student studies every week and receives mixed test scores but accepts how they are still doing well in the course. The weekly test scores won't detract from their overall course performance the same as noise in the shorter timeframe charts won't impact the direction of the weekly and or daily chart periods.
Practical Application From Multi-Timeframe Analysis:
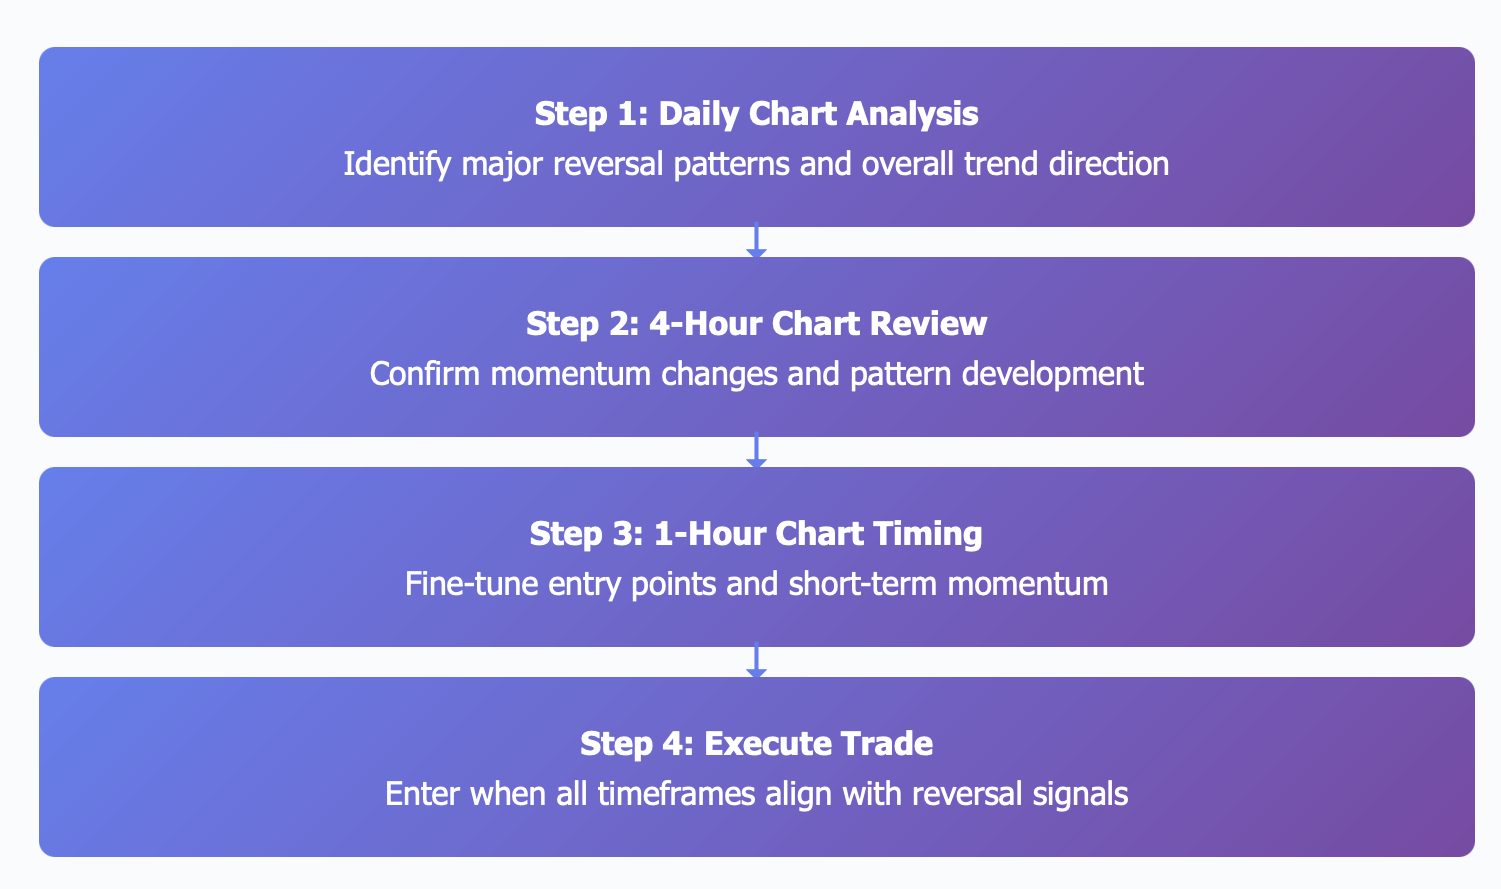
Start with the daily chart for looking at potential reversal setups. Look for the major reversal patterns, candlestick confirmations and/or momentum indicators discussed.
Next drop down to the 4HR or 1HR chart to see how the reversal is developing. Is momentum changing in the opposite direction or just a momentary pause in continuing its current trend?
Utilize shorter periods to time an entry, but always have an awareness of the bigger picture.
The best reversal signals tend to occur when multiple time periods align together. Your chances of multiplier success increase significantly when both the daily chart, the 4-hour chart, and the hourly chart are giving you the same reversal signal.
Never trade against the trend of a larger time period unless you have compelling evidence to suggest there has been an actual reversal. Even then, expect some false starts and whipsaws.
There is Market Psychology Behind Trend Reversals:
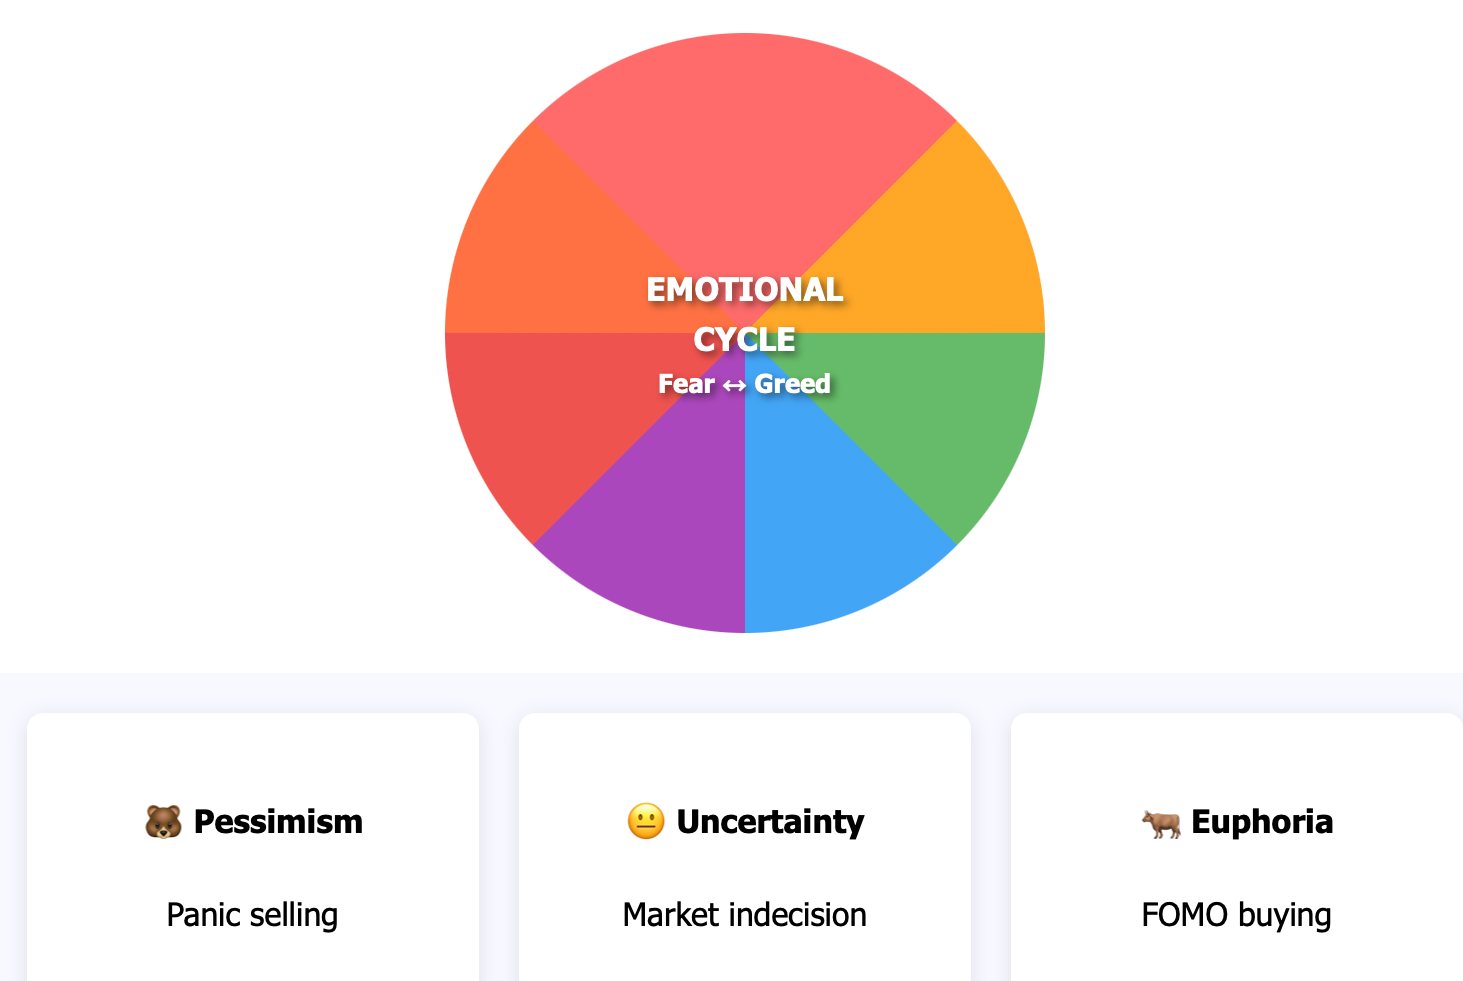
There is something that exists behind every chart pattern, every technical indicator, and every price tick that is the result of human emotion. Understanding market psychology gives you the insight to discern between real reversals signals from false signals.
Here is the Emotional Cycle of Markets:
Trends rarely terminate gradually – they tend to climax into emotional extremes. Bullish trends end with anticipation turning to euphoria, and a bearish trend bottoms when pessimism turns into panic.
Greed drives trends outside of rational levels, and when reality sets in, fear causes abrupt reversals. Group think reinforces both results, as it takes the herd for an embrace of action for real momentum to shift significantly.
Indicators of Sentiment for Confirmation of Reversals
The COT report describes what large commercial traders are doing as well as big speculators. When speculators (typically smaller traders) are at extremes in their positioning, reversals tend to follow.
Indicators of volatility like the VIX are ways to observe the "fear" in the market where extreme readings often mark a reversal point.
An example could be the March 2020 market panic. The fear reached such extremes, it was a signal to buy for those that had the guts to act on it. It's like the crowd at a football game - the emotions often shift performance of the players and extreme emotions signal turning points.
Points of Psychology
Look for capitulation - the point at which the last bulls to get shaken off become bears (and vice versa). This usually appears as a very sharp high volume spike in the opposite direction of the prior trend.
Look for divergence between price and sentiment. When everyone is bearish and price stalls falling or everyone is bullish and price stalls rising, usually a reversal is pending.
Market psychology is not simply theory but a practical reference point to time reversals. When you can confirm technical signals with emotional extremes, you have a high probability trading opportunity.
Practical Trading Strategies for Trend Reversals: Step-by-Step Forex Guide
Now it's time for practice. Here's how to trade trend reversals in a practical manner without losing your shirt in the process.
Entry Point choices:
Breakout entries usually work best when you have a clear reversal pattern complete. In the case of a Head and Shoulders Bottom, go long on price when it breaks above the neckline that confirms the move with volume.
Pullback entries usually give you a better risk-reward profile. Usually you wait for the price to return to the breakout level, after the initial reversal move. The retest often provides a lower risk entry.
Stop-Loss Placement:
Add stops to the structure of the pattern and not some random number or psychological level. For example, for a Head and Shoulders pattern you would place stops below the right shoulder for bullish entries (and above for bearish).
And keep in mind market volatility. Use Average True Range (ATR) to expect different levels of volatility. If you have a stop too tight, you may get stopped out just from "normal" market noise or velocity. And if you use stops that are too far away, you are exposing yourself to too much risk unnecessarily for every trade.
Take-Profit Strategies:
Measure the moves based on pattern height. For example, for Double Bottoms you will determine your target as the distance from the low to the resistance level and project that distance from the breakout point to calculate your target.
Also consider using trailing stops to capture the extended move. Obviously, you will want to collar a certain amount of profit as the price moves in your favor and allows the trend to develop.
Position Sizing and Risk Management:
Never risk more than 1-2% of an account on one trade. Reversal trading can be volatile, and requires the ability to remain in a trade for a strategy to work in the long run.
Consider scaling into a position. Enter a partial position on the first signal, and once the reversal appears valid, add to a winning trade.
The EUR/USD Head and Shoulders Bottom late in 2022 was a textbook example of a reversal setup. The setup took months to form, and when the neckline was broken, there was significant volume that confirmed the breakout. Those that entered on the breakout, and managed their risk properly, were rewarded with a move worth many hundreds of pips.
Reversal trading can be understood as placing a bet on a coin that has been coming up as tails repeatedly. Statistically, the coin will eventually flip heads, but it is critical to maintain proper risk management, as the next flip can still come up tails again.
Key Points to Implement Reversal Trading:
Always plan the trade before entering. You should know your entry, stop, and target price before you enter the trade.
Be patient with reversals. Reversal trades can take a long time to set up, and may test your patience with false starts.
Keep records. Have documentation of which reversal setups appeared to be valuable for you during trading, and what market conditions you found them in.
Risk Management in Trend Reversals: Protect Your Capital While Trading Forex
Reversal trading can be very lucrative, but it also carries its own degree of risk. False reversals can ruin the account of unprepared traders; therefore, risk management becomes paramount.
Recognizing False Reversal Risk:
Not every reversal signal is indicative of a change in trend. The markets have a tendency to fake traders with false breakouts and failing patterns. Such "head fakes" can be expected, because they are part of the scene and not a reflection on you or your account.
The key is to weather false signals and put yourself in a position to profit from true reversals. Consider this to be like limiting loss in a casino situation; a trader protects their bankroll for the opportunities that matter.
Position Size Rules:
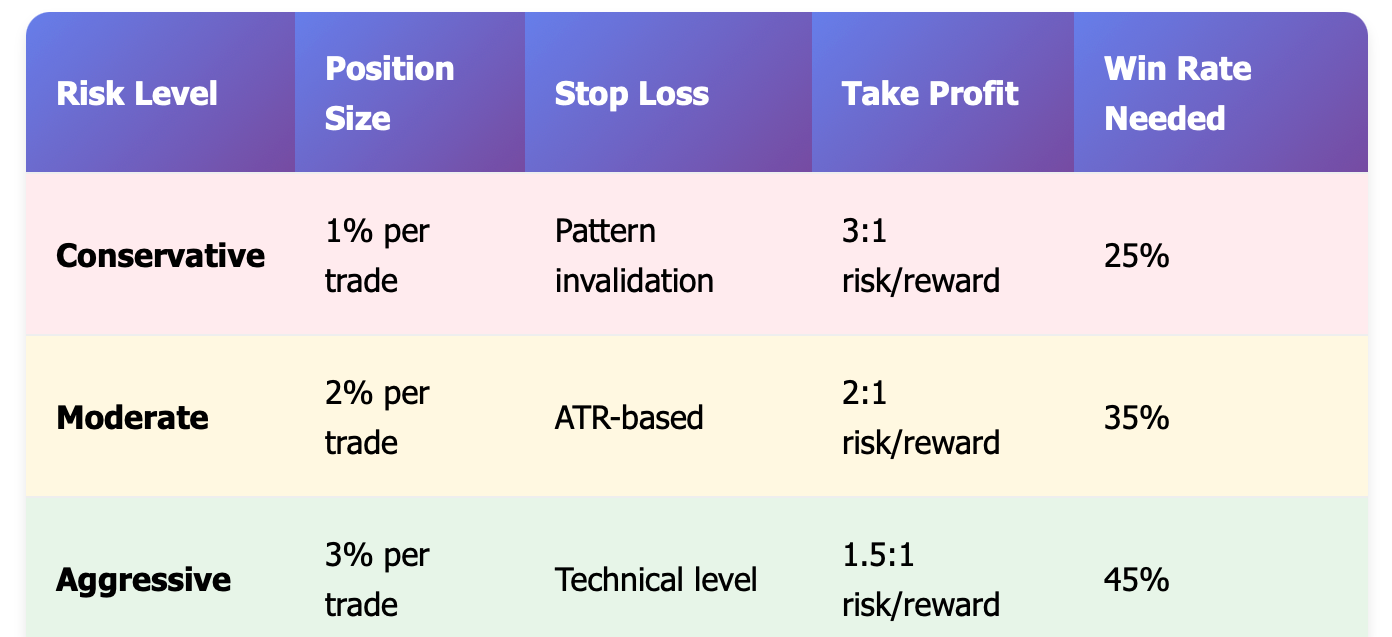
First, do not risk more than 2% of your total capital on one reversal trade. If you follow this one rule, you will stay in the game long enough to profit from successful reversals.
Second, when trading less reliable setups or in volatile conditions, use smaller position size. Featuring consistent smaller profits may be better than blowing up your account on one bad trade.
Stop-Loss Strategy:
Place stops based on pattern invalidation, not arbitrary percentages. If a Double Bottom pattern breaks below the most recent low, you are no longer in valid setup, regardless of your comfort level of losses.
Avoid moving stops in an unfavorable direction. If prices are going against you, simply take the loss and move on. Opportunities are always right around the corner.
Managing to Profitable Trades:
Once you've gotten a trade to move in your favor, allow profits to run with trailing stops. This allows you to participate in extended moves while protecting against a potential loss of profit from a sudden reversal back in the opposite direction.
Consider taking partial profits at key resistance levels. This allows you to lighten up on a larger position size as you should pay attention to increasing risk if a position reverses on you, while still maintaining some exposure to potential extended moves.
Real World Risk Management
Professional traders often limit their maximum loss per trade to between 1-2%, while aiming to target 3-4% gains. This creates a risk/reward ratio that is still profitable even if they are winning less than 50% of the time.
The goal here isn't to be right 100% of the time. The goal is to simply make more money on a winning trade than the loss on a losing trade while allowing yourself the opportunity to 'stay in the game' for if and when the probabilities turn in your favor.
Using Real-World Forex Market Case Studies to Truly Understand Trend Reversal
No example beats real time examples in the market. I want to take a look at some significant trend reversal examples to provide clarity on how to understand what I have introduced.
Case Study 1: EUR/USD Reversal (December 2016 - January 2017)
The EUR/USD has been in a long-term bear trend since 2014, falling from 1.40 to below 1.04. In late 2016, we had a number of reversal signs converge:
-
We saw bullish divergence in RSI on the daily chart
-
We saw the Double Bottom around the 1.035 level
-
We saw substantial volume in the second test of support
-
Sentiment was very negative as most analysts forecasted for parity
The reversal began with a break above 1.06 confirming the Double Bottom. Traders who bought on the breakout resonated the move up to 1.25 over the following year - nearly 2000 pips!
Key lessons:
-
Wait for several confirmations to trade reversals
-
Extreme sentiment is often a turning point
-
Be patient – big reversals take time to develop
Case Study 2: GBP/USD Brexit Bounce (October 2016)
After the referendum, the GBP/USD collapsed from 1.50 to 1.20 in only a few months. In October 2016 we had a classic reversal setup:
-
Price broke out of a clear Head and Shoulders Bottom
-
The MACD showed bullish divergence
-
The breakout coincided with major support from the 2009 lows
-
The volatility was extremely high, indicating potential capitulation
The reversal signal was given when the breakout across the neckline happened at 1.24. Over the next few months, even with Brexit uncertainty still in play, the pound rallied to 1.35.
Important Takeaways:
-
Major support levels are often coincident with reversal patterns
-
High volatility measures can create an emotional extreme, the apex before reversal
-
Fundamental news doesn't necessarily negate the technical signals
Case Study 3: USD/JPY Reversal (March 2020)
The market panic driven by COVID-19 created extreme volatility in all markets across the globe. The USD/JPY currency pair had been ranging between 108-112 when overnight the pair shot to 112 only to collapse to 101 within days after the initial spike.
In terms of reversal signals note the following:
-
A massive spike in volume at the low of 101
-
A hammer candlestick on the daily chart
-
As the VIX reached extreme levels signaling panic selling
-
Rumors of central banks intervening at key support
The reversal of USD/JPY was immediate and powerful eventually climbing back above 110 in only weeks.
Main Lessons:
-
Crisis-induced actions often give rise to the best reversal possibilities.
-
A volume snap at a significant level can provide confirmation of a reversal.
-
The best trades sometimes occur when everything feels wrong.
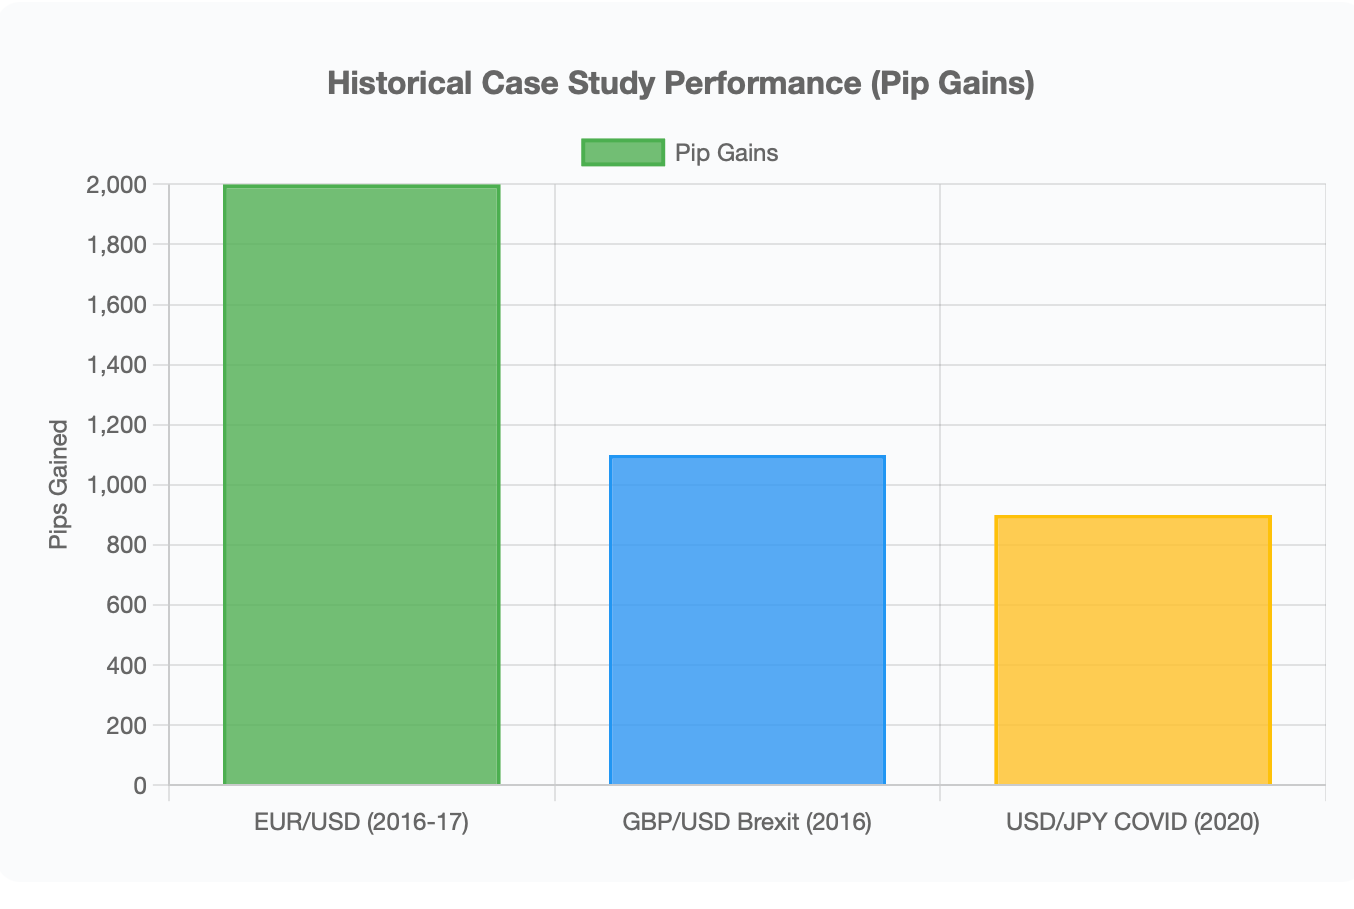
From these case studies, we recognize that successful reversal trading requires patience, multiple confirmations, and the courage to pull the trigger when conditions make sense. The patterns repeat, while market realities and timeframes change, so while each outcome is unique, the approaches remain the same.
Conclusion & Practical Tips: Learn to Trade Forex Trend Reversals with Proven Methods
There is no magic indicator or setup that will provide 100 % reliable trend reversals. Instead, trading Forex trend reversals is predicated upon solid knowledge of market psychology, using a combination of technical signals, managing risk appropriately and waiting for the proper setups.
So, here are the key takeaways:
-
True reversals are not the same as retracements or consolidations. Look for fundamental shifts and changes in structure. Not just a pull back or pull in.
-
Use multiple indicators and timeframes to provide confirmations. A single indicator can be fooled, but multiple indicators are rarely fooled.
-
Volume and sentiment provide great confirmations. In fact technical patterns or indicators alone (without volume) or at normal sentiment levels are typically false confirmations.
-
Good risk management keeps you in the game. Having the best analysis ultimately means nothing if poor position sizing blows your account out.
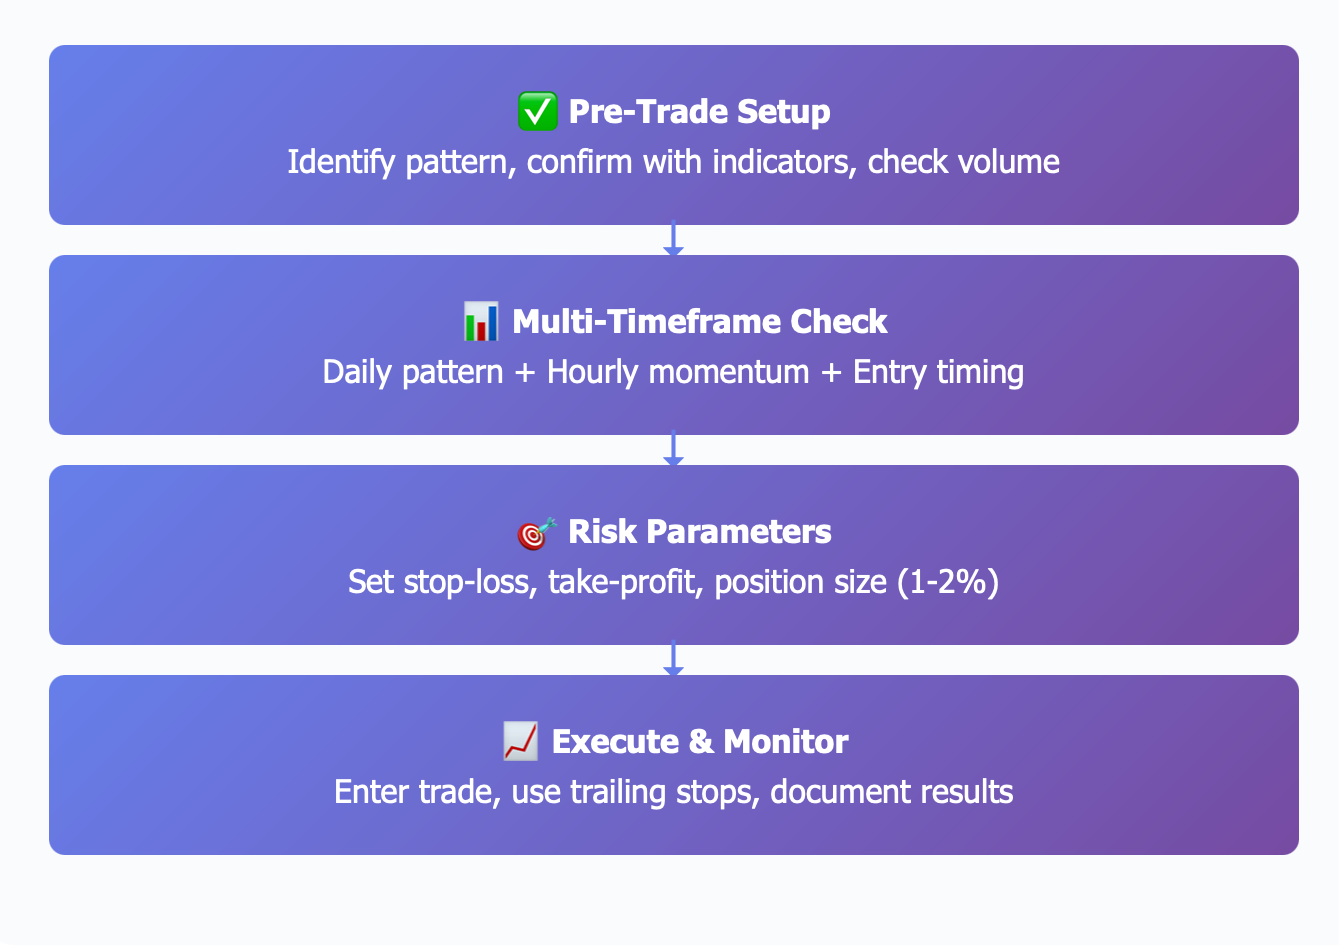
Your Action Plan:
Begin your studies with reversal patterns on daily charts of major currency pairs. Identify clear, obvious cases of reversals before you attempt to trade the more subtle examples.
Practice multi-timeframe (MTF) analysis without putting any money at risk. Open up demo accounts or practice "paper trading" to sharpen your skills.
Maintain a trading journal of reversal setups, whether you win or lose, that will help you identify the setups that work best for your trading style.
Keep in mind, reversal trading is a blend of art and science. The technical tools provide the framework, but market psychology, as well as proper risk management practices, will determine your long-term success in trading. Maintain discipline, patience, and let the probabilities work in your favor.
So, ready to apply your new trend reversal knowledge? If you want to begin consistently earning profits trading Forex, join the thousands of successful traders globally who use TradeWill for their Forex trading needs.
Disclaimer: The content of the blog does not represent any position of Trade W, does not serve as any trading-related decision advice, and does not endorse any third-party.