

 Trade W

Introduction: Why Yield Matters in Forex.
The yield is what you receive for holding a currency or investment over time. Yield in the forex market is the difference in interest rates between two currencies that allows traders to profit from the difference. The easiest way to look at it is like "rent" for lending your money at any given moment to a country by holding its currency.
In this situation, yield becomes magical when there's a big difference between what two countries pay to borrow money. If the US Federal Reserve sets interest rates to 5%, while Japan is near 0%, that 5% difference is a goldmine for a trader knowing what to look for! This is called a carry trade - you borrow the lower-yielding currency (Japanese yen) and buy the higher-yielding currency (the US dollar), keeping the difference for yourself!
Consider the USD/JPY pair when comparing 2019-2020. Traders were getting paid to hold dollars against yen while the Fed maintained a higher rate than Japan's near-zero rate. As a trader, this seems like you were getting paid to hold a position. It is easy to see why professional traders geek out over interest rate differences.
Yield is more than just earning money from interest rate differentials. Yield signifies opportunity cost in the marketplace. When you hold one currency over another, you're making a bet on which economy's policies will pay you more. Yield gives you insight to see these hidden profit opportunities that many novice traders miss altogether.
Yield 101: What Are the Types and How to Calculate Them
Now let's break yield down into manageable and digestible bites. Picture yield types like different types to gauge how fast your car is going, you might look at miles per hour, kilometres per hour, feet per second; they all give you the same fundamental information, from different angles.
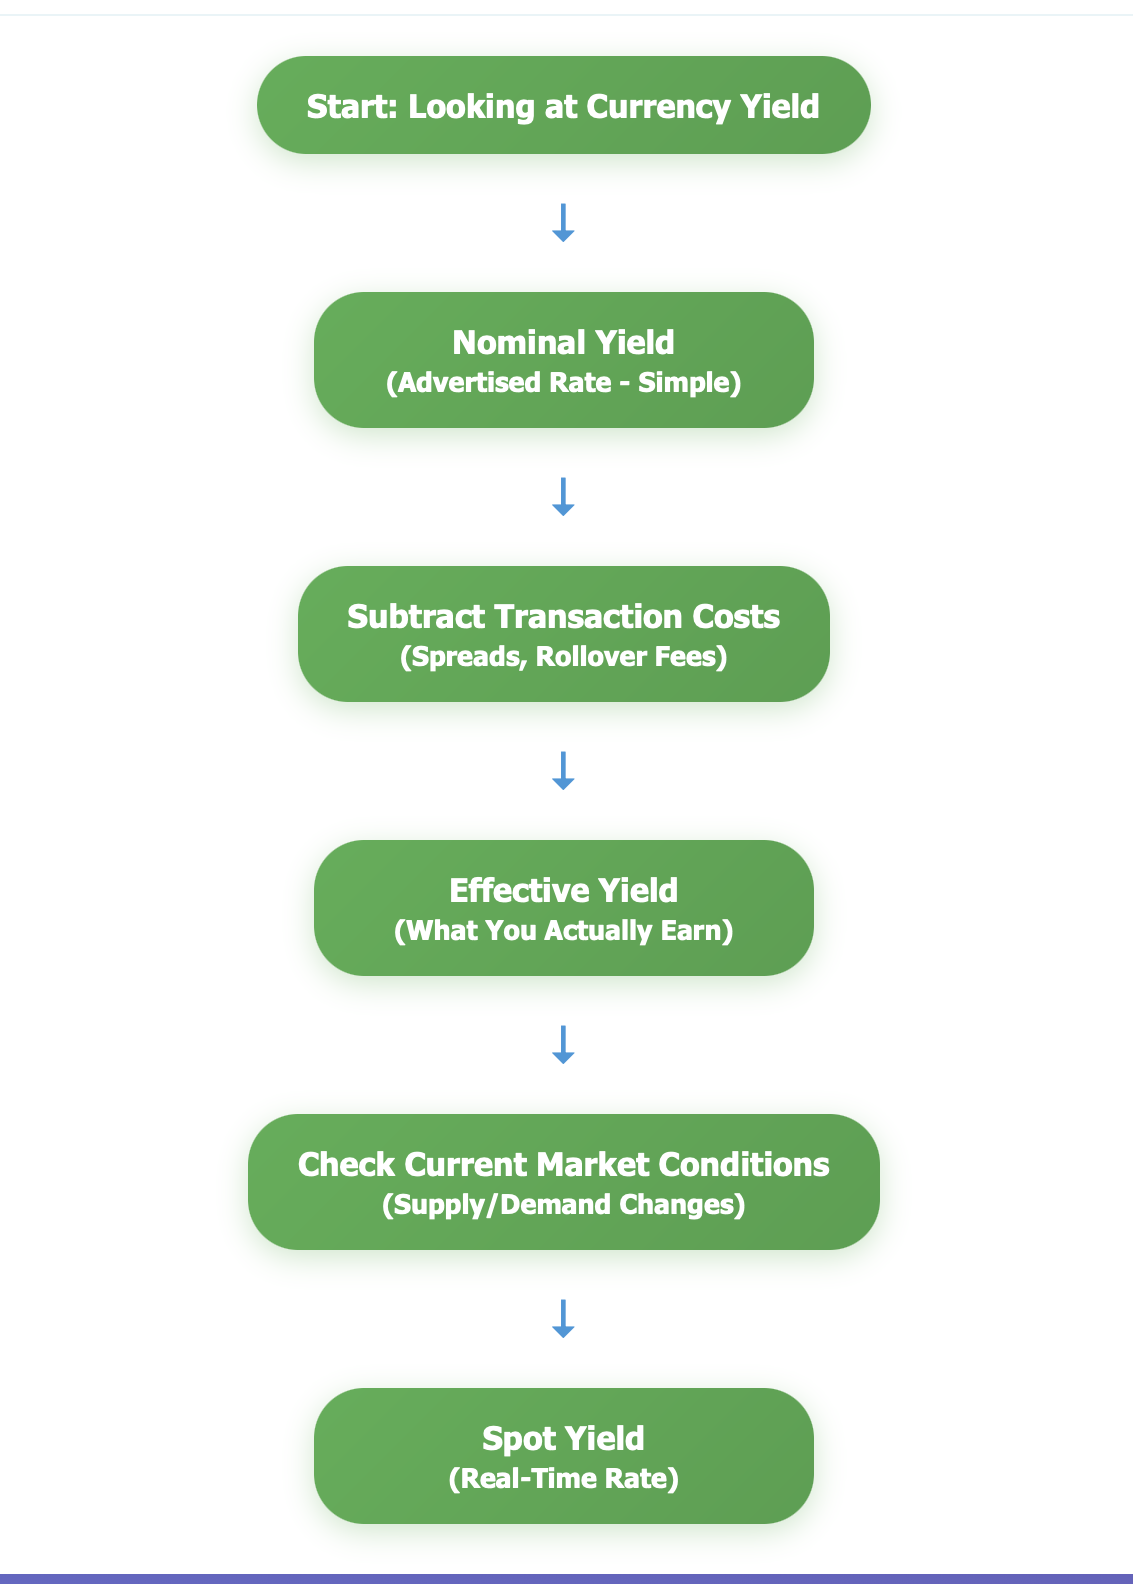
Nominal Yield is the simple advertised interest rate. If the central bank of Australia sets rates at 4%, then that is the nominal yield. Simple, clear, and straight to the point, like the sticker price on the car.
Effective Yield accounts for compounding and fees to calculate what you actually earn. Going back to the car analogy, effective yield would be your actual mileage based on road conditions and traffic. If you are getting 4%, but you are paying 0.5% in transaction costs, that'd make your effective yield 3.5%.
Spot Yield indicates current market conditions and current yield. It is constantly fluctuating, based on supply and demand, much like gas prices adjust throughout a given day.
For example, let's assume that the U.S. pays 5% interest and Japan pays 0.5%. The difference in the interest rate is a difference of 4.5%. If you are to invest $10,000 into this carry trade for one year, you would rationally receive $450 based on the yield difference alone (this example does not factor in currency appreciation/drop, though!).
The formula is clear, Annual Yield = (Higher Rate - Lower Rate) * Principal Amount
But again, remember that the forex yield is directly related to what the central bank determines interest rates would be and what inflation exists. When the Fed announces to raise interest rates in an effort to combat inflationary pressures, the USD yield would be increased, and thus the yield on dollar-denominated investments would be appreciated. It is kind of like a store having a sale and suddenly attracting lots of new shoppers.
This flux goes in both directions. Increasing inflation leads to increasing interest rates, which leads to an increase in nominal yield, but a decrease in purchasing capacity may reduce effective yield as well. In effect, smart trading would be cognizant of any and all interest rate announcements and inflation data in an effort to forecast which way the yield may be heading.
History and Market Context of Yield
Forex yield did not just pop up overnight; yield had developed in tandem with the global financial markets through decades of economic policies and new market innovations. Understanding that history will provide you with an idea of where yields may head next.
In the 1980s, when rates in developed countries were regularly above double digits, yield hunting was a very different story. The US had rates above 10%, and dollar investments were exceptionally attractive to investors looking to hunt yields. Now, 5% is considered really high. The world has changed since then.
These shifts come from changes in central bank policy. When the US Federal Reserve adjusts the federal funds rate up or down, it sends shockwaves through every currency pair that uses the dollar. The financial crisis of 2008-2009 is a great example. As central banks moved to cut rates and set them close to zero to stimulate their economies, all traditional carry-trade transactions collapsed overnight.
Think about the climate changing seasonally. Just like farmers have to change their crops with the changes in seasons, Forex traders have to change their strategy to fit the climate, too. During the recession, for example, the "risk-off" climate caused investors to flee to "safe-haven" destinations such as the US treasuries and Swiss francs, regardless of the lower yields.
The European Central Bank's progress serves as another fantastic illustration. Beginning with comparably high rates in the early 2000s, the ECB eventually began pushing rates into negative territory following 2014. This signaled substantial opportunities for those willing to borrow euros and invest them in higher-yielding currencies such as the Australian dollar or British pound.
Additionally, recent years have introduced some massive challenges and opportunities. Following emergency rate reductions generally due to the COVID-19 pandemic, aggressive rate hikes emerged in response to increased inflation. These fast-moving rate changes resulted in some of the highest yield volatility in decades; yield traders had tremendous opportunities with high risk exposure.
What's the takeaway? Macro policies are not just backdrop noise; they are the leading force behind movements in yield. Notably successful yield traders learn to interpret communications and data from central banks and monitor trends in policy like weathermen analyse satellite images.
Yield vs Other Asset Classes: Comparing Returns Across Markets
Forex yield doesn't exist in a vacuum. To fully evaluate the value of forex yield, it is important to understand how it compares to other investments. It is similar to choosing between transportation options, where each has advantages depending on your destination.
Forex yield has some unique advantages, like liquidity, a 24-hour market, and leverage. Whereas otherwise an investor expects an annual dividend of 2-3% on common stocks, a forex carry trade could earn an investor 3-7% from merely interest rate differentials, not even counting any favourable movement in currency. The downside? Currency risk can become disadvantageous just as strongly.
Stock dividends provide reliable revenue but typically earn 1-4% in a year for blue chips. These are like rental property, in that revenue is predictable, but there is no upside appreciation unless the underlying asset appreciates. Furthermore, stocks have risks of a specific company, which currencies do not have.
Government bonds provide both stability and predictability. Of course, US Treasury bonds provide 3-5% depending on the duration invested, and the risk of default is virtually zero. They are the tortoises of this equation (slow and steady). The consequence is less return and less flexibility than in forex.
Cryptocurrency yields from staking or DeFi protocols can range from 5-15% or potentially higher. However, these investments expose investors to extreme volatility and the unreliability of regulation. It's like driving a race car; when using a sporty car for personal or business use, you generate a thrilling potential return, but the crash risk is infinitely higher than that of a traditional car.
Consider the following comparison of actual performance calculated from 2019 to 2023. The average USD/JPY carry trade performed overall at a 4-5% annual yield from interest rate differentials. During that time frame, the average dividend yield in the S&P 500 was approximately 1.8%, and about 2-4% for 10-year Treasury Bonds. The forex trader can collect competitive income potential and further opportunities for gains through currency appreciation.
The one important observation here with the above comparison is that I find forex yield to have better risk-adjusted Returns v. a typically structured income investment. When factoring in what your return would be if weighted against liquidity and flexibility. You can cash out or enter a forex position within seconds to pursue opportunities; unlike selling a bond or stock, which is subject to costs and market structure.
Ultimately, I could see a smart allocation to a portfolio having something available to collect yield, including forex, among all other asset classes, to remain diversified, help smooth out the transaction-to-transaction returns and provide opportunity across various types of market opportunities.
How Yield Interacts with Monetary Policy
Central banks are the great controllers of the forex yield. They can change yield calculations around the world just by issuing a statement, saying, or hinting at something. Understanding this relationship is like learning the rules of the game before getting in the game.
When the FOMC raises interest rates, the USD yield instantly becomes more valuable. This cause and effect has not gone anywhere; it is just like the supply and demand of the whole, the higher the rate of interest, the higher return of holding a dollar. So, if the higher return on investing dollars, the higher demand will be for dollars. Of course, this was absolutely true between 2022 and 2023 when the Federal Reserve became very aggressive in raising rates in order to combat inflation, and it made dollar-based investments very attractive after years of pushing the rate down to almost zero.
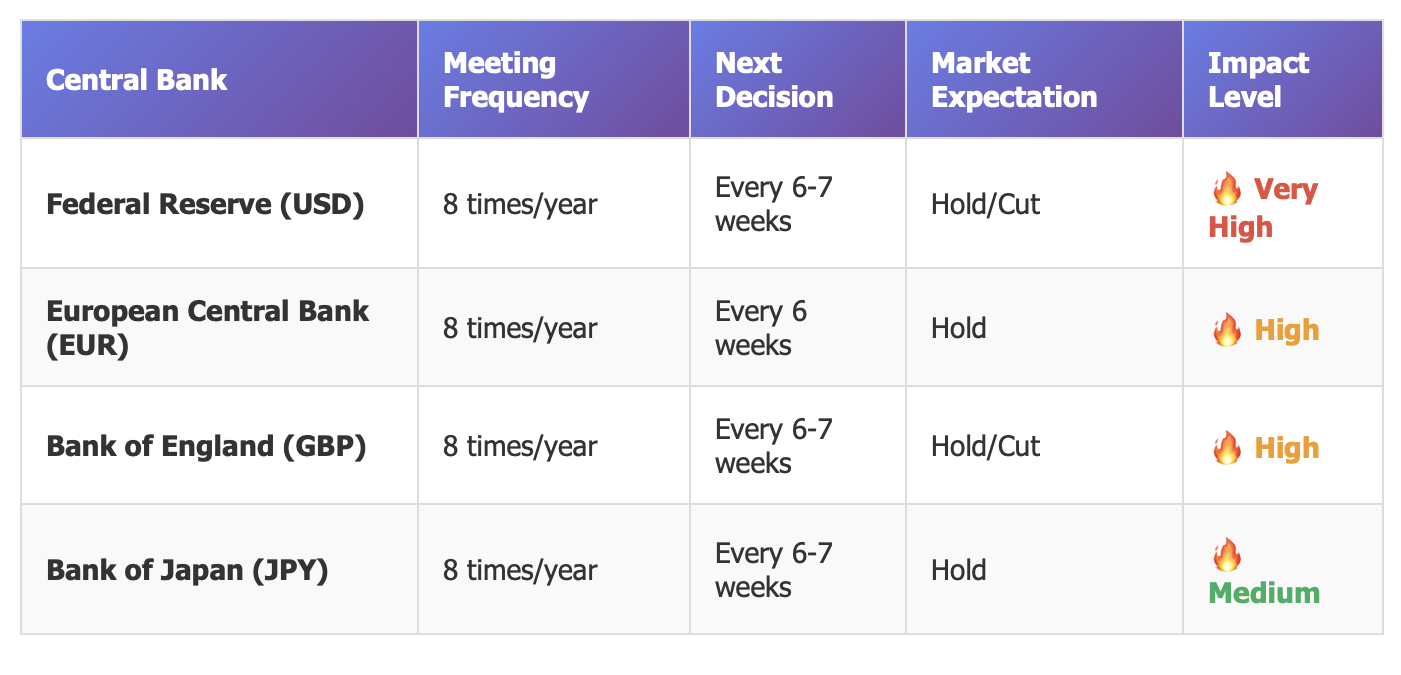
This continues to become even more interesting, and the next thing to dip into is that the markets don’t only respond to what central banks are doing, but also to what they are perceived to be doing. For instance, if traders are anticipating the ECB to raise rates in the following month, the EUR yield may already be improving without an announcement. It is similar to the stock move based on earnings expectations and not the actual earnings.
The European Central Bank serves as an excellent example. When ECB President Christine Lagarde transitioned from dovish (rate-cutting friendly) to hawkish (rate-hiking ready) messaging during 2021-2022, EUR yields began to improve even before rates were raised. In this case, traders turned bullish in anticipation of the wait-and-see policy shift.
Central bank communications are akin to weather forecasts. You might bring an umbrella based on a rain forecast, and forex traders adjust their yield strategies based on the central bank policies. The difference is that central bank "forecasts" become self-fulfilling prophecies as traders adjust their positions ahead of the formal move.
Which brings us to note that rate decisions are not made on their own. Central banks take inflation, employment, economic expansion, and global conditions into account. When things line up, it leads to predictable changes. High inflation and strong employment will likely lead to rate hikes, and yields will improve for that currency.
The takeaway here is to simply follow central bank calendars, read the statement, and consider economic data. Economic calendar listings show you when the important announcements are coming so that you can position your yield trades to your advantage.
Observing monetary policy trends is not only about forecasting the next rate adjustment; it is really about understanding the whole cycle. Central banks typically begin increases or decreases in sustained campaigns, which create long periods of yield gains or yield losses.
The Yield Curve and Forecasting
The yield curve may sound complicated, but it is fundamentally a simple concept, one with great forecasting potential. Imagine a graph depicting different interest rates over different periods, with short-term maturities on the left and long-term maturities on the right. The shape will tell you a story regarding the direction of the economy and currency values.
Normal (upward sloping) yield curves will show relatively higher rates for longer-dated maturities, which makes sense, seeking greater compensation for locking up your money for longer. For example, if you pay for a longer duration gym membership, you would expect a certain yield or higher fee compared to a month-to-month membership. If the yield curve displays this shape, it suggests a healthy economy and normal growth expectations.
If the curve is inverted, then an oddity occurs. Short-term rates exceed long-term rates. In other words, the curve slopes downward. An inverted yield curve is often a signal of future economic trouble.
When short-term interest rates are much higher than long-term rates, investors are effectively stating, "Things are risky now, but will get better later." Historically, the use of inverted yield curves has forecasted the majority of US recessions.
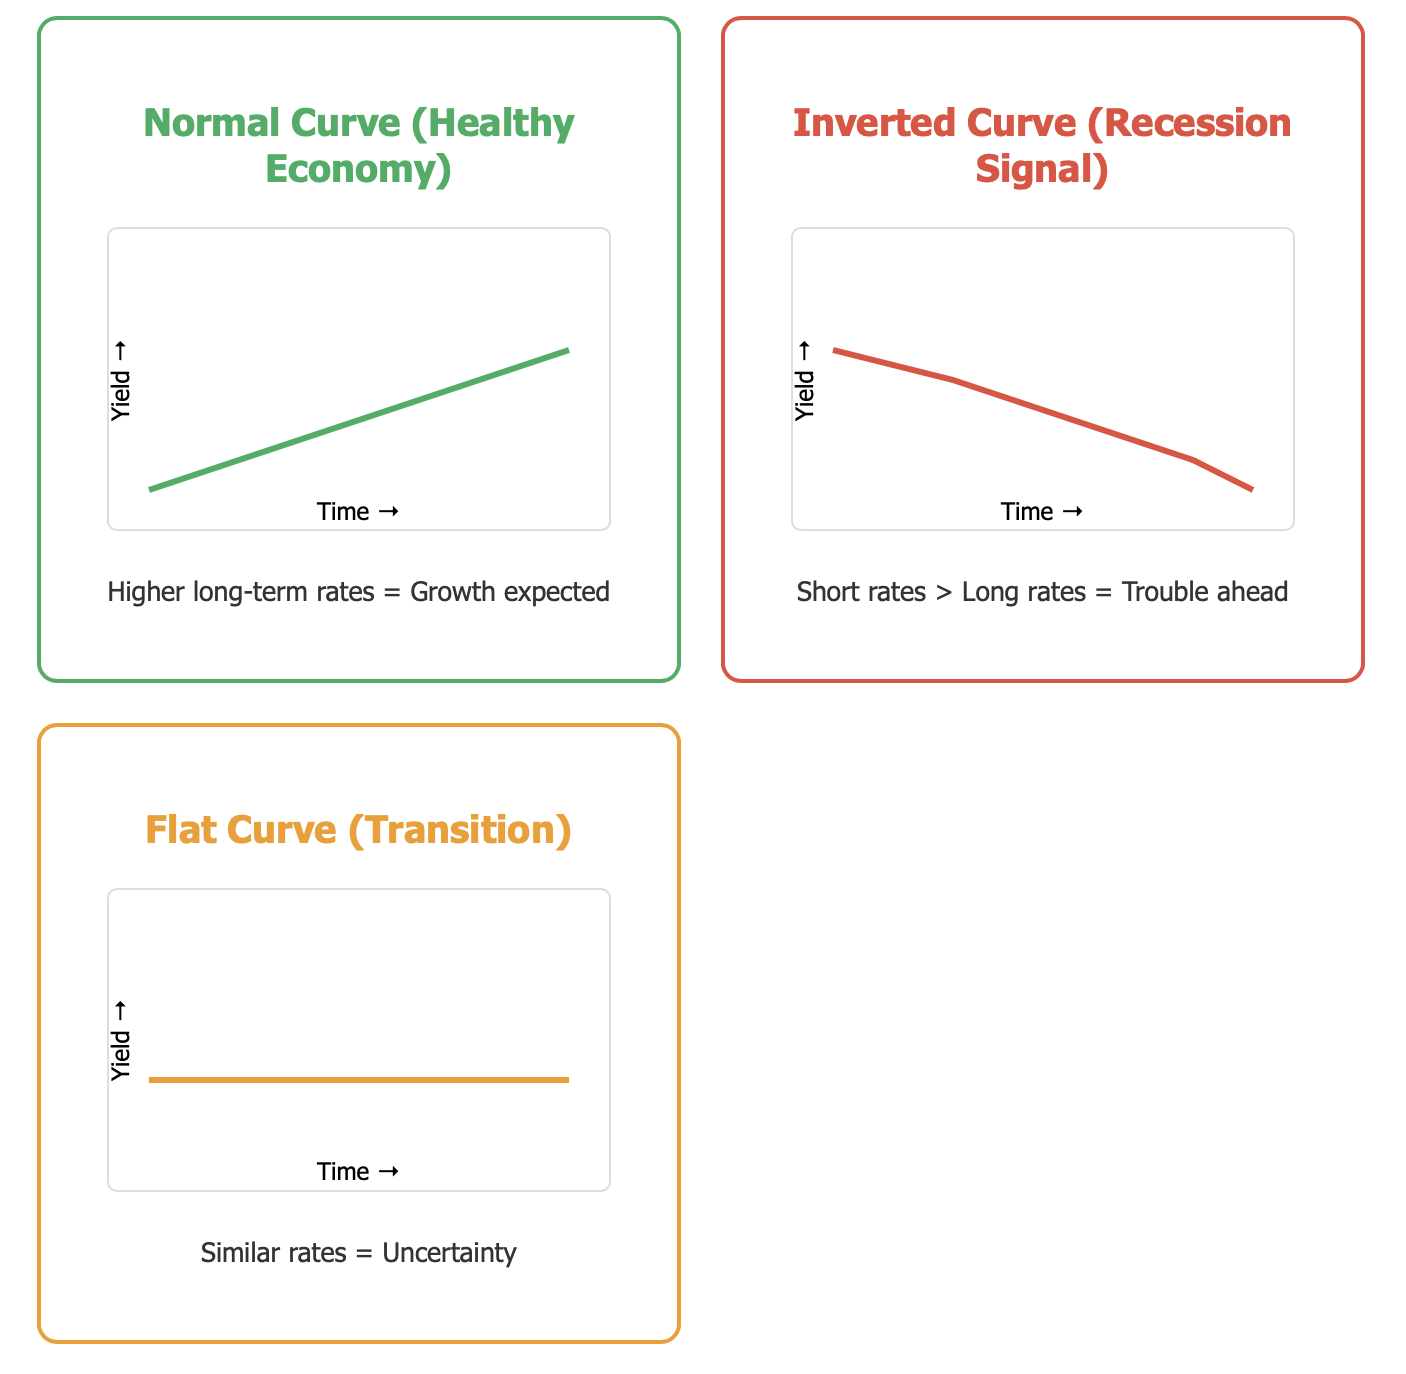
Flat yield curves indicate there is little difference between long-term and short-term interest rates. These characteristics typically occur when the economy is transitioning from growth to recession or vice versa. It is similar to being in neutral gear - you're probably not doing much, but neither are you moving in one direction forward or backwards.
Subsequently, in early 2019, the US Treasury yield curve famously inverted, the 10-year bond yielding less than the 3-month bill. Upon this occurrence, a number of economists began to predict - correctly, as it turned out - that this was a sign of weakening economic activity, which subsequently happened to occur with the 2020 Covid Pandemic recession. Forward currency traders, who are well-equipped to notice this signal, would position themselves adequately, which may even seem to be favouring safe-haven currencies.
For Forex yield strategies, yield curve analysis can help foresee changes in central bank monetary policy decisions. For instance, a steepening yield curve, which indicates longer rates are rising faster than shorter rates, is a signal that central bank monetary policy could be raising rates in the near future. A steepening yield curve could then present an opportunity yielding a more advantageous carry trade moment. Conversely, a flattening yield curve could underscore risks that suggest central bank monetary tightening happening in the near future, and again, possibly affecting the price of a high-yield currency adversely.
Consider just your own personal finances as an example. If you were willing to place your money in a 10-year CD for the same rate as a 6-month CD, you might be expecting rates to go down. This thinking applies to entire economies as represented in their yield curves.
The practical side is simple: just look at the yield curves of the major economies of the currencies you trade. If the curve is steep, this is good for carry trades; if it is inverted, be cautious and think about the potential for safe-haven trades.
Misconceptions and Risks
High yield does not mean guaranteed profit - this, perhaps, is the most risky misunderstanding in forex trading. This is similar to assuming the car that starts the fastest wins the race without considering the skill of the driver or the condition of the road. Currency movements can easily risk any advantage one may have earned from yield, resulting in losing out on a potentially profitable carry trade, just like that.
The Swiss franc shock of January 2015 is perhaps one of the best examples of this. Many traders were short CHF (the Swiss franc) for higher-yielding currencies, collecting yield income on their position for months without issue. Then, after weeks of speculation, on January 15, 2015, the Swiss National Bank (SNB) unexpectedly lifted its currency cap against the euro, causing the CHF to spike 20-30% against almost all currencies in minutes. The yield accumulated over the months for these carry trades disappeared in minutes,, and many traders lost substantially.
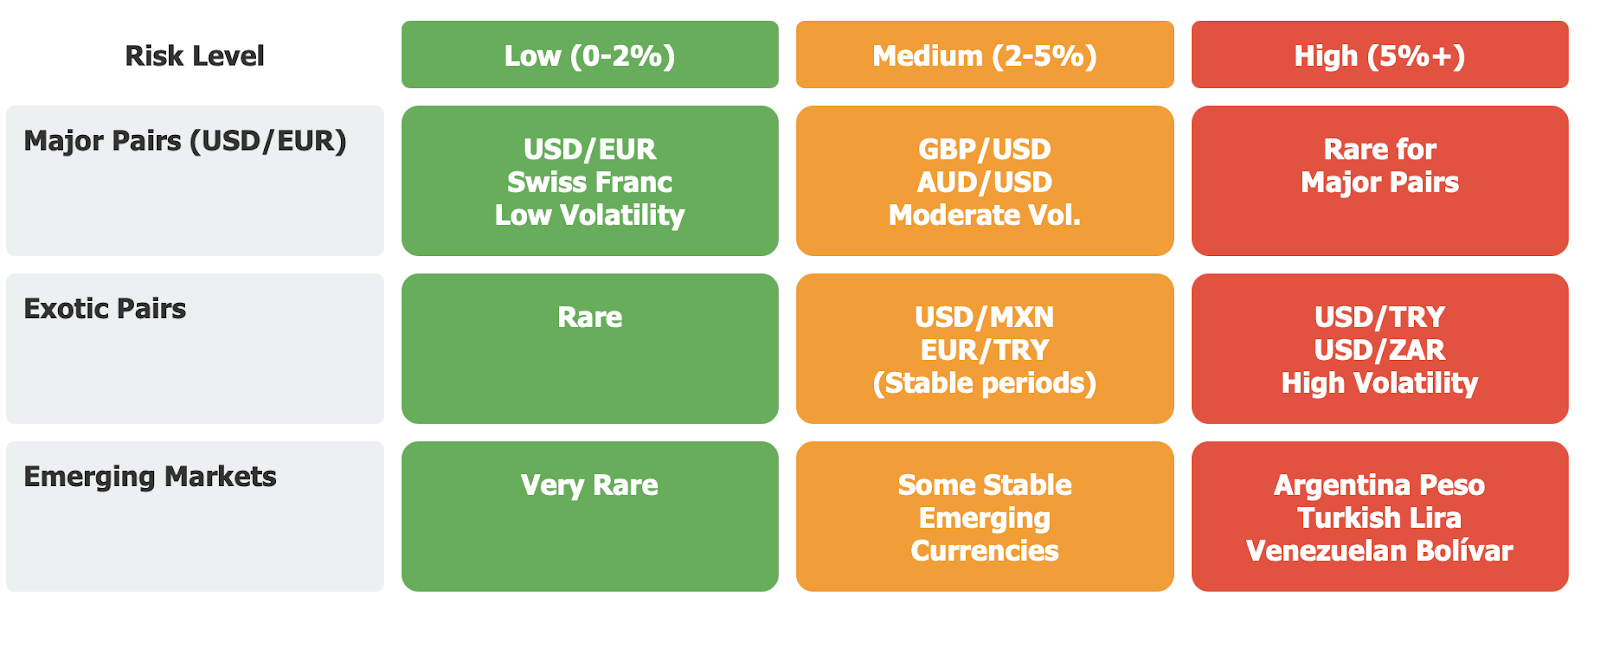
Another risk that traders often overlook is interest rate risk. Just because a currency provides a high yield today does not mean it will tomorrow. Central banks change their policies, and if they cut rates, you will lose your yield advantage altogether. There were attractive yields in Turkey's lira in part due to the carry trade during 2021 and 2022, but with profound political pressure on the central bank to cut rates, the enormous volatility and consequential losses suffered by yield players illustrated how quickly the risk can turn.
The ‘yield’ calculation is often erroneous, including transaction costs, rollover timing differences, and inappropriate calculations of annualised returns. Newer traders often take a 0.5% daily rate and assume that its annualised return is 182.5% (0.5% × 365 days), thinking intuitively in annual percentages rather than daily percentages.
Fast currency volatility can also quickly outstrip advantages for yield. A 4% annual yield advantage means nothing if, in a month, the currency moves 10% against the trader. A hypothetical example might illustrate this: you earned $40 in legal interest, and yet you lost $1,000 in principal value. The math just doesn't work out in your favour.
They have leverage to gain and lose. A leveraged carry trade at 10:1, hypothetically 40% annually just from yield, would be completely wiped out by losses if the currency moved against you by just 10%. Newer traders are often seduced by the calculations involved with leveraged yield and fail to think about the downside risk.
Both political and economic risks can thwart yield strategies just as swiftly. This is a significant reason as to why countries that promote high yields tend to be doing so for a big reason, such as inflation, political instability or an economic headache. Argentina may offer you a 50 % yield, but as soon as you see a currency devaluation, you’ll see the yield disappear into the ether.
The lesson? Look at yield as just one part of a broader trading strategy, rather than relying on it to give you profit. Also, always consider currency risk as a factor, use the appropriate position sizing, and ensure you have an exit plan to consider when the market conditions change.
Practical tools and data sources to consider for yield
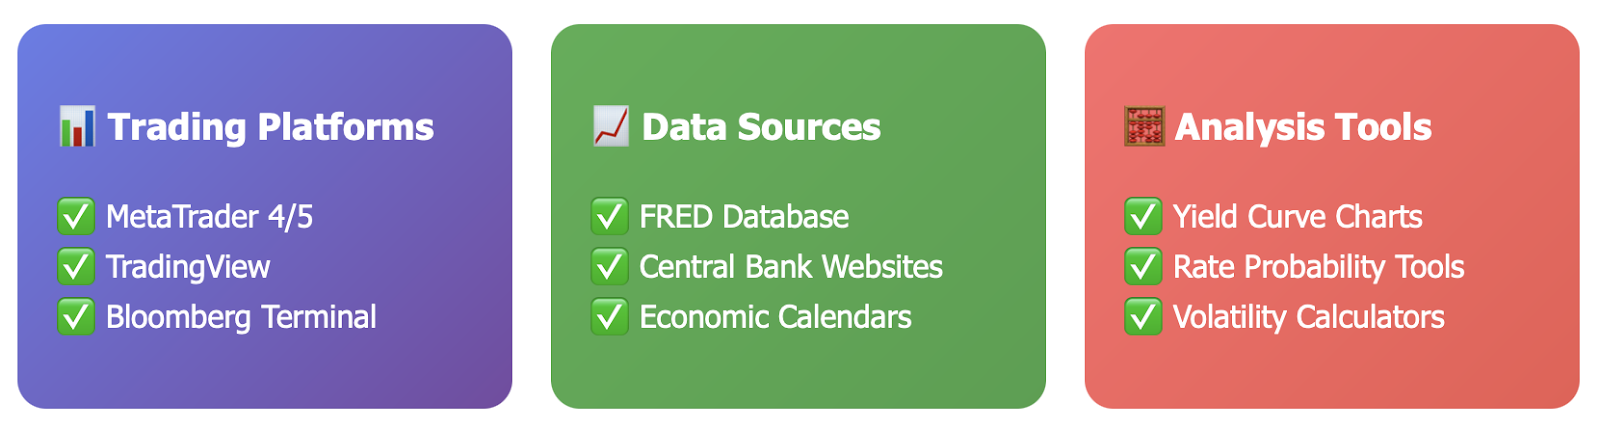
There are the right tools to have for yield, and they can make the process way easier and help you be a little more accurate in your evaluation. You can necessarily think of them as your trading dashboard; this is your trading knowledge repo, which gives you all the relevant information in one efficient place to help you make decisions rapidly.
Both Meta Trader 4 and Meta Trader 5 will have access to swap rate information built into the platform for each currency pair. Check out the “Contract Specifications” section for the overnight financing rates. More specifically, these platforms will automatically figure out or apply the rollover charge or credit to your account, effectively making the carry trade easy to execute and easy to track.
TradingView provides great charts and comparison tools for yield curves. You can overlay government bond yields for various countries, spot interest rate differentials, and see how these have changed in history. Their integrated economic calendar will even show approaching central bank meetings and potential rate decisions that might impact their yield levels.
For fundamental data, you will want to bookmark these key sources:
-
Federal Reserve Economic Data (FRED), where you can find a lot of interest rate data and overall economic data for the US
-
European Central Bank Statistical Data Warehouse for eurozone rates and economic indicators
-
Bank of Japan statistics for yen-related rate information
In addition, central bank websites will publish their official rate decisions, along with meeting minutes, and possible forward guidance. The Fed also publishes its 'dot plot' projections of future rate expectations, and the ECB and BOJ also have similar projections. These provide value in signals on how the market should think about future rates and where yield opportunities exist.
If you have access to a Bloomberg Terminal, they have the most complete data set that you can access, and they also have a host of related analytical tools. The YCGT function allows you to see yield curves from around the globe, while the WIRP function will provide expectations of interest rate probabilities for upcoming central bank meetings.
For quick reference, consider using a simplistic spreadsheet to keep track of the current rates for major currencies:
-
USD = Fed Funds Rate + 10Y Treasury Yield;
-
EUR = ECB Deposit Rate + 10Y German Bund Yield;
-
JPY = BOJ Policy Rate + 10Y JGB Yield;
-
and GBP = BOE Bank Rate + 10Y Gilt Yield.
Be advised that different brokers might show slightly unique swap rates based on their own costs of funds and profit margins. You should consider comparing rates on separate platforms if thinking about establishing a significant carry trade.
Real-time data, combined with historical tools and forward-looking indicators, gives you all of the information you need for yield-driven trading.
Yield Calculation Exercises
Now let's put theory into practice with real-world calculations. These exercises will provide practice as well as confidence in the analysis of opportunities to carry trade in the marketplace.
Exercise 1: Basic Rate of Interest differential
-
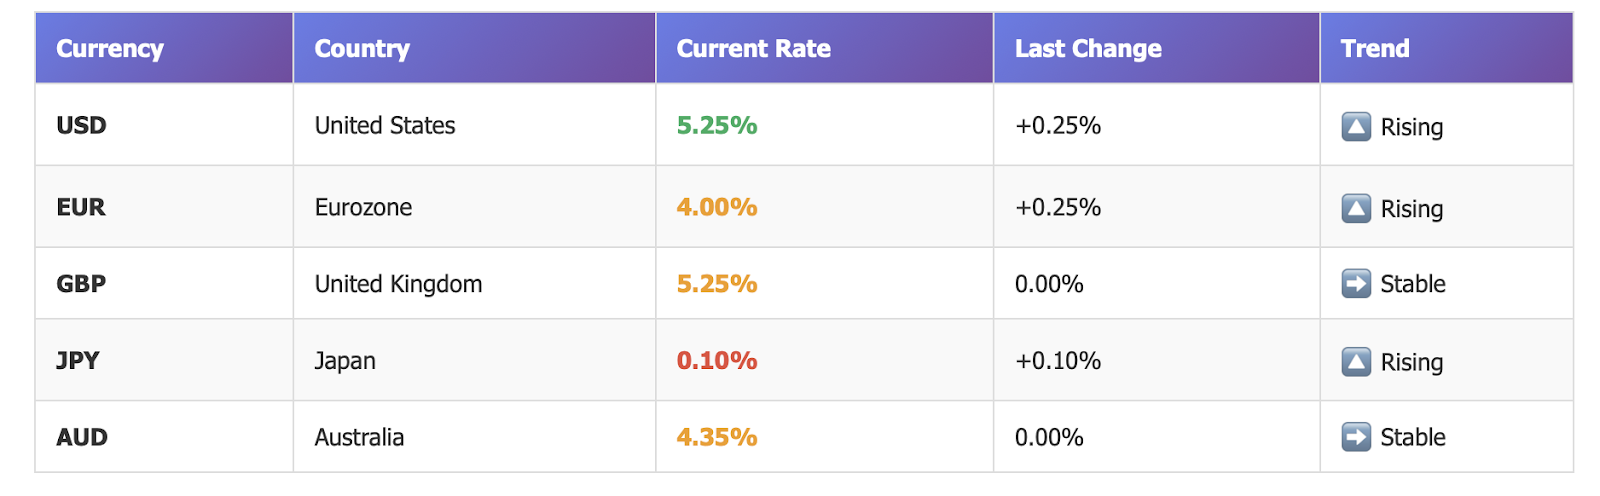
Today's rates: USD = 5.25%, JPY = 0.10%
-
Example: Given a USD/JPY carry trade with a carry trade amount of $10,000.
-
Interest Rate Differential: = 5.25% - .10% = 5.15%
-
Annual yield: = $10,000 x 5.15% = $515
But keep in mind, this is all theoretical maximums, assuming there is no currency movement and perfect execution.
Exercise 2: Transaction Costs Scenario
Same as Exercise 1, but your brokerage charges 0.25% per year in financing costs. Effective yield = 5.15% - 0.25% = 4.90% Ans. = $10,000 × 4.90% = $490
Exercise 3: Daily Rollover USD/JPY daily rollover = +1.5 pips per day (in your favour)
Position size = 100k units (1 standard lot) Current price = 150.00
Daily rollover = 1.5 pips × 100,000 units ÷ 150 = $10 per day Annual projection = $10 x 365 = $3,650
Exercise 4: Risk-Adjusted Analysis: Potential EUR/TRY carry trade.
-
EUR rate = 4.00% (annual)
-
TRY rate = 45.00% (annual)
-
Historical vol. = 25% (annual)
Interest differential = 45.00% - 4.00% = 41.00%
Risk-Adjusted Return where 41.00% ÷ 25% = 1.64
Any level over 1.0 indicates that the yield adequately compensates the trader for the risk of volatility; however, you have to remember that historical volatility is not an indicator of future price movements.
Practice Challenge: Determine the break-even point for a GBP/JPY carry trade:
-
GBP interest rate: 5.25%
-
JPY interest rate: 0.10%
-
Current GBP/JPY price: 185.50
-
Your volatility analysis suggests 15% annualised movement in either direction.
-
Interest differential = 5.25% - 0.10% = 5.15%
Essentially, the currency pair would need to travel less than 5.15% against the position each year for the trade to be profitable from yield alone.
The calculations above help determine if yield opportunities are worth the risk of trading that currency. Continue your practice with different currency pairs or various scenarios to build your analysis skills.
Conclusion and Key Takeaways
Once an individual understands how to incorporate yield into the forex market, an entire world of trading opportunities opens up that many beginners will never discover for themselves. Beyond simply generating interest on invested capital, this is a powerful way of utilising the fundamentals that drive the value of money, in conjunction with the economics of interest rates, to find ways to profit from the differential.
You have the concept behind what we've discussed so far as a complete framework of yield analysis:
Yield has both an opportunity and a risk factor. In general, the higher the yield, the greater the chance that the country is undergoing economic challenges, while lower yields are often what more stable and developed countries will pay. Your role as a trader is to identify the right size of opportunity and the greatest level of risk management.
Policies of central banks determine yield opportunities. By becoming proficient in interpreting policy signals, the economic data and forward guidance, you can position yourself ahead of yield shifts, for the powerful opportunities will come during times of policy shifts.
You will want to be careful about the accuracy of your calculations. A small change in interest rates, transaction costs, and the timing of rollovers will have a huge impact on your return. Always consider all costs and use practical assumptions in your calculations.
It’s critical to be disciplined in risk management. Currency fluctuation can easily undo the advantages of yield. Use an appropriate position size, have a stop loss in place, and never risk more than you can afford to lose on a single carry trade.
Tools and data are the distinguishing factors; even professional traders have an advantage because of better information and analytical tools. Invest the time to learn platforms like TradingView and stay engaged with communications from central bankers.
Your training plan is to start with the calculation basics, historical yield cycles, demo accounts to practice, and real positions to build confidence. Start with major currency pairs where there is abundant data and tight spreads.
Keep in mind that forex yield is just one of many strategies. The most successful traders complement yield analysis with technical analysis, fundamental research, and good risk management. Consider yield as a valuable tool in your trading toolbelt, not a guaranteed profit strategy.
The secret to long-term success is always being a student of the markets, trading with discipline, and adapting to market conditions. As central bank policies shift and new opportunities arise, your skill set in yield analysis will keep you ahead of the game.
Are you ready to dive into forex yield? Start by tracking interest rate differentials for major currencies and even paper trade some carry trade scenarios with tradewill.com. When you feel you have the calculation and risk down, consider starting with small amounts in real positions.
Remember, every professional trader started with the same basics you learned here.
Disclaimer: The content of the blog does not represent any position of Trade W, does not serve as any trading-related decision advice, and does not endorse any third-party.