

 Trade W
Introduction
The U.S. presidential election is a major event every four years that has an impact, both positive and negative, on the world's economies. Investors are always following these elections closely to see whether the economy and their investments will do well or poorly depending on who wins the election.
The question that many ask themselves is whether the stock market behaves in predictable ways during the election year or is simply noise. This article analyses nearly 100 years of stock market data to provide insights into what happens to banking and investing in the U.S. when Americans are voting at the polls.
If you are a new trader or you are building your own portfolio, learning from historical patterns can help to create advantages as a trader/developer of your portfolio. You will learn actual numbers and how common myths can be disproved through the research provided in this article. You will also see how previous elections have affected the markets in ways you may not have thought about.
Example 2020 is an example of how a pandemic and an unstable political situation can negatively affect the economy and ultimately the stock market. In 2020, the S&P 500 increased by 16% for the year due to the pandemic and the political turmoil it caused in the U.S. Although there are identifiable patterns, it is important to note that the patterns serve as historical references only, and markets will not mimic the exact outcome in the next election year.
Overview of the Stock Market During Election Years
One of the most recognisable aspects of financial markets is the volatility associated with an upcoming presidential election. Every four years, election time is like taking a final exam. Voters experience anxiety and nervousness about how their actions (i.e., whom they vote for) may affect the financial market. Therefore, voters will base their choices on what they perceive to be best for the future direction of the U.S. economy over the next four-year term.
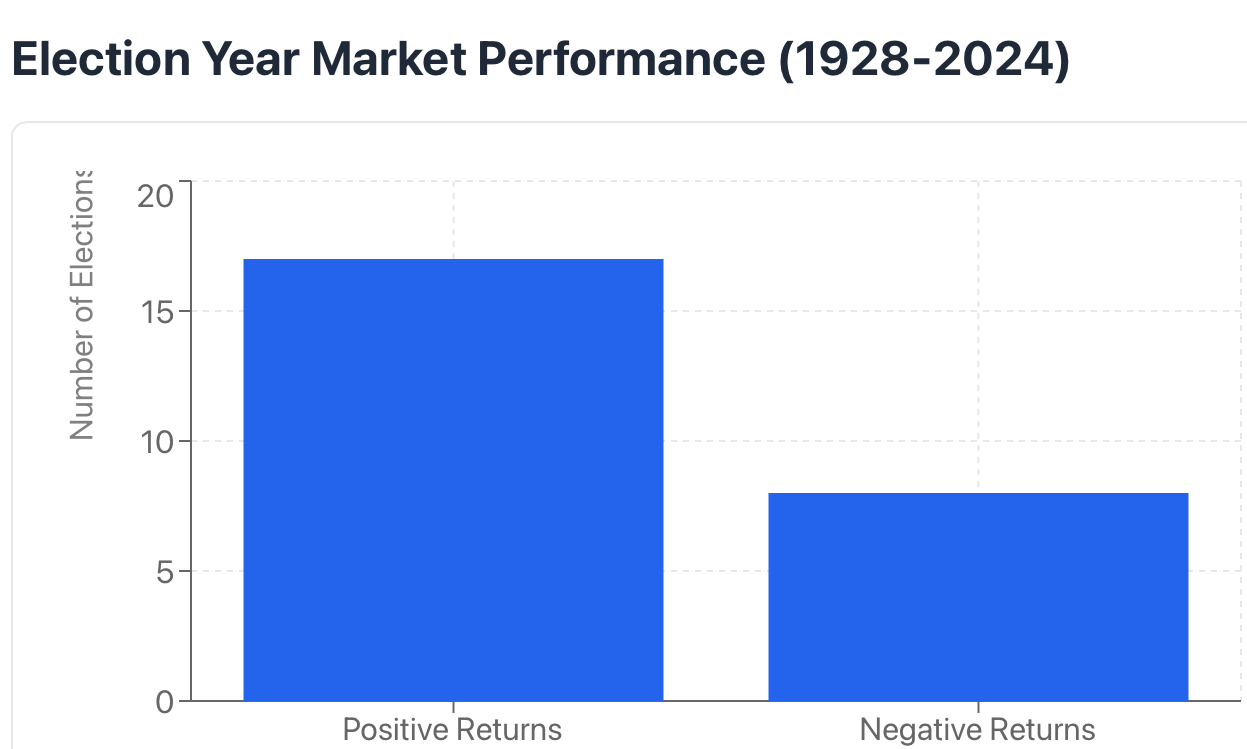
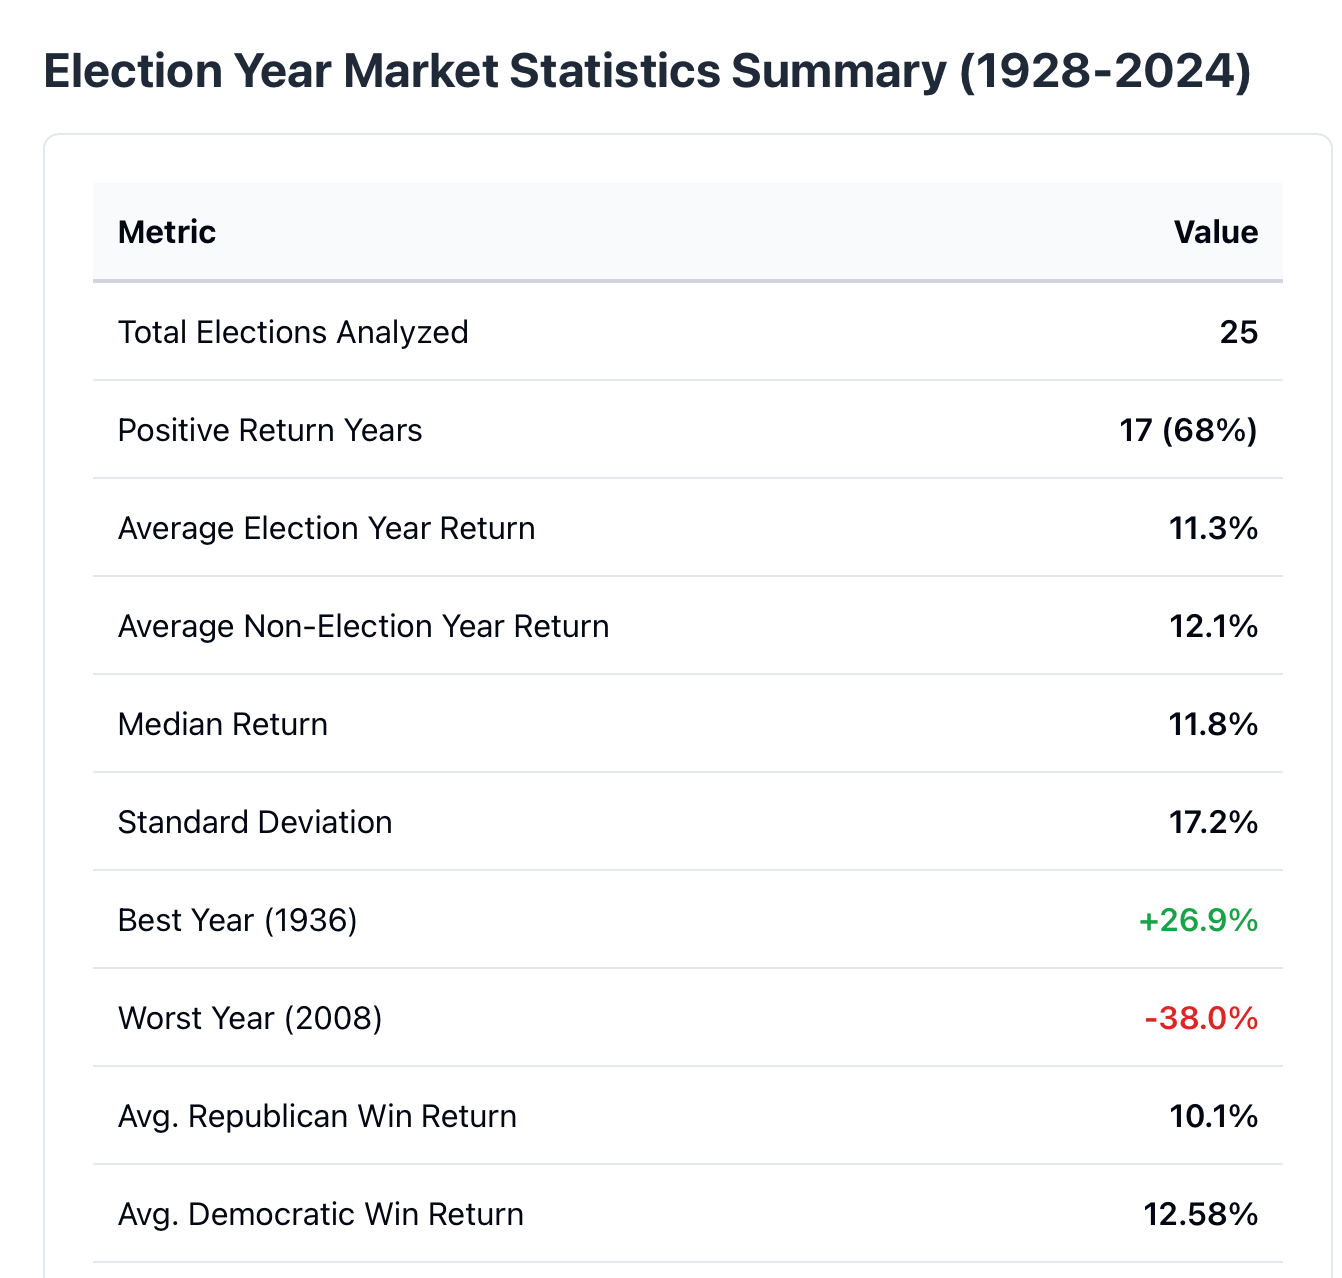
From 1928 to 2024, there were 25 separate elections for U.S. president. In these elections, the S&P 500 had a positive return for 17 of those elections (i.e., 68%). The election cycle performance of the S&P 500 was better than that of the Dow. The average return of the stock market (the S&P 500, the Dow) since the inception of the NASDAQ (1971) is greater than 11%.
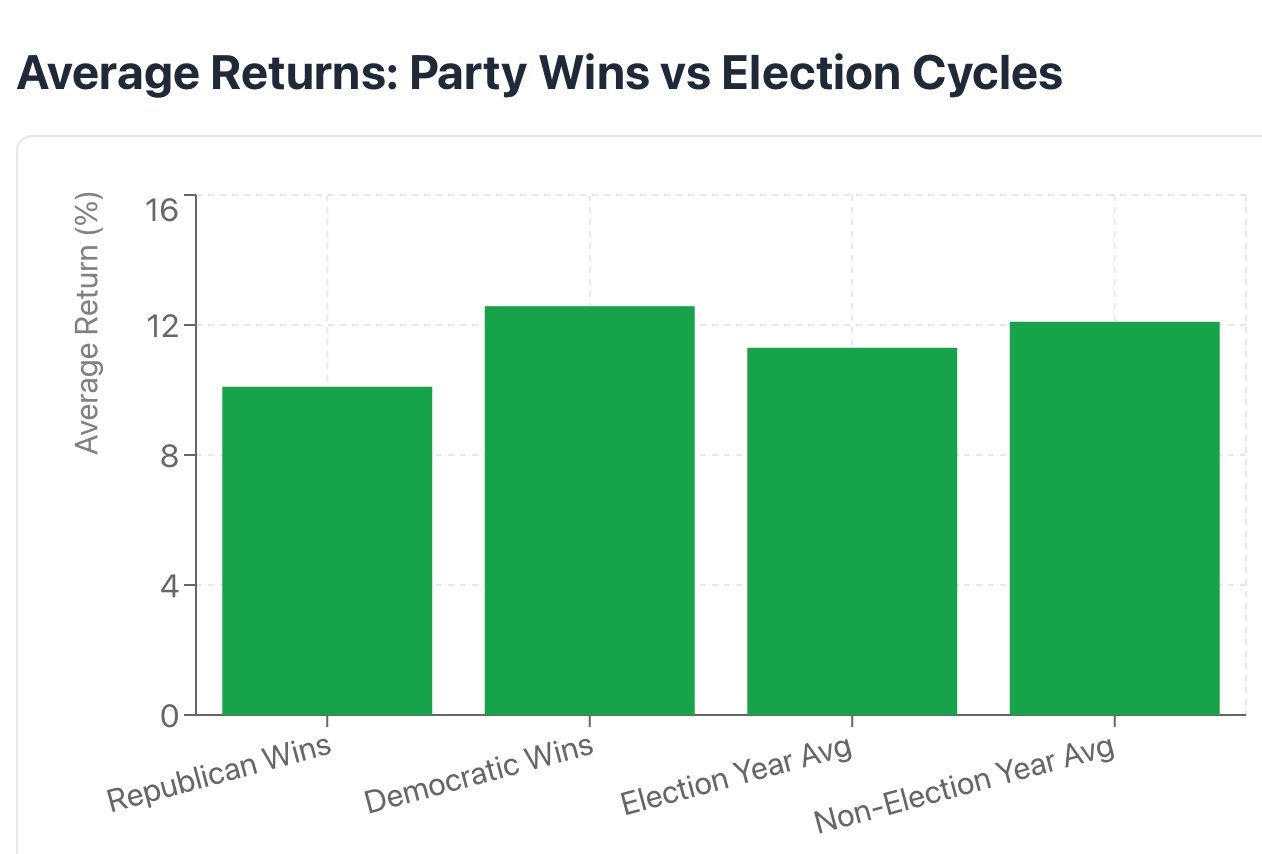
Overall, during an election year, there is approximately an 11.3% total return based on the average of all returns; however, in non-election years, the average total return of 12.1%. While this statistic could be interpreted differently, it is important to recognise that there is generally a higher level of volatility during an election year due to the larger number of greater intraday moves and sector rotations than there are in a non-election year.
An example of increased volatility due to elections is Franklin D. Roosevelt's presidential win in 1932 during the Great Depression. Despite a 15% drop in the stock market, it is important to note that the stock market had already been declining because of the deteriorating economic conditions before the election. Contrarily, the stock market experienced a boom following the election of Bill Clinton in 1996, when the S&P increased by 20%. Both examples illustrate that a presidential election can change voter expectations but are not necessarily bullish or bearish for our economy; they present a great deal of uncertainty to investors' perceptions.
The Stock Market's Behaviour during Presidential Elections
One of the most recognisable aspects of financial markets is the volatility associated with an upcoming presidential election. Every four years, election time is like taking a final exam. Voters experience anxiety and nervousness about how their actions (i.e., whom they vote for) may affect the financial market. Therefore, voters will base their choices on what they perceive to be best for the future direction of the U.S. economy over the next four-year term.
From 1928 to 2024, there were 25 separate elections for U.S. president. In these elections, the S&P 500 had a positive return for 17 of those elections (i.e., 68%). The election cycle performance of the S&P 500 was better than that of the Dow. The average return of the stock market since the inception of the NASDAQ (1971) is greater than 11%.
Overall, during an election year, there is approximately an 11.3% total return based on the average of all returns; however, in non-election years, the average total return of 12.1%. While this statistic could be interpreted differently, it is important to recognise that there is generally a higher level of volatility during an election year due to the larger number of greater intraday moves and sector rotations than there is in a non-election year.
An example of increased volatility due to elections is Franklin D. Roosevelt's presidential win in 1932 during the Great Depression. Despite a 15% drop in the stock market, it is important to note that the stock market had already been declining because of the deteriorating economic conditions before the election. Contrarily, the stock market experienced a boom following the election of Bill Clinton in 1996, when the S&P increased by 20%. Both examples illustrate that a presidential election can change voter expectations but are not necessarily bullish or bearish for our economy; they present a great deal of uncertainty to investors' perceptions.
Red vs Blue: Party Wins and Sector Performance
The subject is now more complex. Democrats and Republicans have different views of the economy; therefore, the markets react differently to those views. When the Republican candidate is elected president, the stock market tends to favour certain sectors; when the Democratic candidate is elected president, the stock market tends to favour a different set of sectors.
To use a sports analogy, think of how different sports teams have different game plans. The Republican game plan has historically involved decreased regulations, decreased corporate taxes and increased energy independence. This is great for stocks related to banks, traditional energy companies and industrial growth companies. For example, after Donald Trump won the 2016 election, financial-related stocks saw a 20% increase in value in the 12 months following his election because investors were speculating that he would roll back banking regulations and provide tax cuts.
In contrast, Democrats tend to push for more federal government spending on infrastructure, the development of renewable energies and healthcare reform. As a result, technology stocks have done well on average during Democratic administrations because Democrats focus on improving education and supporting innovation. After Joe Biden's 2020 win, energy-related exchange-traded funds increased significantly as investors believed he would implement new policies to support clean energy.
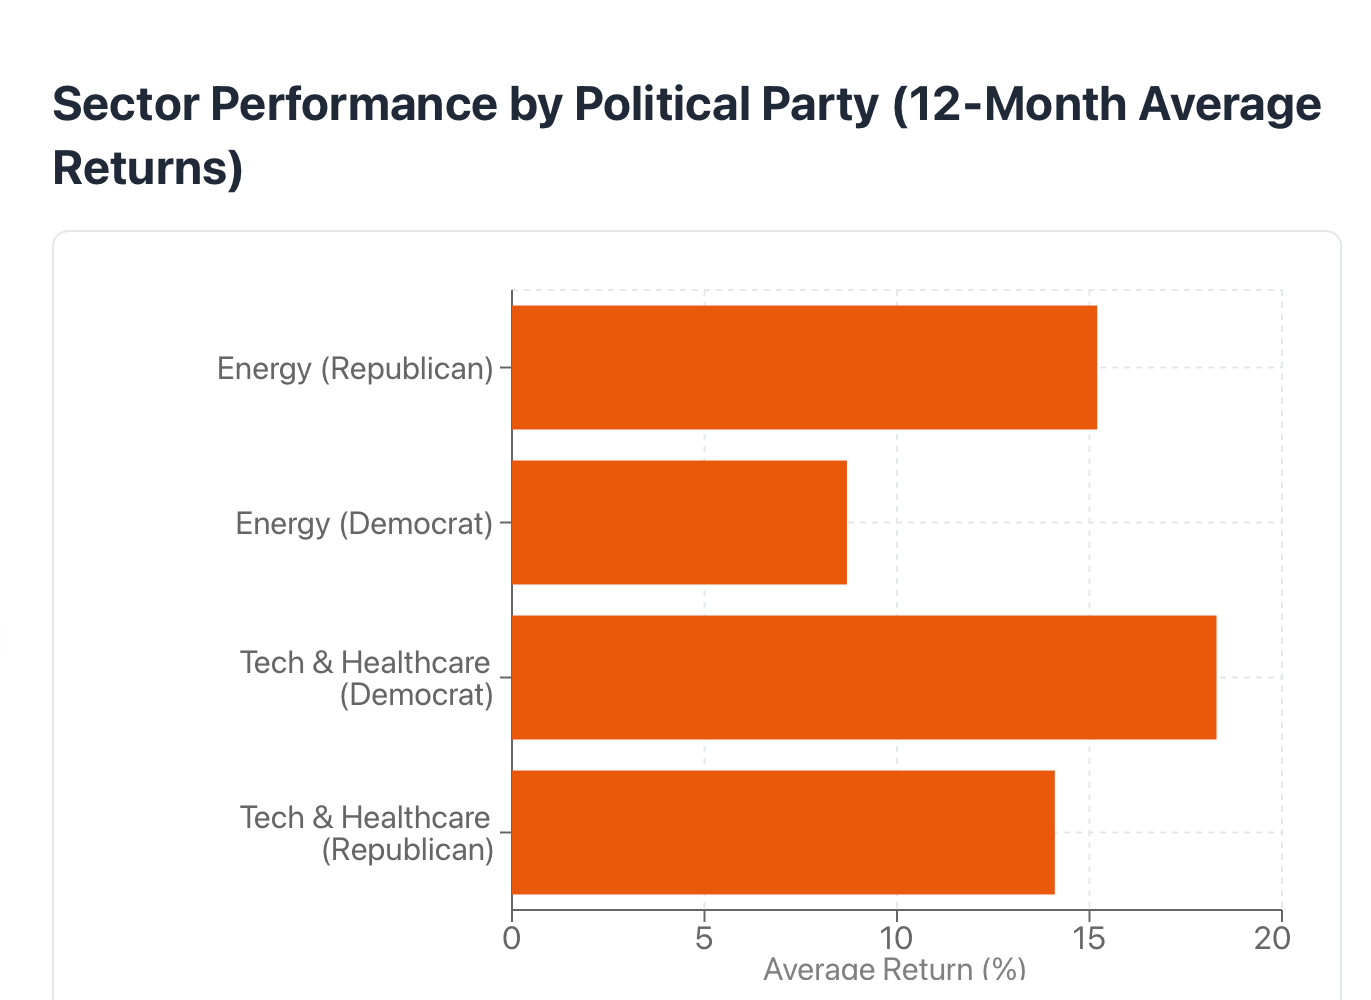
The 1928 – 2024 historical returns on energy-related stocks demonstrate that they averaged annual 15.2% returns in the 12 months following a Republican presidential election win compared to 8.7% after a Democrat presidential election win; on the other hand, the technology and healthcare sectors outperformed in the 12 months following a Democrat presidential election win, averaging annual 18.3% versus 14.1%, respectively.
While election outcomes do tend to have an influence on which sectors perform the best, it is essential to recognise that the economic cycle has a more significant impact than the political party that wins the election. For example, during the financial crisis of 2008, even though a Democrat was being elected president, the entire stock market suffered losses due to the systemic problems in the housing and financial markets. Even though the policy that is implemented by a new president does influence the performance of some sectors, it cannot overcome the underlying economic factors impacting all sectors.
In summary, a sector rotation based on election results is real; however, it is best to combine that with an overall understanding of the overall economic environment. You may think that an energy-related stock is going to do well because a Republican has been elected President, but if the oil price index has been declining globally, your energy-related investment will probably not fare as well as you would like it to, based on a Republican being elected.
Historical Data Deep Dive (1928-2024)
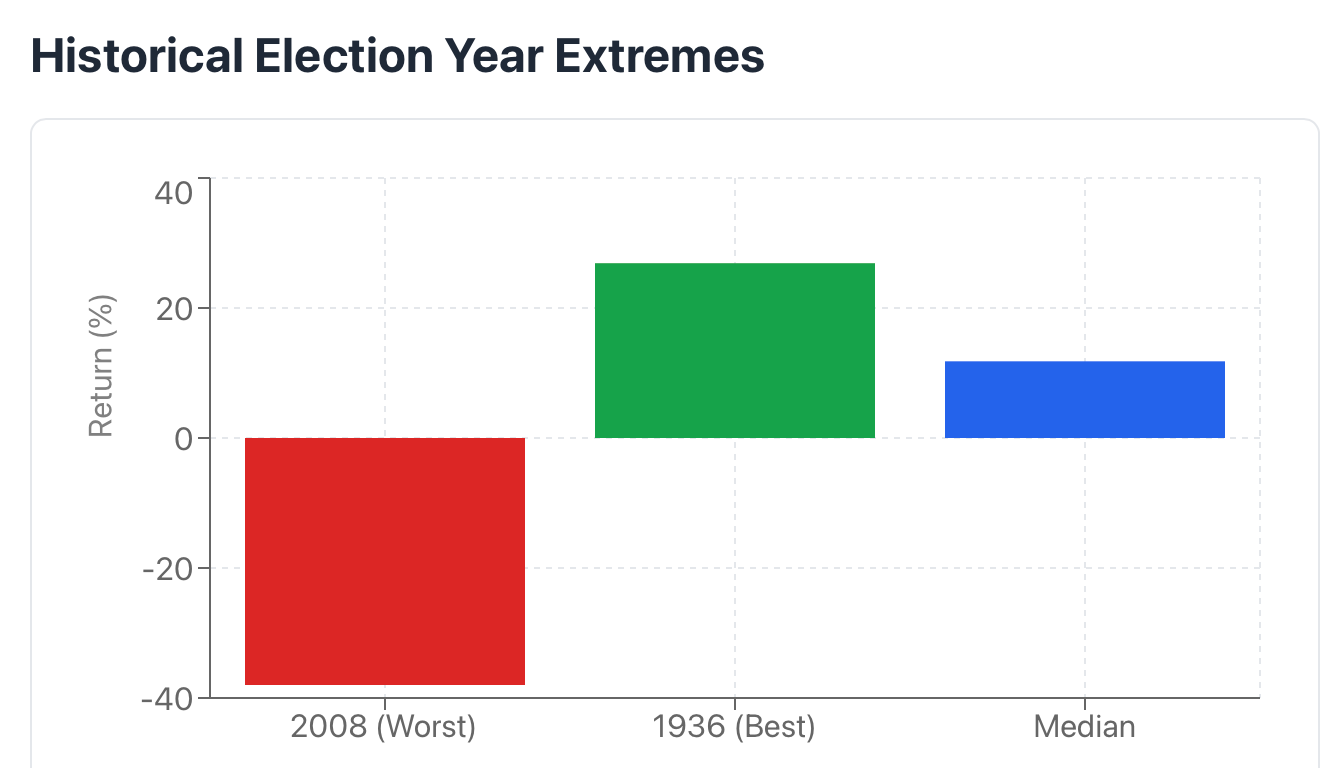
As we delve into the numbers, the financial performance for investors during 96 years of election years has ranged from an extreme low of -38% gain in 2008 to a very high +26.9% gain in 1936.
The $500 index has had a median return of +11.8% and a standard deviation of +17.2%, which indicates that election-year gains do vary significantly in volatility.
In terms of how political parties affect the S&P 500 Index during election years, when Republicans won, their average gain was +10.1%, while the average gain after a Democratic win was +12.58%. However, before jumping to the conclusion that the Democratic win is better for your investment, it is essential to note that many Republican victories occurred during economic downturns (i.e., stagflation in 1980 and tech bubble burst in 2000) while many of the Democratic wins occurred during an economic recovery.
The worst election year was the 2008 election year. During that year, the S&P 500 fell 38% due to the financial crisis, and even Obama's win did not stop the losses. The best election year was in 1936 when Franklin D. Roosevelt won, and the economy was recovering from a severe depression; the index gained nearly 27%.
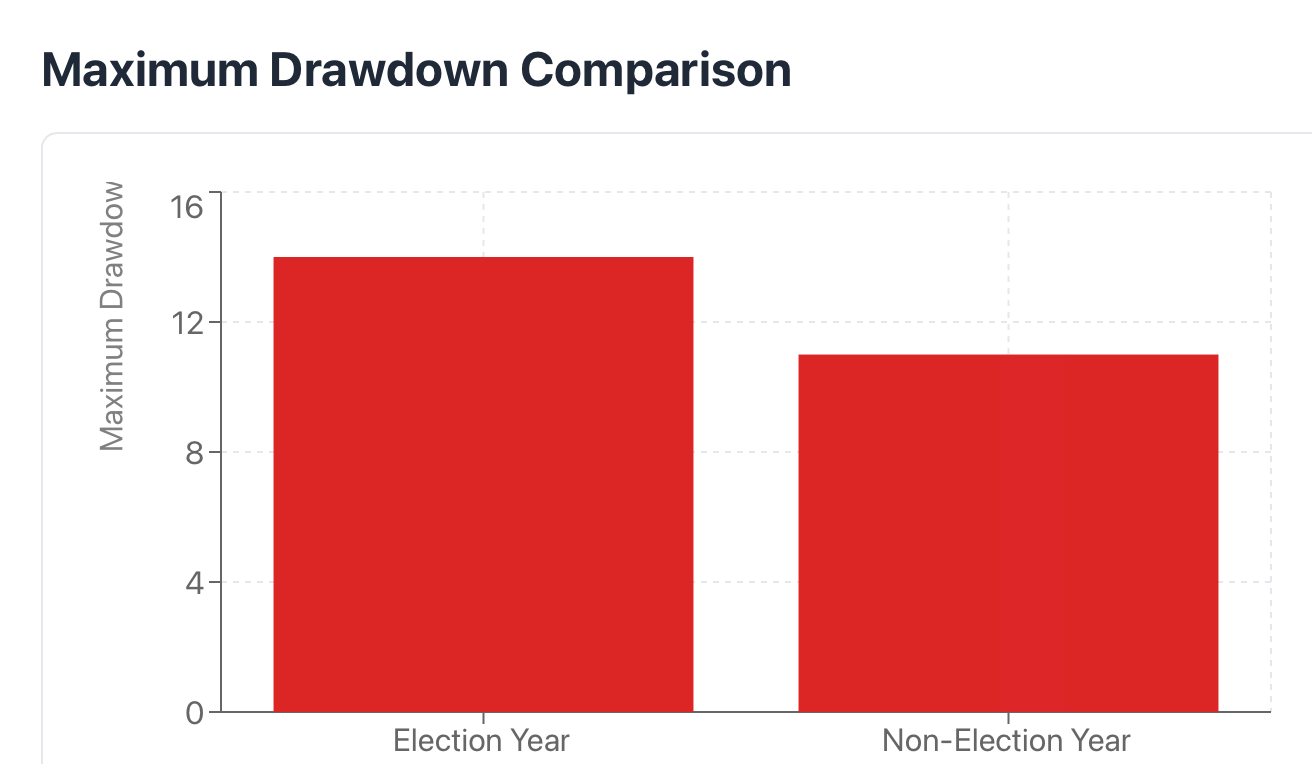
The maximum drawdown for S&P 500 Index during election years has averaged about 14%, compared to a 11% maximum drawdown in a non-election year; however the 3% difference is noteworthy especially to the active trader who must manage the unpredictability of an election year, such as how new policies may impact the market, how potential regulatory changes may influence market liquidity, and how the economic priorities of the party that won the election impact the market's volatility.
For example, of this dynamic: In 1980, Reagan won the election, and it was a flat year for the market ahead, gaining only +2.6% during a year when the inflation rate was up to 13% and interest rates were high. However, investors who positioned their accounts in anticipation of Reagan's pro-business tax-cutting policies were rewarded significantly in the years after he won the election.
While there are observable, quantifiable statistics on how a political party will impact the stock market in election years, it is important to realise that context has a major impact on how those statistics are viewed. A 15% gain in a booming economy has different significance than a 15% gain experienced during a recovery from recession.
Myths About Election Year Markets
Myth 1: The stock market always crashes during election years.
This is not true. It is a misconception that the stock market crashes in election years. In fact, since 1928, the stock market has been up in almost 70% of the time during an election year. While election years can exhibit significant variation, they also have periods of extreme and less extreme fluctuations. For example, in the election year of 2012, the S&P 500 was up 13%, and in 2016, when Trump won the election, the market was up by 9.5%.
Myth 2: Election uncertainty causes year-long crashes.
Election-related market volatility occurs before news or events have happened; however, election results do not determine financial markets – only the economic fundamentals behind the elections do. The Great Recession of 2008 wasn't caused by any specific election but rather by mortgage securities that became overleveraged, leading to huge losses in both bankruptcy and foreclosure.
Myth 3: The winning party directly determines market direction.
If this were correct, investing would be a cakewalk. All you would have to do is place bets on the anticipated winner in various sectors and reap profits. The truth is far more convoluted. The Federal Reserve's interest rate policy, the state of the global economy, corporate money profits, and disruptive technology play a more dominant role in stock values than any person occupying the Oval Office does. Although Biden won the presidency in 2020, it was the enormous monetary stimulus and optimism surrounding the vaccine that caused the increase in the stock market, not his economic agenda.
In assessing how the market behaves during a presidential election, election cycles behave like most cycles. The average return during an election year is between five and 15 per cent, which falls into the norm for all markets. The extreme highs and lows associated with election years are more a function of broader economic conditions than they are directly related to the candidates themselves.
Elections are similar to weather forecasts; both give you an idea of what possibilities are ahead, yet neither has any impact on the actual weather. The temperature of the market is determined by earnings, interest rates, and overall economic growth.
Pre-, During-, and Post-Election Patterns
The performance of the Stock Market typically is different before an election compared to after the election. That difference helps the investor ascertain their timing.
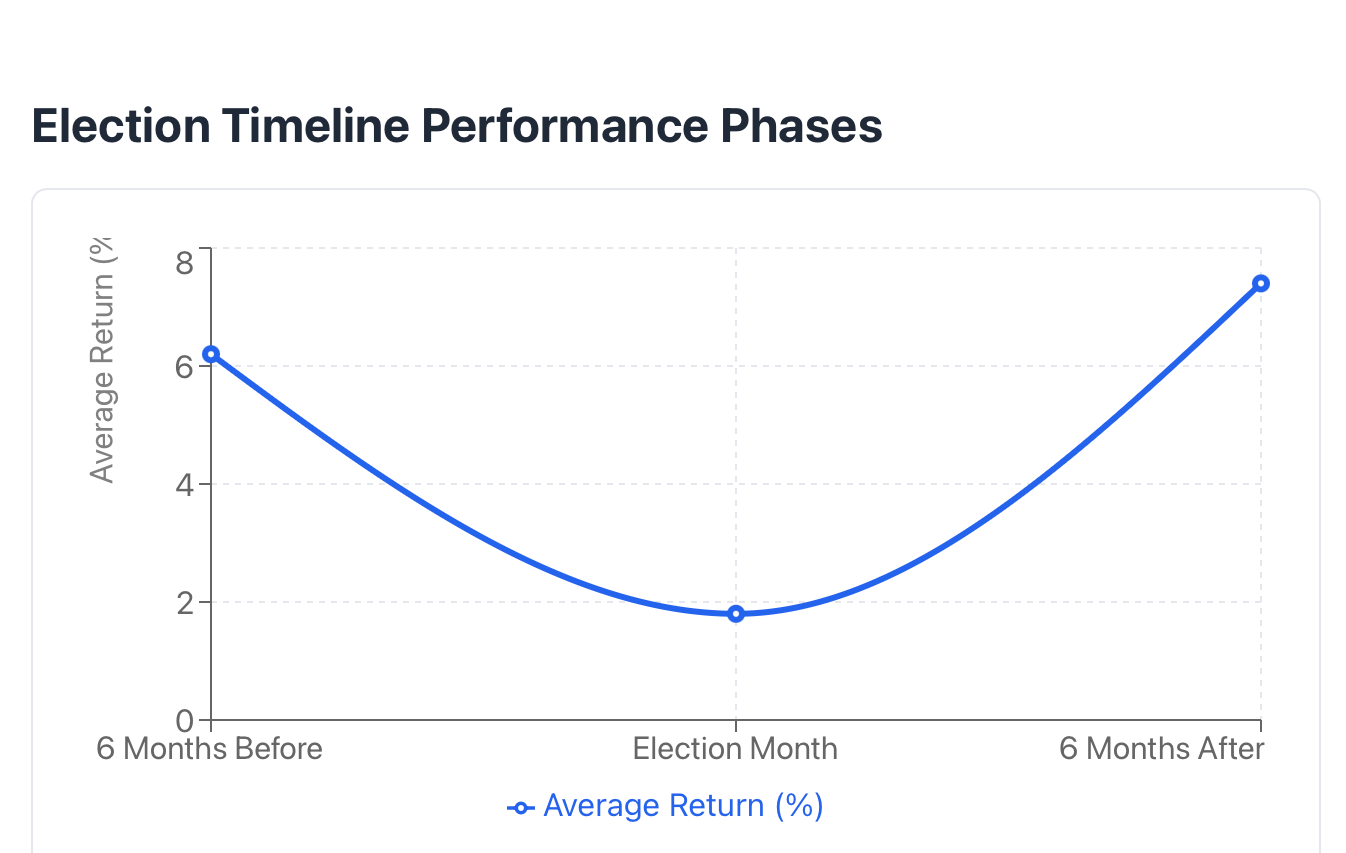
Six Months Before the Election: This phase is characterised by increased volatility, as well as an upward trend. The current administration wants the economy to be performing well, and typically, there is some kind of stimulus spending or expansionary monetary policy. When you look back historically (1928 – 2024), the 6 months leading up to an election produce an average return of 6.2%, which is considered a very good return.
Election Month: This is typically the most volatile period of time leading up to the election. There are many more daily fluctuations, greater than normal fluctuations in stock prices, as investors react to polling data and position their portfolios depending on the outcome of the election. So, during this period, October and early November are when most investors take profits, and/or start to position their portfolios defensively. The average return in November for years of election is 1.8%, which is significantly lower than the normal average return of November.
Six Months After the Election: As soon as an outcome has been determined, the uncertainty that was present during the prior months has decreased, and markets begin to settle down. As soon as it is known whether the winner of the election is proposing to implement market-friendly policies, stocks that would benefit from the newly elected president will have a dramatic upward move in value, while stocks in sectors that will experience adverse events from the newly elected president will have a dramatic price decline. After each election, during the 6-month period after the election, an average return of 7.4% will occur.
In 2012, Obama ran for re-election. It was widely believed at the time that he would win. On the day of Obama's re-election, the stock market was expected to go up at least 8% in the six months following the election.
In 2000, George Bush and Al Gore went through a very lengthy recount in which there was a lot of uncertainty surrounding the outcome. As a result of this uncertainty, there was little buying or selling of stock for months until the Supreme Court made a final ruling on the election.
Sector rotation has been evident in both instances. Stock market sectors that performed well before the election included defensive stocks such as utilities and consumer staples. Once the election has taken place, cyclical stocks have tended to outperform the other sectors as investors anticipate changes in economic policy.
The sector rotation can help you develop a short-term investment strategy, but do not sell your house to finance your investment strategy based on political elections. There will always be opportunities available due to the political election cycle; however, no one can predict the future based on past experiences.
Investment Insights and Strategies
What kind of investments should you make in an election year? Here's how you'd invest.
In an election year, it is advisable to diversify more than usual. Election policies are likely to bring about more uncertainty in all profit categories, so it is best to reduce the risk associated with those stock categories by investing in each.
Invest in both potential "winners" and adequate, defensive companies. Although some analysts believe that a Republican will win the presidency, don't invest all of your money in financial companies just because a Republican candidate is expected to win.
CFD Traders: Election volatility will allow CFD traders to realise short-term profits. Keep an eye on the news related to individual sectors. If you see interest in a candidate who intends to produce an increase in energy jobs, take some positions in energy CFDs for immediate returns. Be prepared to exit your positions quickly, though. Markets during election years will often reverse direction.
Long-term Investors: Dollar-cost averaging works well during election years. Since there is increasing volatility in the Marketplace, you may be able to buy shares at lower prices when the market dips. Historically, ETFs and index funds that track the S&P 500 or the total market have recovered well after experiencing the volatility associated with an election year. This was the case during the 2020 election year, where ETF returns averaged 16.8%.
In addition to tracking macro-economic indicators, it is also important to follow the political landscape of the country over the course of the presidential election. Many times, you will have candidates who are leading in the polls and doing well with the economy. For example, just because a Democrat wins the presidential election in an economy that is growing, it does not mean that the same candidate will have successful leadership if they were to win in an economy that is in recession.
Risk Management: Use tighter stop-losses during election months. If you are heavily invested in sectors that are more likely than not to suffer risks associated with political changes, utilise options to hedge your positions. Historical patterns of the market will provide examples of what the market has done and what the market will do in the future.
Many investors anticipated that the election of Donald Trump would cause the financial markets to crash, and the opposite occurred in 2016: The S&P 500 returned an impressive 9.5% in 2016 and 19.4%. In 2020, when many investors thought the election of Joe Biden would result in a similar outcome, the market increased by an astounding 16.0% 2020 and 26.9%.
Conclusion
We have observed through almost a century of historical evidence that election years provide unique market opportunities but do not correlate with negative or positive returns for stocks. Although elections have produced better annual returns for the S&P 500 index in absolute terms, those returns also exhibited more significant volatility associated with an election's occurrence.
Sector rotation amongst industry sectors based upon the results of elections can occur; however, it is also necessary to perform sound fundamental economic analysis independent from election results. Furthermore, there are notable differences between the pre-election phase, the voting phase, and the post-election phase of an election cycle, which savvy investors can use to their advantage.
Many of the misconceptions regarding stock prices in election years are unfounded. After an election, the stock market will not experience a massive decline simply because of a Presidential election; likewise, there is no assurance that the political party that wins the Presidency or a Congressional seat will lead to a particular direction in the price of stocks.
The fundamental aspects of the economy, the fundamentals of a corporation's business activities, and the direction of monetary policy from the Federal Reserve will have a more significant effect on stock prices than the outcome of an election.
Just as historical data indicate future trends, the patterns observed in elections should also be used to develop a sound strategy and manage risk appropriately. The 2024 Presidential Election is not likely to be any different from prior elections in terms of the opportunities and challenges it will create.
Ready to turn these insights into action? Head over to Tradewill.com to access real-time market data, advanced charting tools, and trading platforms designed for both election-year volatility and everyday opportunities. Don't just watch history unfold, position yourself to profit from it.
Disclaimer: The content of the blog does not represent any position of Trade W, does not serve as any trading-related decision advice, and does not endorse any third-party.