

 Trade W

What Is a Harmonic Pattern?
A harmonic pattern is a type of technical analysis that utilises Fibonacci ratios and geometrical price structures to identify potential reversal areas in the market. This pattern has an XABCD structure, with certain levels of Fibonacci retracement and extension used by traders to determine possible price changes. Retail and institutional traders use these patterns on the Forex, cryptocurrency, stock, and CFD markets.
The Geometry of Financial Markets: Why Harmonic Patterns Help Predict Price Reversals
Many traders get incredibly frustrated when they’re in a perfect trade and the market turns against them after they have gotten into the position. People often feel like the market has it out for them; however, most reversals are not random events. Traders who can repeatedly identify where the price is about to reverse are not doing this by random chance; instead, they are leveraging the mathematics behind market geometry.
There are no random price movements on the financial markets. Any price movement is due to three specific elements: market psychology, liquidity flows, and algorithmic trading systems that repeatedly react at the same price levels. Harmonic trading exists at the intersection of psychology, liquidity, and algorithmic trading. It is the application of Fibonacci ratios, geometrical chart patterns and technical analysis to establish high-probability reversal zones.
To truly understand harmonic patterns, think of how a rubber band is stretched. The longer you stretch a rubber band in one direction, the more likely it is to pull back toward its original position. Harmonic patterns provide traders with the mathematical groundwork necessary to pinpoint the exact location of a future pullback.
A good example of harmonic patterns forming is the Butterfly pattern that formed in Bitcoin during a bullish run, and was then rejected sharply at the butterfly price level. While the Butterfly pattern will not guarantee that a price will always reverse at the time of formation, it does provide a trader with a high probability to benefit from a price reversal occurring at that particular price level. The concept behind harmonic trading is to use mathematics and market behaviour, rather than luck, to determine future reversal locations.
The Fibonacci Ratios Behind Harmonic Pattern Trading
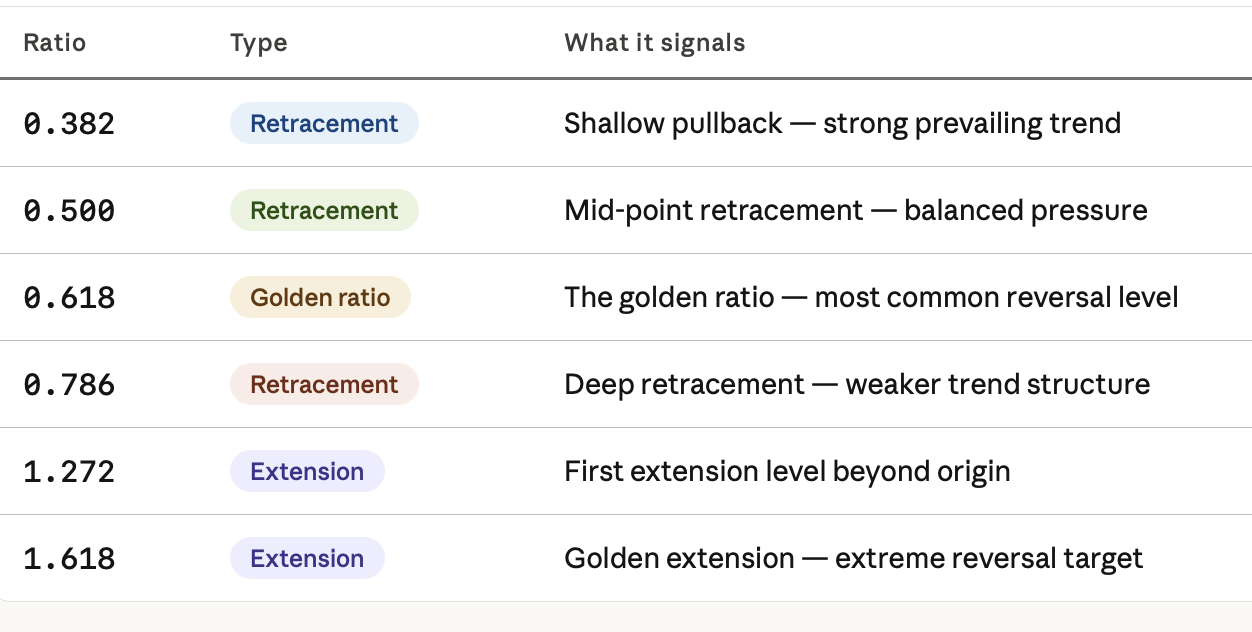
Fibonacci numbers define the basis of each harmonic pattern, starting from 0 through multiples of 1 until reaching an entire collection of ratios that relate to one another by approximately being 1.618 times greater than the corresponding Fibonacci number preceding it. These numbers are particularly produced from a range of ratios across all areas of life, including but not limited to architecture, natural structures, and even financial markets.
Here are the key Fibonacci ratios used in harmonic trading:
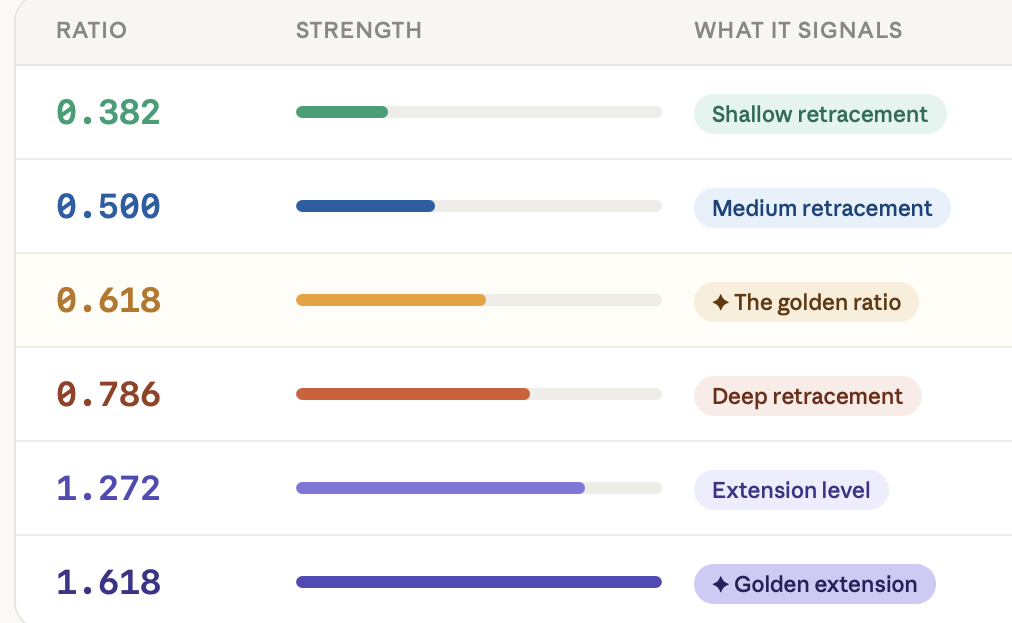
Why are these various ratios prevalent in financial markets today? There isn't a straightforward answer to this question. There are many elements that come into play, including common psychological traits shared by all investors as well as algorithmic trading systems programmed to target specific levels and a complex liquidity dynamic that creates a correlation between different orders placed at similar price points. As more market participants become aware of certain levels, the probability that they'll ultimately reach that level increases significantly.
A great example of this phenomenon is the EUR/USD pairing down to the 0.618 Fibonacci number prior to continuing its upward trend. By far, this is the most common occurrence seen in forex charts. Those traders who understand Fibonacci retracement can use this information to place their trades at these Fibonacci levels instead of trying to catch the trade in progress.
An analogy can be drawn from a ball that hammers into the ground at various heights. Each time it hits the ground, it rebounds a little less than the previous time. Fibonacci levels operate in a similar manner. Each retracement is proportionately shorter than the last leg that originally defined it.
All harmonic patterns are based on these ratios. Command the use of the Fibonacci framework, and you are already laying the groundwork.
The XABCD Harmonic Pattern Structure Explained
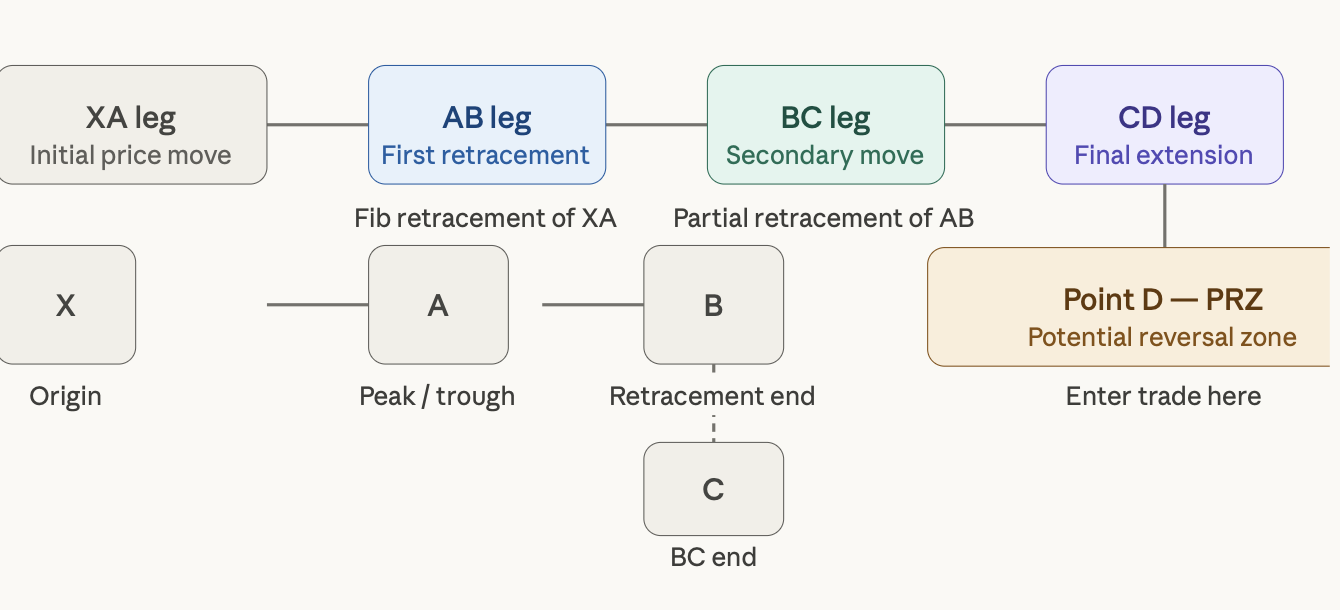
In every harmonic pattern, there’s always a five-point structure where each point is denoted by a letter - X, A, B, C, and D. The actual distance between these letters can be measured by using the Fibonacci scale.
Here's how the structure unfolds:
XA — The initial price movement. This is the first significant leg, either up or down, that kicks off the pattern.
AB — The first retracement. Price pulls back against the XA move by a specific Fibonacci ratio.
BC — The secondary move. Price reverses again, retracing part of the AB leg.
CD — The final extension. This is the longest and most important leg. It completes the pattern and ends at point D.
Point D is everything! It is the potential reversal zone (PRZ) for a trader to identify where the market will reverse. D also represents the actual trade.
Think of the way a wave acts in the ocean. Waves continue to move forward but then retract, extend forward again, retract further and finally break. The XABCD structure illustrates the same rhythm mathematically.
It is common for Ethereum to create an XABCD structure on a 4-hour chart. A trained trader recognises this pattern as it begins to evolve during the BC leg and prepares for the trade when the price gets close to point D (the predicted target). Preparation is where the trader has an edge.
10 Essential Harmonic Patterns Used in Forex, Crypto, and Stock Trading
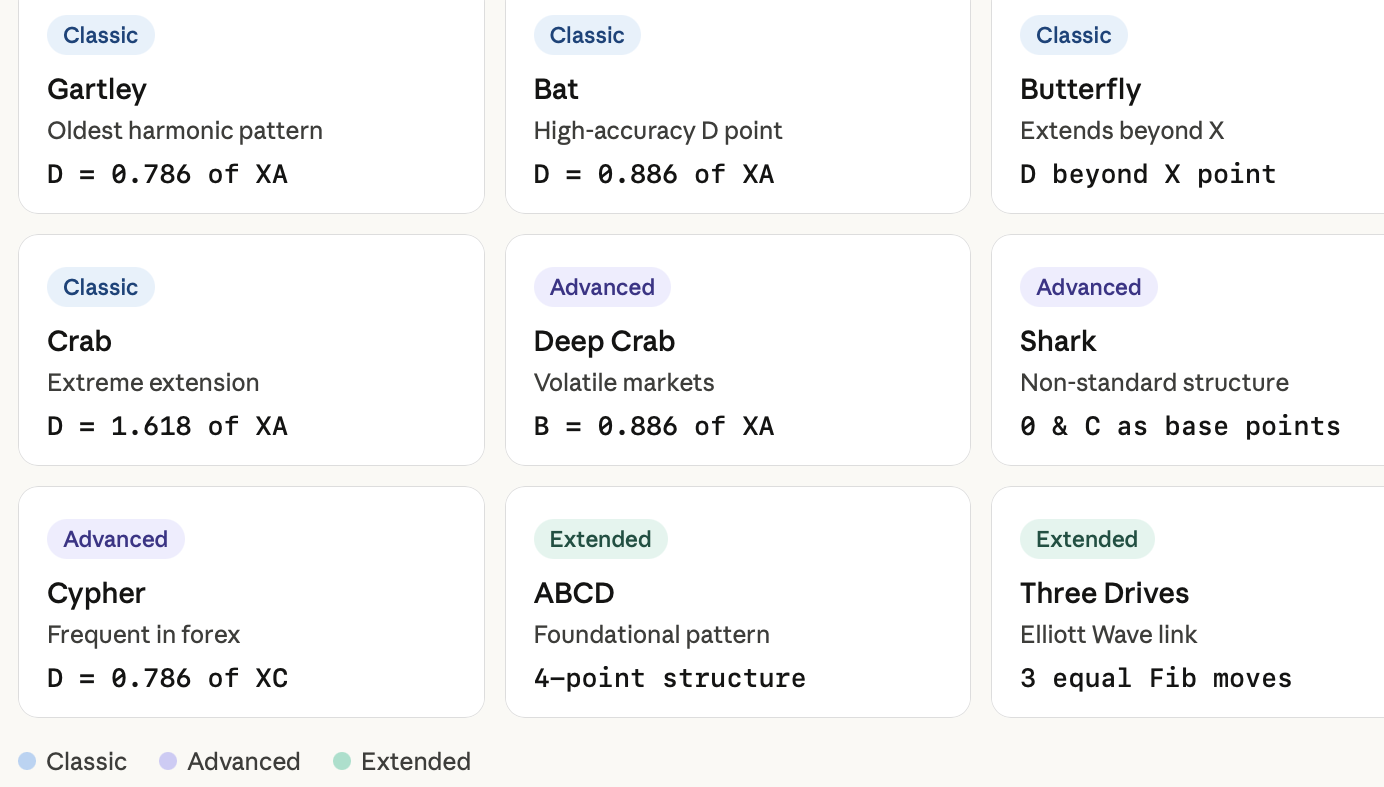
Although there are many different harmonic structures, each of the harmonic patterns has distinct features depending on the type of price movement that they correlate to, the market structure that they indicate, and the ratio attractiveness that different Fibonacci ratios represent. Below are the ten most frequently traded and most popular harmonic patterns.
Classic Patterns
1. Gartley Pattern: This is the oldest and most widely known and accepted of all harmonic patterns; created in 1935 by H.M. Gartley, it is based on 0.618 and 0.786 retracement levels, making it the basis for all other harmonic patterns to be measured against.
2. Bat Pattern: Developed by Scott Carney, the Bat has a deep retracement of B (0.382 to 0.500 of XA), and has an extremely accurate D-point (located at a precise 0.886 retracement of XA); observed frequency indicates it is one of the more accurate patterns when the ratios align exactly where they need to be.
3. Butterfly Pattern: The Butterfly pattern extends far beyond the original X point; therefore, point D is an extension instead of a retracement off of XA; thus, it is typically used to catch the exhaustion move that takes place at or near major market tops or bottoms.
4. Crab Pattern: This harmonic pattern has one of the most extreme definitions, with a D-point extension of 1.618 times X. In other words, the price moves significantly beyond the original X-point. Therefore, if a Crab pattern sets up properly, it can indicate a significant price reversal movement that is likely to happen.
Advanced Patterns
5. Deep Crab Pattern: The Deep Crab Pattern has a much deeper B-point retracement of 0.886 than the Crab Pattern and usually forms in highly volatile markets. The confirmation before entry will be a lot tighter than for the Crab Pattern.
6. Shark Pattern: The Shark Pattern is a newer pattern and deviates somewhat from the standard XABCD structure. The main structure of the Shark is based only on the 0 and C points, whereas a strong reversal is usually anticipated after the final leg.
7. Cypher Pattern: The Cypher Pattern has a 0.786 retracement on the D point to the XC leg. The Cypher Pattern is widely used by traders in the forex market because it develops more often than many older patterns do.
Extended Patterns
8. ABCD Pattern: This is the most basic form of harmonic price action, a simple design consisting of only four separate points (A-B-C-D) connected together by three legs. It's typically the first harmonic pattern a trader becomes acquainted with, as it will ultimately be the foundational support for all other harmonic setups in the marketplace.
9. Three Drives Pattern: Three equal-length drive style moves in the same direction based on Fibonacci extensions. This pattern closely correlates with the Elliott Wave theory and typically appears when there has been substantial price movement or adjustment in the marketplace and is approaching exhaustion.
10. 5-0 Pattern: This pattern was developed by Scott Carney and is substantially different from earlier developed patterns. The 5-0 uses a 50% Fibonacci retracement from the final 'CD' leg as the entry trigger and appears after three complete disappearances of the trends.
The occurrence of Bitcoin developing a Bat Pattern preceding a market reversal occurs frequently throughout the cryptocurrency market. These patterns are not merely theoretical constructs; they are utilised by traders daily in each of the world's major financial exchanges.
Step-by-Step Harmonic Pattern Trading Strategy for Forex and Crypto
Only part of the assignment is to detect harmonic patterns; knowing how to take advantage of or lose with those patterns is how traders profit or lose. A way you can do this is with step-by-step practical strategies.
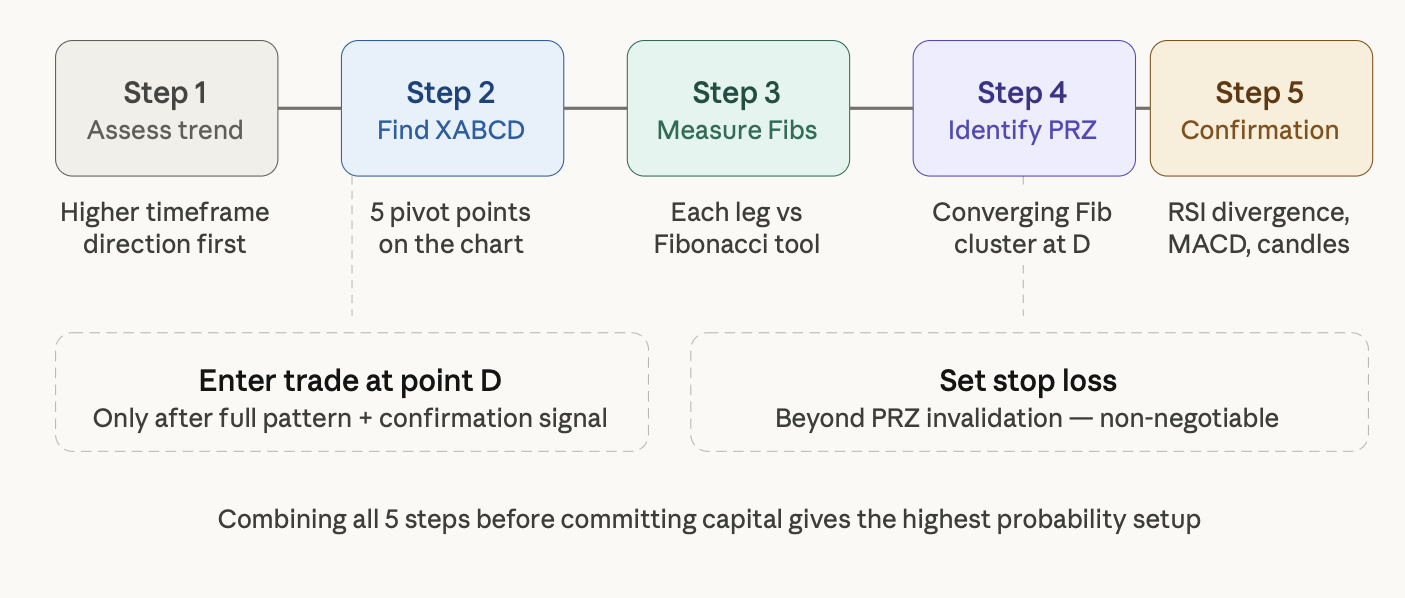
1.) Determine the trend of the market. What direction is the market going before you attempt to identify anything? If you trade a bullish harmonic pattern on an established downtrend, it's like swimming upstream. Start at an upper time frame.
2.) Look for an XABCD harmonic structure. You are searching for five pivot points on the chart to create the structure shown. At the beginning of the pattern, the structure between points A and B appears to be a regular AB retracement. When we get to point C, the market will clearly show whether or not the structure is complete.
3.) Measure retracements using Fibonacci tools. If you want precise results, measure from point X to point A and project point B using your Fibonacci retracement measurement. Then measure from point A to point B, and your projection for point C will be created. Every ratio needs to be matched with the particular pattern you are trading.
4.) Identify your PRZ (potential reversal zone). Your PRZ is the group of converged Fibonacci levels around point D. The tighter the cluster overhead around point D, the stronger the potential reversal zone will be. Price may not always reverse at an exact point; in most cases, it will reverse at a zone.
5.) Look for confirmation signals. This step is common since, early in their trading experience, many traders will look at a complete pattern and jump in immediately. Professional traders wait until confirmation to enter; confirmation could come from RSI with divergence, MACD crossing or candlestick rejection patterns at the potential reversal zone.
The Bitcoin chart for the 4-hour time frame shows how a harmonic reversal pattern can be used to create a successful trade. The price touched the PRZ, there was a divergence on RSI, and a bearish engulfing candle closed above point D for three layers of confirmation prior to putting any risk in the market.
Always use caution when trading solely based on harmonic patterns; this is a great tool to help you trade, but they are not foolproof.
How AI and Algorithmic Trading Systems Identify Harmonic Patterns
Harmonic Trading once involved a manual process of measuring Fibonacci Retracements by hand on a myriad of charts as traders sat there manually measuring all the possible combinations of the Fibonacci tool. However, this has changed immensely!
Today, modern-day trading systems utilise Artificial Intelligence (AI), Quantitative Models, and Pattern Recognition Algorithms to automatically scan thousands of charts in real-time for any possible Fibonacci Retracement levels that connect at the same time across any timeframe and any market whatsoever. If two Fibonacci Retracement Levels connect, they get flagged by a computer to indicate there's a potential setup.
Regarding trading in crypto, there are a huge number of bots programmed to find Harmonic Patterns (210) and trade them the instant they are confirmed (PRZ). For manual traders, there are two things that should be noted when trying to establish a good trading strategy based on the Harmonics. Because trades occur quickly when patterns form, they need to be executed very quickly. As well, since there is so much capital being utilised at the same Fib Level, they reinforce one another, which increases their reliability.
AI tools can also rate patterns based on their historical accuracy and filter them based on confluence with other indicators. A trader can create their strategy and backtest it against years of historical price data in just minutes. This puts retail traders on a more even playing field than we have seen in the past.
Modern trading systems are changing the way financial markets operate, and Harmonic Pattern Trading is one way technology has changed our methods of operation.
5 Common Harmonic Pattern Trading Mistakes Beginners Make
Traders do not generally lose when using harmonic patterns, but rather they lose because of how they trade the patterns.
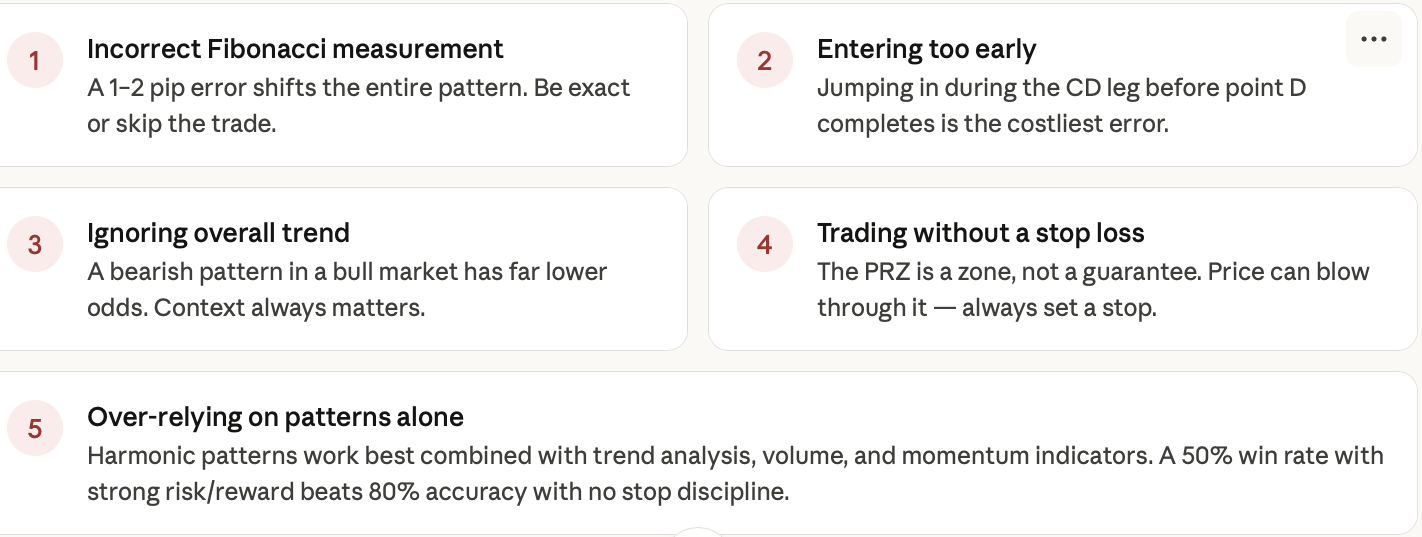
Mistake 1 - Fibonacci measurements that were done incorrectly. If you have a 1-2 pip difference on your retracement tool, you have a completely different pattern. Be precise or do not take the trade.
Mistake 2 - Entering Too Early: When seeing a pattern during the CD leg and taking your trade before point D has been complete, this is the most common and costliest mistake you can make – wait for the entire structure to be complete.
Mistake 3 - Ignoring the Overall Trend of the Market: A bearish harmonic pattern in a bull market has a much lower probability of working than having the same pattern in a downtrend or at major resistance levels. Context matters 100 per cent of the time!
Mistake 4 - Trading without a Stop Loss: The PRZ is a zone, not a guarantee. Price can blow straight through it. Placing your stop loss even one pip beyond the level of invalidation isn't negotiable.
Mistake 5 - Over-Relying on Patterns: Harmonic Patterns are one of the tools in your toolbox, and traders who use harmonic patterns along with trend analysis, volume, and momentum indicators are going to consistently outperform those who trade outside of these tools.
Risk Management is far more important than Pattern Accuracy. A trader who has a 50 per cent win rate with a solid risk/reward ratio will consistently outperform a trader who has an 80 per cent win rate without the discipline of having stop loss rules.
Frequently Asked Questions
What is a harmonic pattern?
A harmonic pattern is a trading method that uses Fibonacci ratios and geometric price structures to identify potential market reversal points. It follows an XABCD format where each leg is measured using specific Fibonacci levels.
Are harmonic patterns reliable?
When combined with proper Fibonacci measurements and confirmation indicators, harmonic patterns can offer high-probability trade setups. They work best alongside trend analysis and volume confirmation, not in isolation.
Do harmonic patterns work in cryptocurrency markets?
Yes. Harmonic patterns appear across crypto, forex, stock, and CFD markets. Bitcoin, Ethereum, and major altcoins regularly form Bat, Gartley, and Butterfly patterns on higher timeframes.
What's the most common harmonic pattern?
The Gartley Pattern is widely considered the most used harmonic trading setup. It's also the oldest, having been introduced by H.M. Gartley back in 1935.
How do I start learning harmonic patterns?
Start with the ABCD pattern, learn your Fibonacci tools thoroughly, then work up to the Gartley and Bat. Paper trade the setups before committing real capital.
Ready to put harmonic pattern theory into practice? Tradewill gives you the tools, charts, and real-market conditions to trade smarter from day one. Start trading on Tradewill and turn pattern knowledge into actual edge.
Disclaimer: The content of the blog does not represent any position of Trade W, does not serve as any trading-related decision advice, and does not endorse any third-party.