

 Trade W
There are usually warning signs before a market crashes. Markets often stall and compress before they make one final push higher prior to collapsing. The ending diagonal is what this final push looks like. It is important to learn how to recognise the ending diagonal before the rest of the market does.
What is an Ending Diagonal?
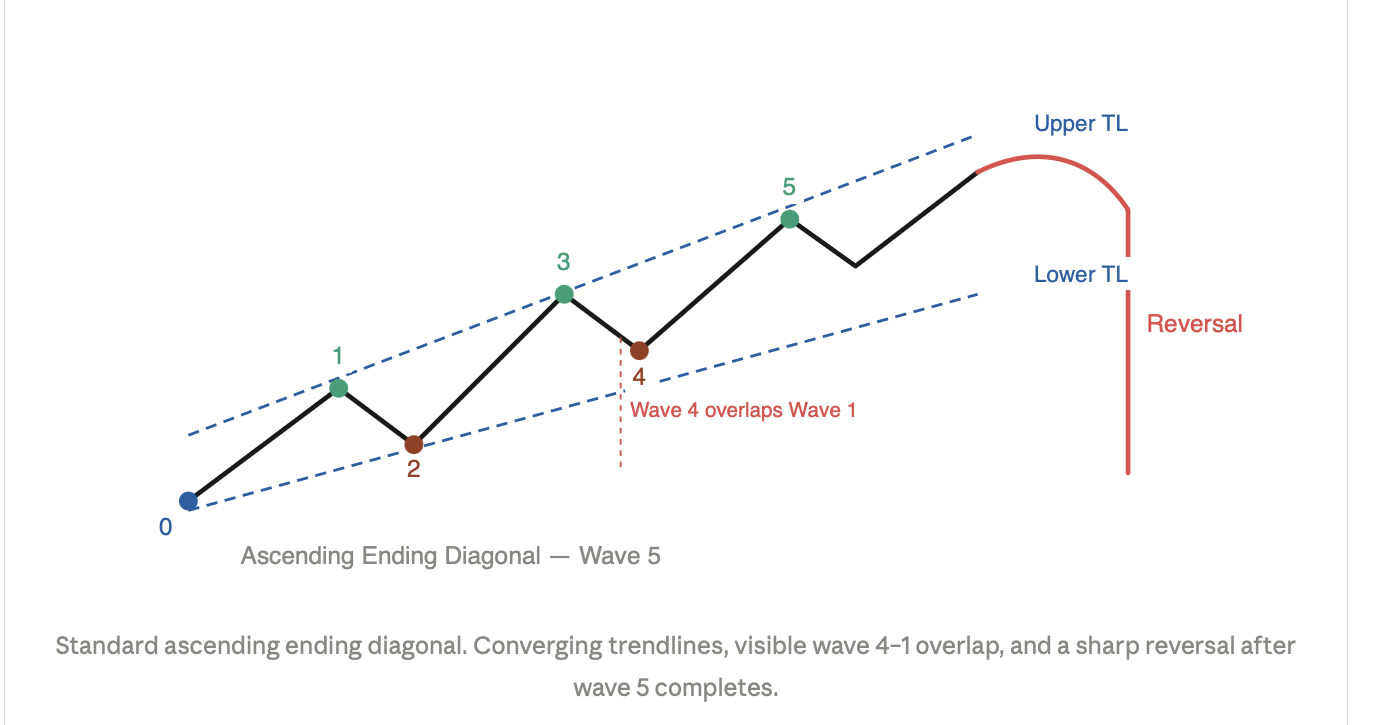
An ending diagonal is a specific Elliott Wave Theory formation that appears near the end of a trend. When an ending diagonal forms, it indicates that buyers in an uptrend are still attempting to push price to new highs, but the internal strength behind those buyers has already weakened. The term “ending” does not simply mean the close of a trend. It represents the end of one market phase and the beginning of another opportunity.
Most retail traders focus only on the fact that price continues making higher highs during an uptrend, and they interpret this as evidence of a strong trend. However, endings are often accompanied by momentum divergence on indicators such as the Relative Strength Index and Moving Average Convergence Divergence. In addition, as each new high requires significantly more effort than the previous one, trading volume often continues to decline.
“There is a simple analogy we can use to describe an ending diagonal,” states Greg Michalowski from Technical Analysis, Trading Strategies, and Financial Solutions. “Imagine a race car trying to climb a steep hill using the highest gear possible. The engine creates an incredible amount of noise with smoke pouring out of it, but the car still cannot make progress toward the top; it comes very close to stalling and rolling back down.”
The pattern signals the end of a major market reversal phase and can help identify significant tops or bottoms before most traders have time to react. You are not simply guessing where resistance lies; you are analysing the internal structure of the market to determine where to place your trade.
The 3 Golden Rules to Identify an Ending Diagonal
When looking for a valid ending diagonal, all three of the following principles must be followed. If you miss one of these principles, you are not looking at an ending diagonal; you are looking at another type of pattern.
Converging Trendlines - The Funnel Shape
When drawing the trendlines for the converging structure, connect the tops of waves 1, 3, and 5, and connect the bottoms of waves 2 and 4. The two trendlines should have a similar slope and converge toward the same point on the chart. Together, these trendlines form a funnel or a compressed spring at the end of a move, and the more they converge, the closer you are to a potential breakout.
Wave 4 Overlaps Wave 1 - The Non-Negotiable Rule
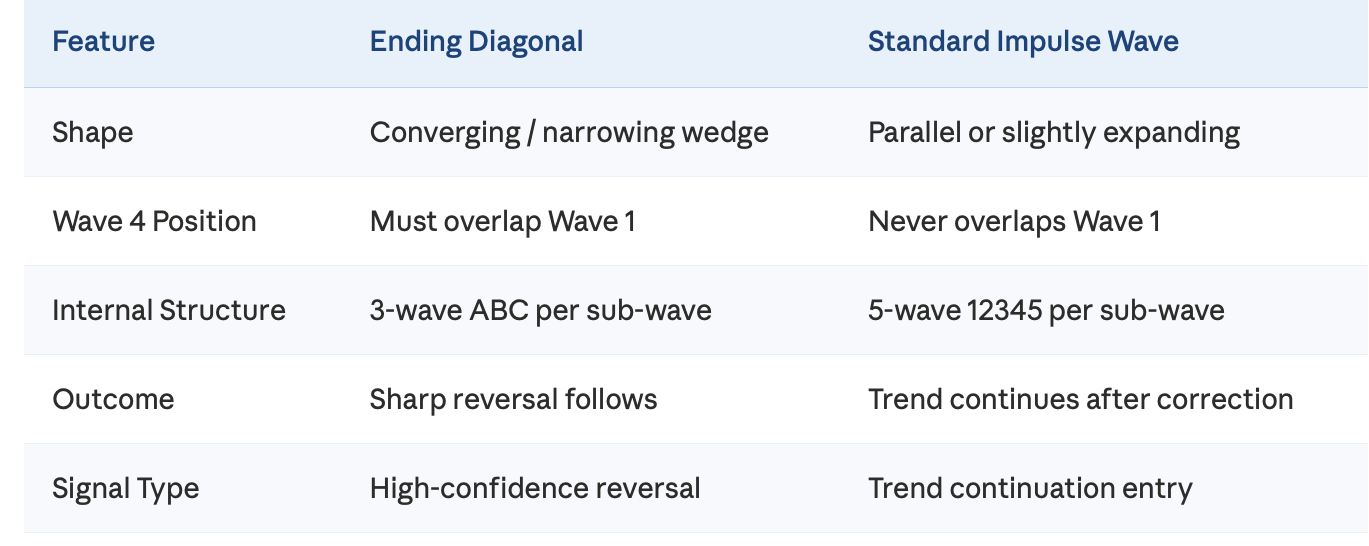
Wave 4 must enter the price territory of wave 1 in a standard impulse structure. In an ending diagonal, wave 4 will overlap wave 1. This overlap is essential; if there is no overlap between waves 1 and 4, it is not an ending diagonal.
Internal Structure of Ending Diagonals - 3-3-3-3-3
Each of the five waves in an ending diagonal should form its own three-wave A-B-C structure, creating an overall 3-3-3-3-3 pattern. This structure shows that the market has limited directional momentum and is gradually losing strength, with price action appearing to slow and compress rather than trend strongly.
 Ending Diagonal vs. Leading Diagonal: Don't Confuse the Two
Don’t make the mistake of mixing up A, B, C wave patterns with leading diagonals.
A lot of beginners in trading confuse these two commonly seen patterns. They may look very similar on a chart, but they can lead to very different outcomes. This often causes traders to lose money when trying to trade the same pattern incorrectly. They may trade it one way, for example buying a perceived low, and later discover they should have taken the opposite side, selling near a high. This mistake is common and avoidable.
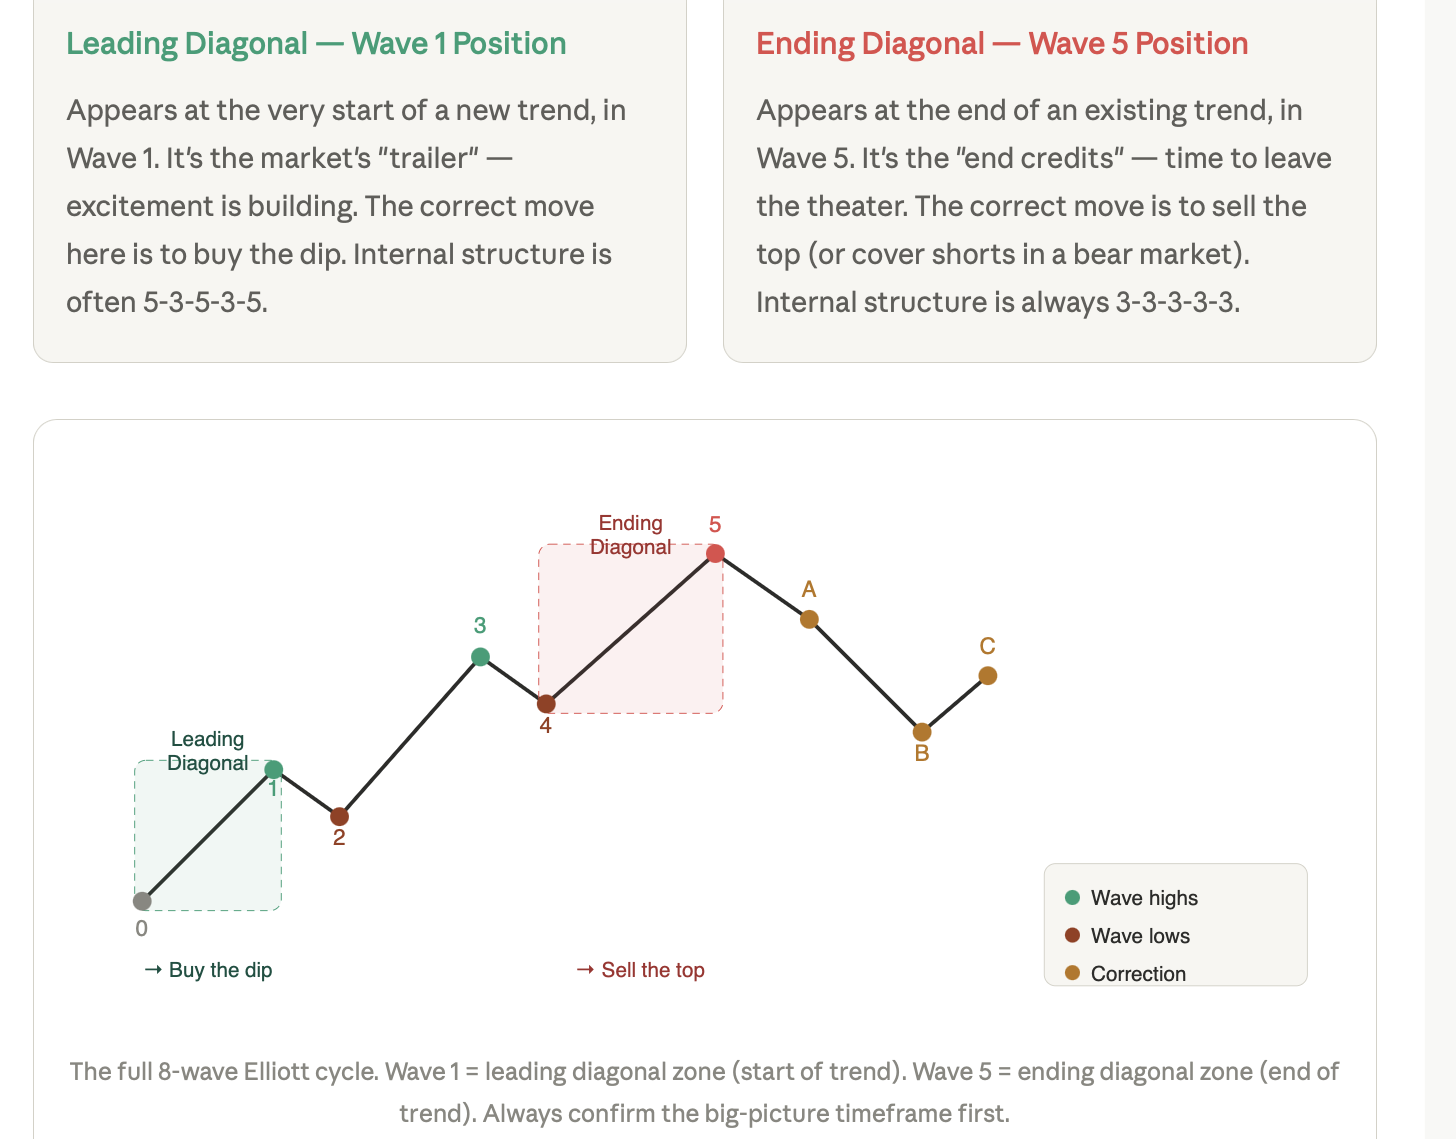
They see what they think is a wedge for wave 1 and sell based on the breakout from wave 1. When they do this, the market may quickly rally instead, because it was actually forming a leading diagonal. Always remember to zoom out and review more price history from the origin at wave zero before making any trades.
2026 Strategy: Safe Way to Trade a Breakout
Just because you can spot the pattern does not mean you can make money; profits come from execution and discipline. Below you will find the full entry-to-exit action plan.
Step 1 - Do Not Enter the Pattern Early
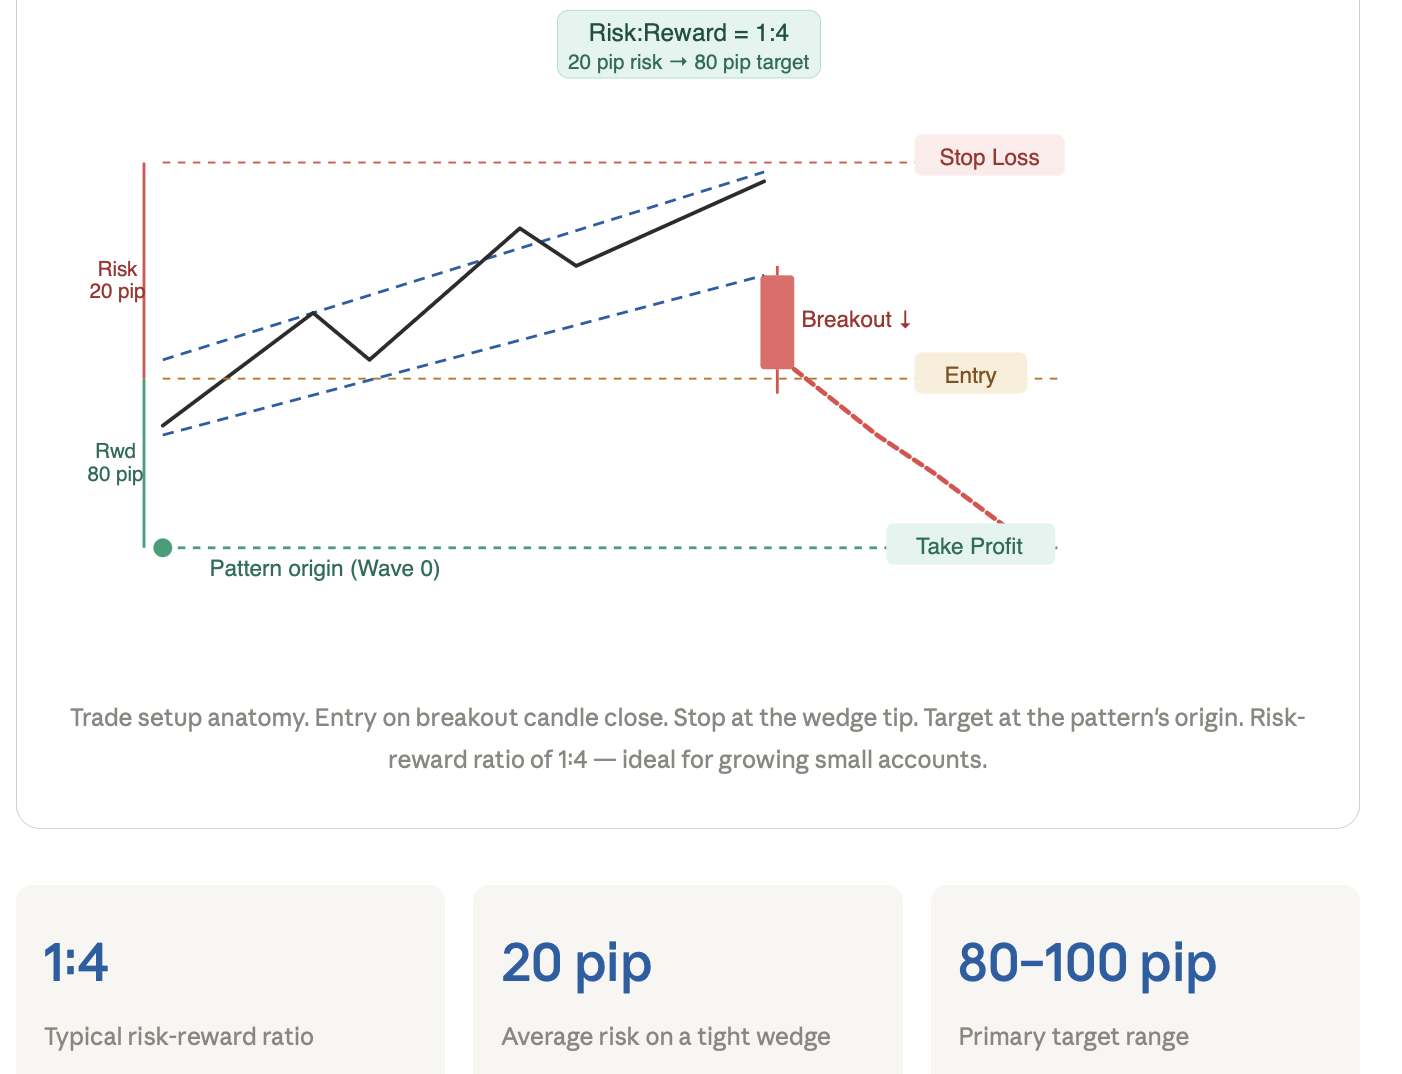
The mistake that causes most beginner traders to lose money is seeing a wedge forming, becoming impatient, and shorting on wave 5 before it is complete. Wave 5 can extend for days. Wait for a clear break below the lower trend line in a bearish reversal, or a clear break above the upper trend line in a bearish ending diagonal before entering. The breakout must also confirm before the pattern can be considered complete.
Step 2 - Confirm With Volume and TradeWill Volatility Filter
The breakout must occur with an increase in volume. A breakout is less likely to succeed without sufficient volume confirmation. The second confirmation, through the TradeWill Volatility Filter (2026 standard), measures momentum at the breakout candle using volatility. When combined with volume at the breakout candle, this reduces the likelihood of entering a false breakout.
Step 3 - Set Your Stop at the Tip of the Pattern
The wedge converges toward a sharp point. From your entry point to the tip of the pattern is a relatively short distance. This is the main advantage of this setup: a very tight stop combined with a large potential target, creating a strong risk-to-reward structure even before calculation.
Step 4 - Target the Origin of the Pattern
The initial profit target for the entire diagonal is the origin of the structure. The beginning of wave 1 is often the point to which the market returns after completing an ending diagonal. The market frequently revisits that level quickly, regardless of how long the pattern took to form. For example, a three-week build-up may reverse and reach the origin within three days.
2 Real-World Case Studies of Gold & Bitcoin in 2026 (Ending Diagonals)
Theory is important, but real trades are far more important. The case studies below illustrate how the ending diagonal setup played out in two of 2026’s most liquid markets.
Gold (XAU/USD) - Geopolitical Inflation Top
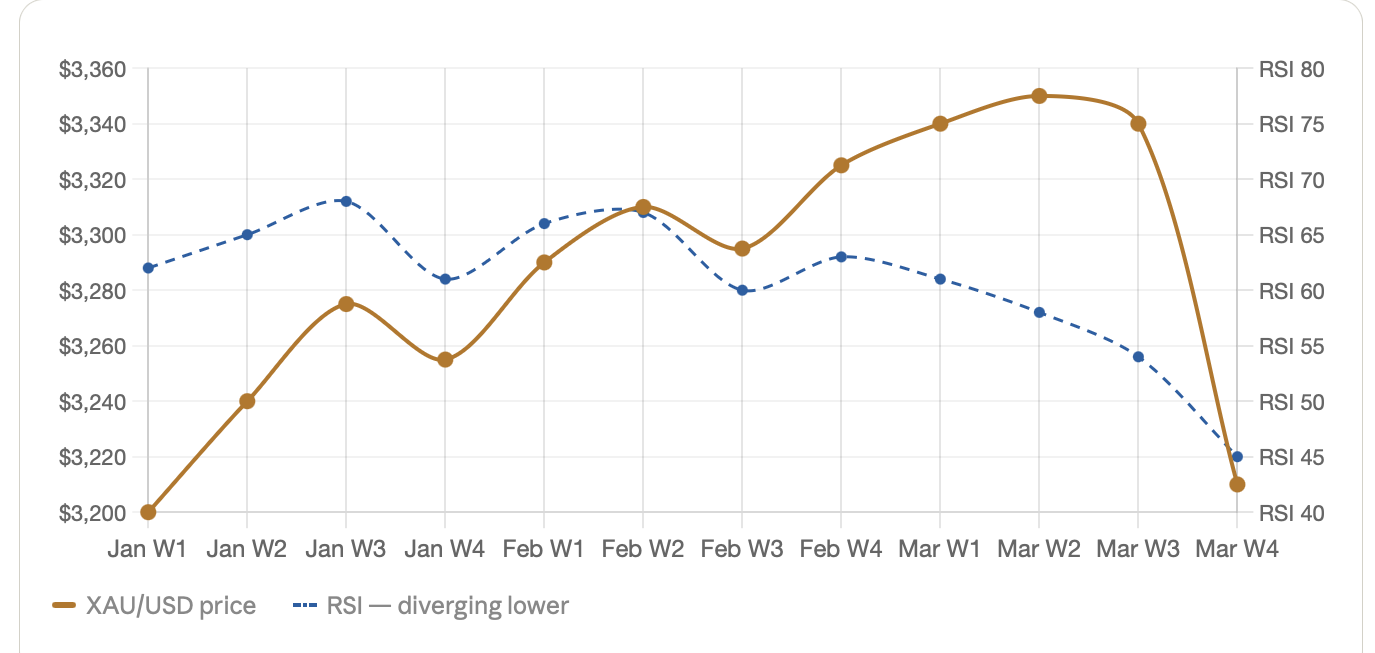
After a period of geopolitical turmoil at the beginning of 2026, Gold traded higher in a classical 5-wave impulse move into an ending diagonal for the final wave. Price made marginal new highs while the Relative Strength Index printed lower highs on the daily chart, showing bearish divergence.
The two converging trendlines showed strong compression. Wave 4 overlapped into wave 1 territory, confirming the diagonal structure. An upside breakout occurred through the lower diagonal trendline on above-average volume. Price then retraced the entire structure in approximately 40% of the time it took to form, falling from $3,480 back toward the $3,210 origin zone.
Psychological Wedge on Bitcoin
During Q1 2026, Bitcoin struggled to remain above an important psychological threshold. As price moved higher, candle bodies became progressively smaller, forming an internal 3-3-3-3-3 structure on the 4-hour chart.
Eventually, a large bearish candle broke the lower trendline decisively, and the entire pattern quickly dissolved. Traders who waited for breakout confirmation, rather than anticipating the move, avoided premature entries and false breakout trades within the wedge.
Conclusion
Highly liquid assets such as Gold, Bitcoin, and major forex pairs tend to produce the clearest ending diagonal structures. In contrast, as market liquidity decreases, these diagonal formations become less defined and harder to interpret.
Trade the assets where participants are actively competing for every pip.
The 2026 Reversal Checklist
The ending diagonal shows that a trend is losing momentum. All three components of the ending diagonal, the converging lines, the overlap, and the internal three-wave structure, indicate that the move has exhausted its strength.
Once you have identified all three components and the breakout is confirmed, you are in a position to take advantage of what may be one of the cleanest asymmetric setups.
The two trendlines are converging, forming a narrow cone-shaped pattern on the chart.
Wave 4 has clearly overlapped the price area of wave 1, with no exceptions and no ambiguity.
Enter the trade only once the breakout candle has closed beyond the trendline, supported by volume confirmation.
Open a free demo account on TradeWill and use the built-in backtesting tool to hunt ending diagonals across last month's Gold, EUR/USD, and Bitcoin charts. Your first three real trade setups are hiding there right now.
Disclaimer: The content of the blog does not represent any position of Trade W, does not serve as any trading-related decision advice, and does not endorse any third-party.