

 Trade W

What Is the Wyckoff Method? The Wyckoff method utilizes a method for analysing the market to give traders insight into how institutional investors are accumulating and distributing assets. By utilising price movement, volume, and supply and demand variances, traders will be able to chart the market's cycles of accumulation, markup, distribution and markdown.
Why Richard D. Wyckoff Still Matters Today
Why is Richard D. Wyckoff still a popular study for professional Wall Street traders over 100 years after he died?
Because of the way the markets operate.
Richard D. Wyckoff was a stock market trader, like most others, who noticed that price movement was not random but that prices reflected deliberate manipulation through groups of traders who could significantly affect prices. From this realisation, he created one of the most widely used technical analysis models still in use today.
The core of Richard Wyckoff’s model is based on a principle called the Composite Man. In simple terms, rather than attempting to look at price movement from the thousands of individual traders, look at price movement from the perspective of one large and powerful player who makes up the market and can buy “under the radar” or at a determined point, creating both interest and euphoria within the small to mid-cap players until the Composite Man sells into that buying frenzy created.
This philosophy still exists in today’s markets with all types of assets from Bitcoin to EURUSD to the many CFD products. The mechanics of each market are changing, but the actions based on the principles Richard Wyckoff created still exist.
This article will take you through the entire Wyckoff methodology of trading: the philosophy, the trading cycles, the accumulation and distribution setups, and how to apply all of the models practically.
The Composite Man and Institutional Market Behaviour
Let’s discuss the philosophy behind it all. Wyckoff's theory is that retail traders lose money not due to stupidity but due to misunderstanding the intent of trades. They look at price movements and are usually emotional about making their decisions. A lot of the time, they chase a breakout on the way up, panic at the dips, and then get out of their position before the move occurs.
The institutions do not make decisions based on emotions like retail traders. Institutions will spend time accumulating millions of dollars' worth of an asset without moving the price against themselves. They do this by buying slowly, when there is very low volatility or when traders are bored or fearful.
After they have purchased all of their shares, they use this buying to create the conditions for other people to want to buy before they sell into that demand.
Wyckoff refers to this accumulation and distribution process as "The Composite Man". When Wyckoff talks about "the composite man", he is describing the entire process of purchasing and selling from an overall perspective; it is a mental model, not a conspiracy theory.
It allows traders to ask better questions: What would a large institutional trader be doing right now? How would I know if they are doing that? How would it appear in price and volume?
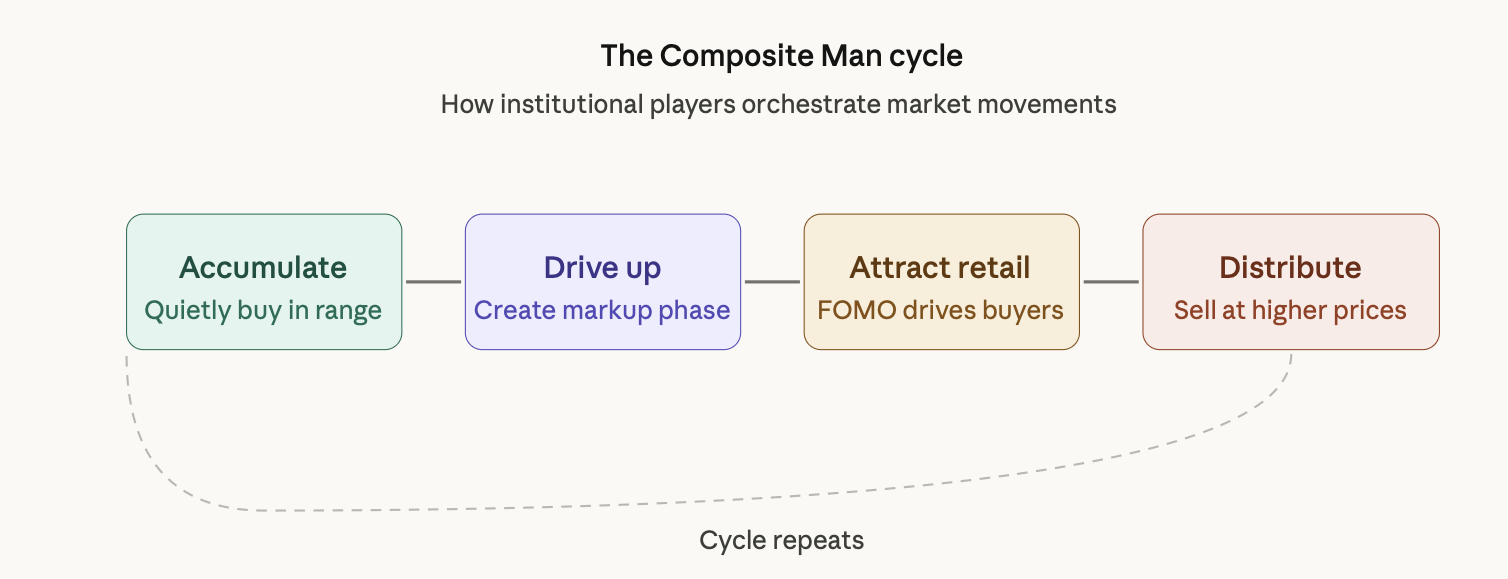
By grasping this cycle, you not only learn how to better read charts, but it will alter your questioning technique from "Is this going to break out?" to "Is this a legitimate breakout, or will they be attempting to con me?"
The Three Fundamental Laws of the Wyckoff Method
Wyckoff's framework runs on three core principles. These aren't abstract theories; they're observable in every market you trade.
Law 1: Supply and Demand
Demand pushes prices up, while supply pushes prices down. Simple to understand, right? But Wyckoff encourages traders to look for who exactly created that demand.
Institutions gather buy orders before they create an accumulation and will trade into sell orders to create a distribution. Retail traders believe the price movement is due to the news cycle and their experience with the price extremes, but Wyckoff traders believe there is a major supply or demand being created by someone behind the scenes.
An example of this: if gold breaks through a major resistance level and the volume is very high at the breakout, there's likely institutional demand creating the breakout; however, if the volume is thin, then the breakout may not be sustainable.
Law 2: Cause and Effect
This principle is an explanation as to why certain market movements develop into explosive events, while other developments simply fizzle away. The size of the movement (the effect) will always be directly proportional to the amount of accumulation or distribution that occurred prior to that movement (the cause).
A stock that has been consolidating for six months will have much greater cause than a stock that has consolidated for just two weeks. Because of that greater cause, if the stock breaks out from the consolidation, it will have the potential to move much more than the stock that had a lesser cause. Think of it like compressing a spring: the longer and tighter the compression, the larger the amount of energy released.
The 2020 run-up in Bitcoin provides a great example. The accumulation phase from late 2019 to mid-2020 was persistent and messy. The markup phase resulted in the price moving from roughly $10,000 to just about $65,000.
Law 3: Effort vs. Result
This is where volume can be more than just decorative; it serves a purpose.
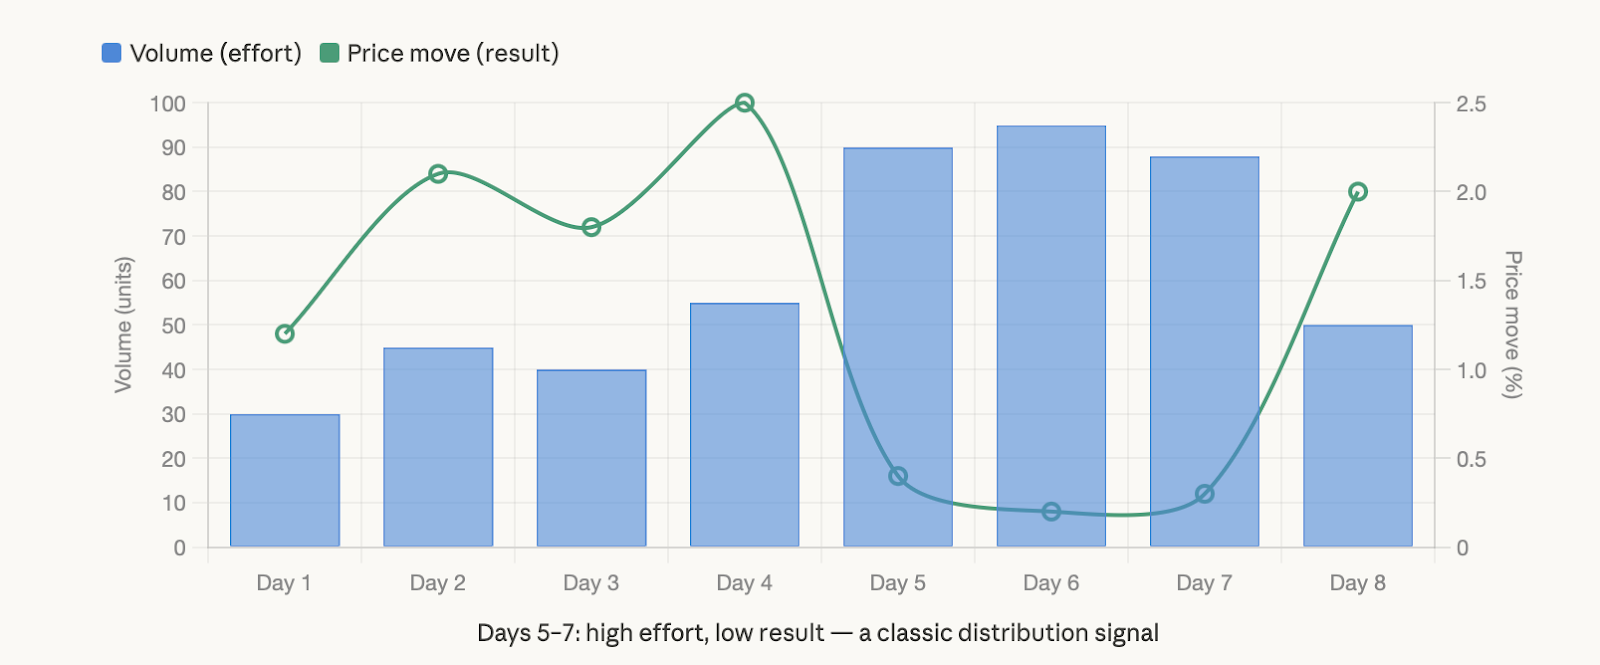
The volume traded is effort as the price movement that follows is a reaction. Therefore, when both volume and price move the same magnitude, the market behaves itself. If there is a huge volume with a small price move or no move, it's off base.
When there is a high volume and small price movement, it is usually a sign that the large participants are accepting every buy or sell order, which indicates accumulation at that level. This is one of Wyckoff's best indicators of market behaviour.
The Wyckoff Market Cycle
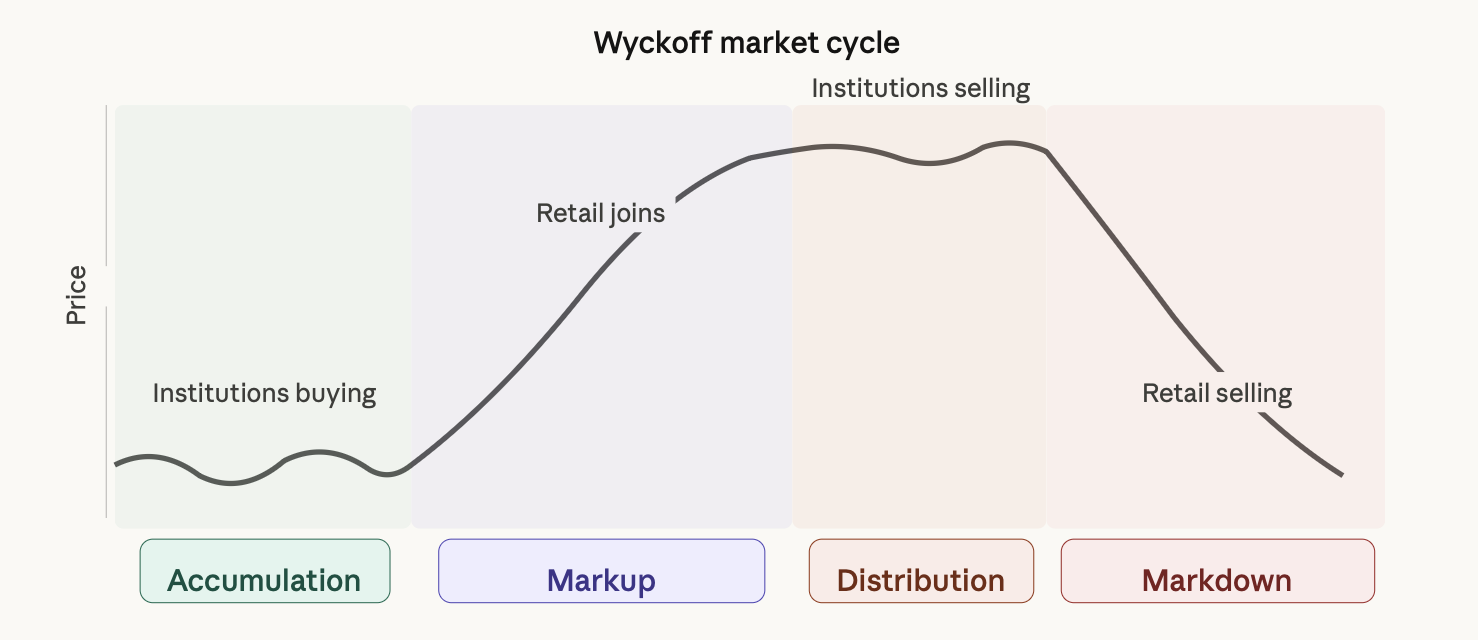
Every market experiences four phases. It is important to know where you are in these phases.
Phase 1 - Accumulation: This is where price movements remain within a range for extended periods of time. During this phase, institutional traders are buying shares, and retail traders have no interest in purchasing or are bearish. Volume is often irregular during this phase, and, to most traders, the price movements resemble noise.
Phase 2 - Markup: This is where price movement begins to move in an uptrend. Momentum traders also start showing up. News is positive to the trading community, and all the traders who entered at the accumulation phase are starting to make profits.
Phase 3 - Distribution: As the markets near their peak, the institutions are starting to sell stock. Even if the price movements remain in a sideways trading range or reach new highs, the character of the stock is no longer the same.
In fact, although there will continue to be a lot of volume in the stock, the price will make little or no advancement to new highs. Retail traders will continue to remain bullish.
Phase 4 - Markdown: This is the phase where prices begin to fall rapidly. Late-arriving purchasers will find themselves "stuck" in the stock. After this phase, the cycle will begin again at a lower price level or in a new accumulation range.
The cycle of Bitcoin from 2020 to 2021 is arguably the best example that has existed for modern finance's four stages, all happening in chronological order. A period of accumulation occurred between late 2019 and early 2020; then a period of markup, usually largely missed by the retail trader during its early stage, occurred between early-mid 2020.
Finally, as noted above, there were periods before, during and after there was a $60k high, in which there was a period of distribution and then a markdown of price back to around $30k by around mid 2021.
The Accumulation Schematic and the Spring
Wyckoff Analysis is useful for traders because it allows them to identify the actions taken by institutional investors during their acquisition periods. Wyckoff also allows the trader to identify each event as to when it occurred and what it represented.
Preliminary Support (PS): PS is the first hint that an institution has come in during a downtrend. PS will show that volume is increasing with a decreasing rate of decline in price.
Selling Climaxes (SC): SC usually occur during a sharp price decline, which occurs with high volume and, typically, a large amount of panic selling from retail traders. Institutions will take advantage of this panic selling and buy up this distribution of shares.
Automatic Rally (AR): AR is the first bounce after SC. The top of AR is a reference point for the upper limits of the accumulation range.
Secondary Test (ST): second test of SC lows. This will have less volume than SC. This shows that selling pressure has diminished.
After ST, the next major event is the Spring.
Spring occurs when the price drops below the lower boundary of the accumulation range. Spring looks like it has broken through the lower boundary. Spring will trigger stop losses from traders who were positioned to expect the lower boundary to hold. Institutions will use this additional liquidity to fill up their positions at lower prices before quickly returning above the lower boundary.
After the spring, you will typically see a Sign of Strength (SOS) move up with increased volume after the accumulation phase and prior to the markup phase.
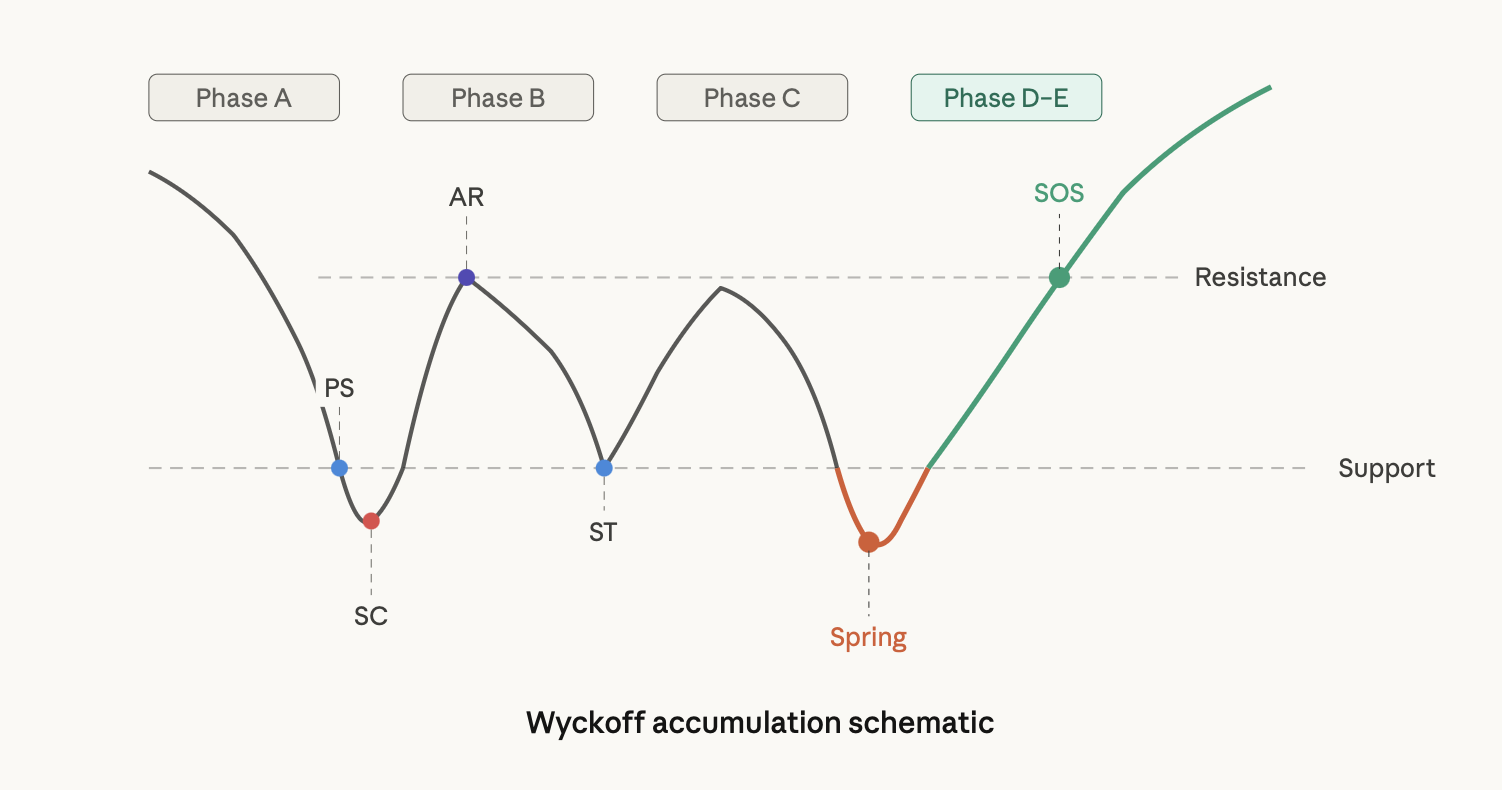
Retail Traders are usually wrong and do not realise it. Often, they think the Spring is a breakdown, and they panic sell right when the Institutions are aggressively buying. The signal is when the price snaps back above the support line within one or two candles. Then watch out for the SOS move to happen following this event. The volume on this move should be increasing, and the price should be closing near the high.
Distribution and How to Spot Market Tops
Like Accumulation, Distribution has an associated schematic. In many respects, they are mirrored images of each other.
As markets approach a peak price level, institutions have to start liquidating large positions. They cannot just sell everything at once, as this would create downward pressure on the price and hurt their profit. Instead, they gradually sell, usually over weeks/months, while retail traders maintain a bullish outlook.
The following signals will help you identify these distributions:
Upthrust (UT) - A false breakout above resistance. Price roars to a new high, supports the trend upward, only to reverse back down quickly. Institutions are actively selling into the excitement created by these breakouts.
Divergence between Volume and Price - Price continues to show new highs along with a decreasing volume, or price shows little movement with very high volume. Both of these can serve as warnings to potential buyers.
Upthrust After Distribution (UTAD) - The last upthrust break in price before distribution begins. This pattern typically occurs when all prior upthrust distribution patterns have already been created. An upthrust after distribution creates one last shake-out for all remaining weak short positions before prices begin to move downward rapidly.
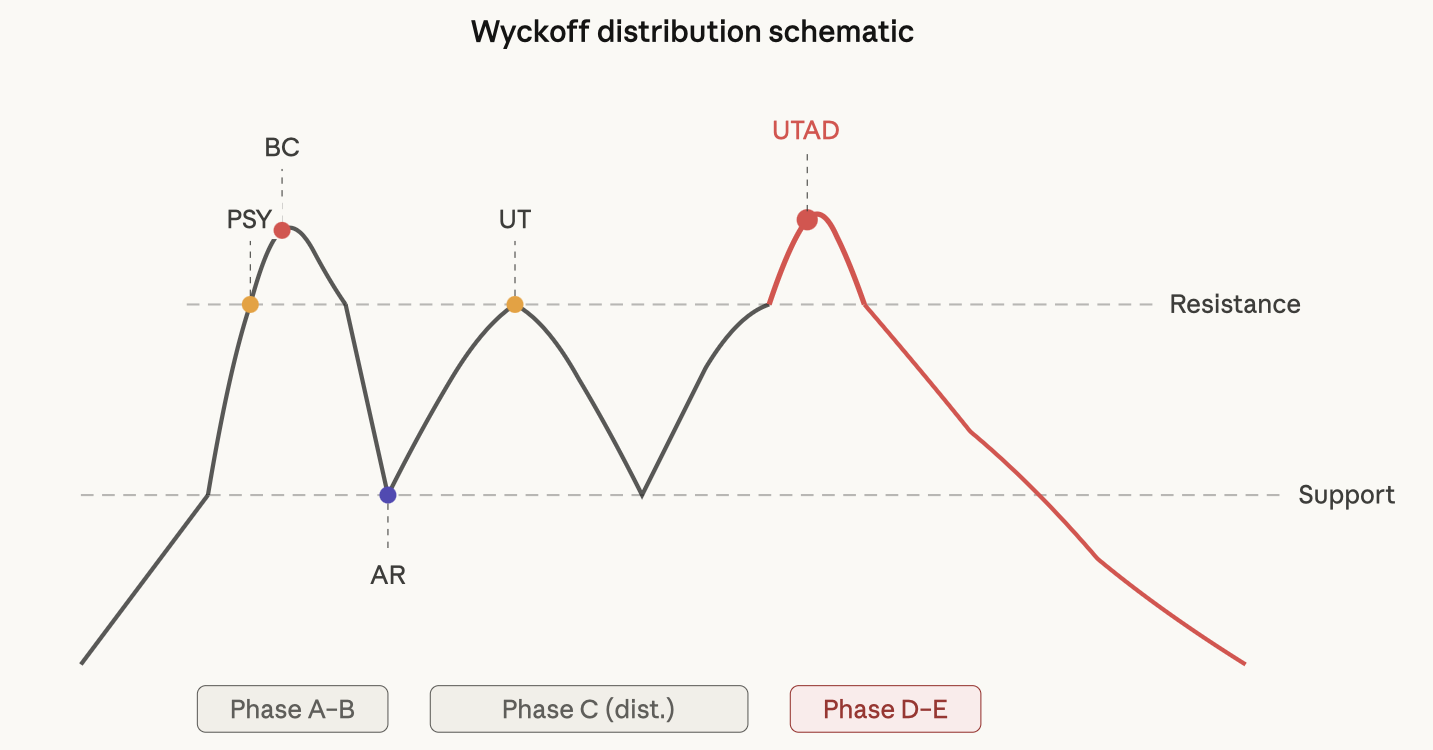
The near $65,000 top of Bitcoin in 2021 displayed the classic UTAD pattern. The price was briefly above its pre-existing peak but then quickly turned around with a sharp move to the downside on reduced volume. Many retail traders saw that spike as confirmation for entering into their positions in a bullish market. However, Wyckoff traders understood it to be a trap.
Wyckoff in the Algorithmic Trading Era
Many traders overlook Wyckoff’s principles based on the assumption that algorithmically-driven, high-frequency traders have replaced the traditional supply and demand dynamics provided by the market.
However, high-frequency trades simply accelerate these established supply and demand dynamics. So while the market now sees more rapid accumulation, markup, distribution, and markdown of stocks, the “footprints” remain the same.
Modern analytical tools such as Volume Profile and Order Flow analysis stem directly from the principles of Wyckoff. The Volume Profile shows where the highest level of trading occurred at specific price points, so you can determine the point of institutional activity. The Order Flow shows real-time purchases or sales between buyers and sellers.
Smart Money Concepts (SMC), used regularly in retail trading environments, essentially provides a repackaged version of Wyckoff concepts with new terminology. Various ideas, including liquidity grabs, fair value gaps, and order blocks, correspond closely with springboards, composite markets, and ranges of accumulation.
Understanding Wyckoff’s principles provides you with a foundational understanding of the SMC patterns you currently use. Therefore, by knowing why you trade a particular SMC, you will have more confidence trading it than if traded based on a defined SMC pattern or definition alone.
Applying the Wyckoff Method Step by Step
Here's a practical process you can apply to any market, whether you're trading Bitcoin, EUR/USD, or a CFD on a major index.
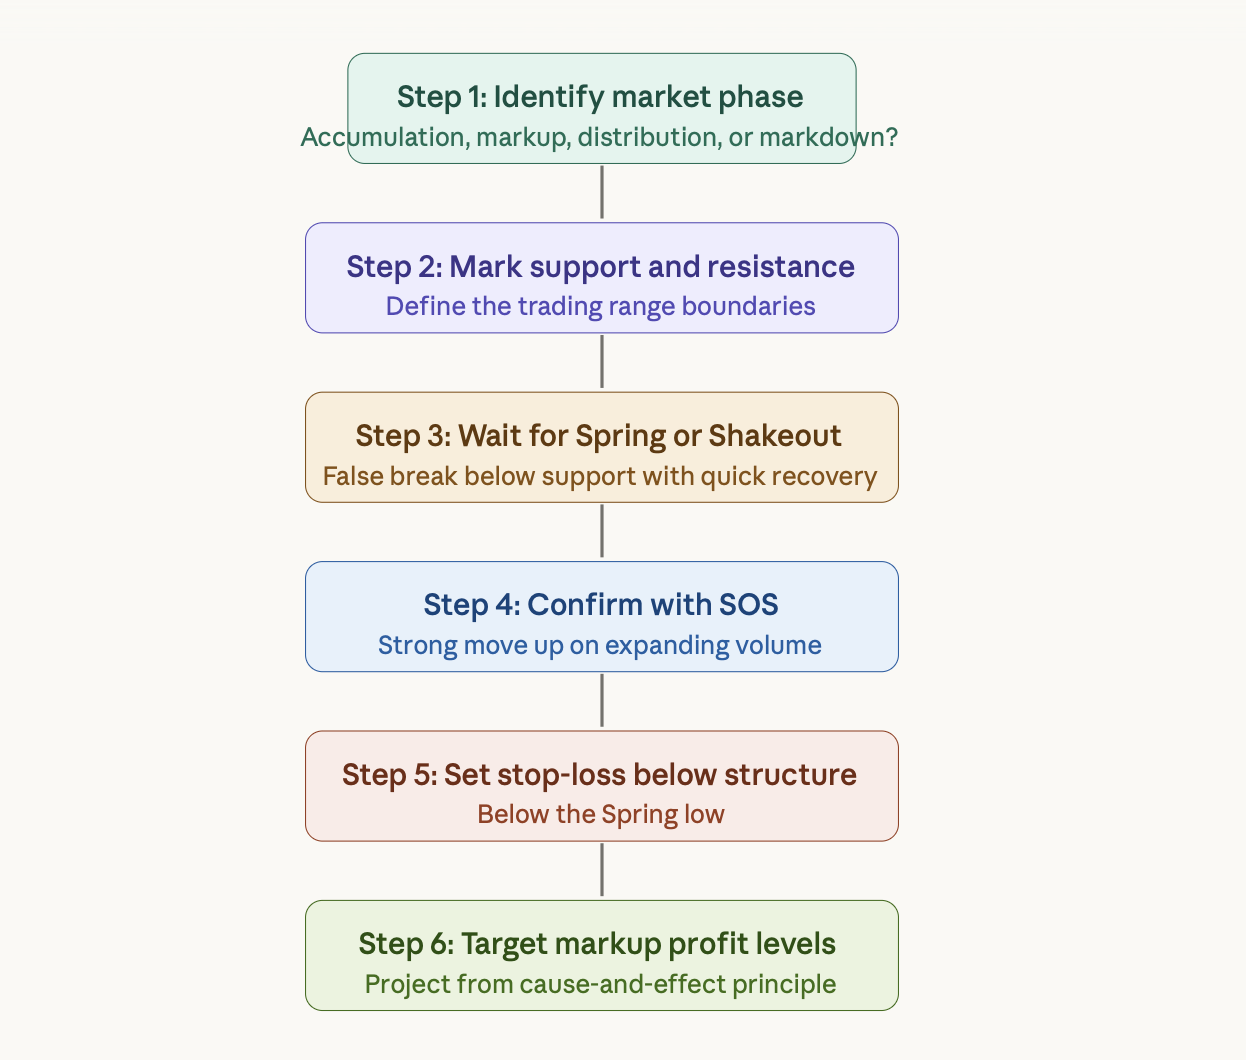
Phase 1 focuses on context. Avoid trying to trade through accumulation structures during a markdown phase. Knowing your position in the cycle will give you an entirely new perspective on price action.
Phase 2 establishes your battleground. Draw your support and resistance levels that represent the floor and ceiling of the range you’re working within. Those levels will serve as points of reference for your subsequent analysis.
Phase 3 requires a great deal of patience. Much of Wyckoff trading consists of being patient and anticipating a Spring. You aren’t chasing every price move, but waiting for one specific occurrence, which is when the price has temporarily fallen below support and then rapidly recovered in price.
Phase 4 confirms the validity of a Spring. Not every instance of price falling below support constitutes a Spring. In order to differentiate between real accumulation and legitimate price breaking down, you must have confirmation via a sign of strength, which is an upward movement of a significant nature and of a significant volume.
Phases 5 and 6 are concerned with risk management. The placement of your stop-loss should be below the low of the Spring, and your target calculated based upon the width and duration of the accumulation range, i.e., using the cause-and-effect principle. This will help you to maintain defined risk and a logical target.
The principles outlined above will work in the cryptocurrency markets, forex currency pairs, and CFDs because the fundamental mechanism is the same in all instances: institutions are accumulating and distributing assets, and they leave behind trails that you can read in both price and volume charts.
FAQ
Who was Richard D. Wyckoff? Richard D. Wyckoff was an early 20th-century Wall Street trader and analyst who developed one of the most influential market analysis frameworks in trading history. He founded the Magazine of Wall Street and dedicated much of his later career to educating retail traders about how institutional players actually move markets.
What is the Wyckoff Method in trading? It's a framework that uses price action, volume, and supply-demand dynamics to identify market phases: accumulation, markup, distribution, and markdown. The goal is to align your trades with institutional behaviour rather than react to surface-level price moves.
What is a Wyckoff Spring? A Spring is a brief dip below the support level of an accumulation range that quickly reverses back above support. It's designed to trigger stop losses from retail traders, giving institutions a chance to buy at lower prices. A fast recovery is the key confirmation.
Does Wyckoff analysis work in cryptocurrency markets? Yes. Crypto markets are particularly well-suited to Wyckoff analysis because they're less regulated and often driven more transparently by large wallet activity. Bitcoin's 2020 accumulation phase and the 2021 distribution top are frequently cited as textbook examples.
Is the Wyckoff Method suitable for beginner traders? The core concepts (supply and demand, market cycles, volume analysis) are beginner-friendly. The advanced setups, like reading accumulation schematics, take time tointernalisee. Start with the four market phases and the three laws before moving to specific entry setups.
Stop guessing where the market is headed. Learn to read it the way institutions do with Tradewill's analysis tools and trade smarter from your next session. Visit tradewill.com
Disclaimer: The content of the blog does not represent any position of Trade W, does not serve as any trading-related decision advice, and does not endorse any third-party.