

 Trade W

Why Nvidia Stock Is Dropping Today: Key Insights for Traders & Investors
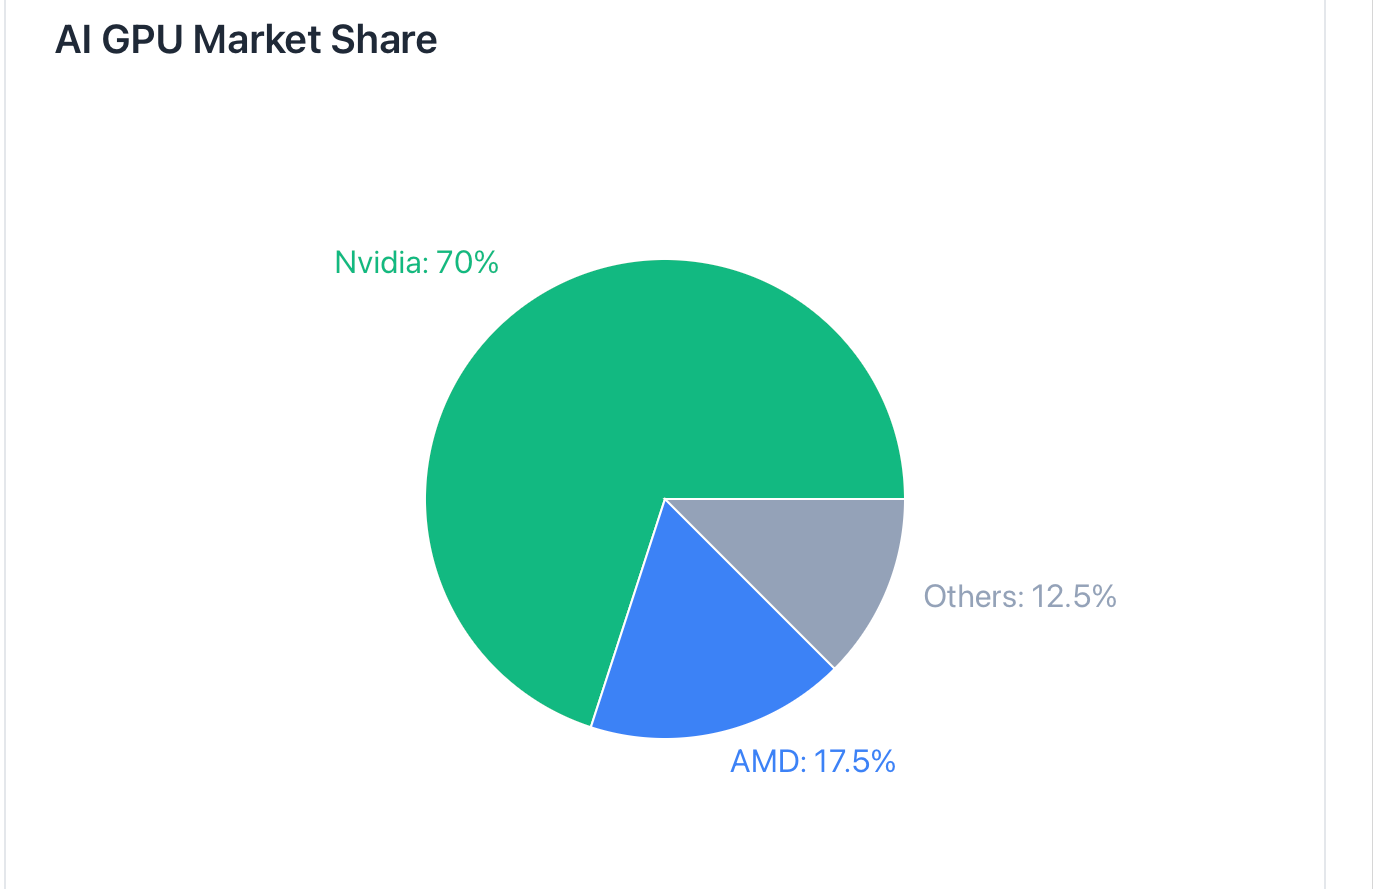
Whenever Nvidia's stock price changes, it is of great interest to the tech community. Nvidia is the number one supplier of AI GPUs with over 70% of the global market their performance impacts all semiconductor and AI equities and technology indices alike. Nvidia's current stock price decline is not just another down day for them, but gives us an insight as to how market forces, competition and investor psychology all contribute to creating one of the largest traded stocks in modern markets.
Nvidia can be seen as if the most popular video game store had a sale, stock shortage or change of price: every casual gamer and professional gamer alike would notice and be impacted. In this scenario, it’s different and significantly larger in scale, involving billions of dollars’ worth of market capitalization and numerous institutional portfolios.
Nvidia also has an even greater impact on professional traders. Since Nvidia is the dominant player in the AI Infrastructure sector, quarterly earnings seasonally, product launch and guidance announcements from the company can affect entire sectors in the marketplace.
The 2023-2024 earnings cycles are a great demonstrator of this: Nvidia has had massive rallies prior to earnings followed by significant corrections regardless of whether they were better-than-expected results. By understanding these trends traders can prepare for potential volatility and productively position themselves.
Market Share Snapshot:
-
Nvidia: 70%+
-
AMD: 15-20%
-
Others (Intel, Google, Amazon): 10-15%
What precedes the supply chain of semiconductors, the way in which the production of semiconductors occurs, is similar to a chain reaction, where everything reacts similarly to how Nvidia altered or changed their chip orders.
This is further demonstrated by how many companies have contracts to supply or produce semiconductor devices as well as other components for devices made by AMD as well as Nvidia.
Is Nvidia Stock Overvalued? Understanding the Valuation Pressure Behind the Drop
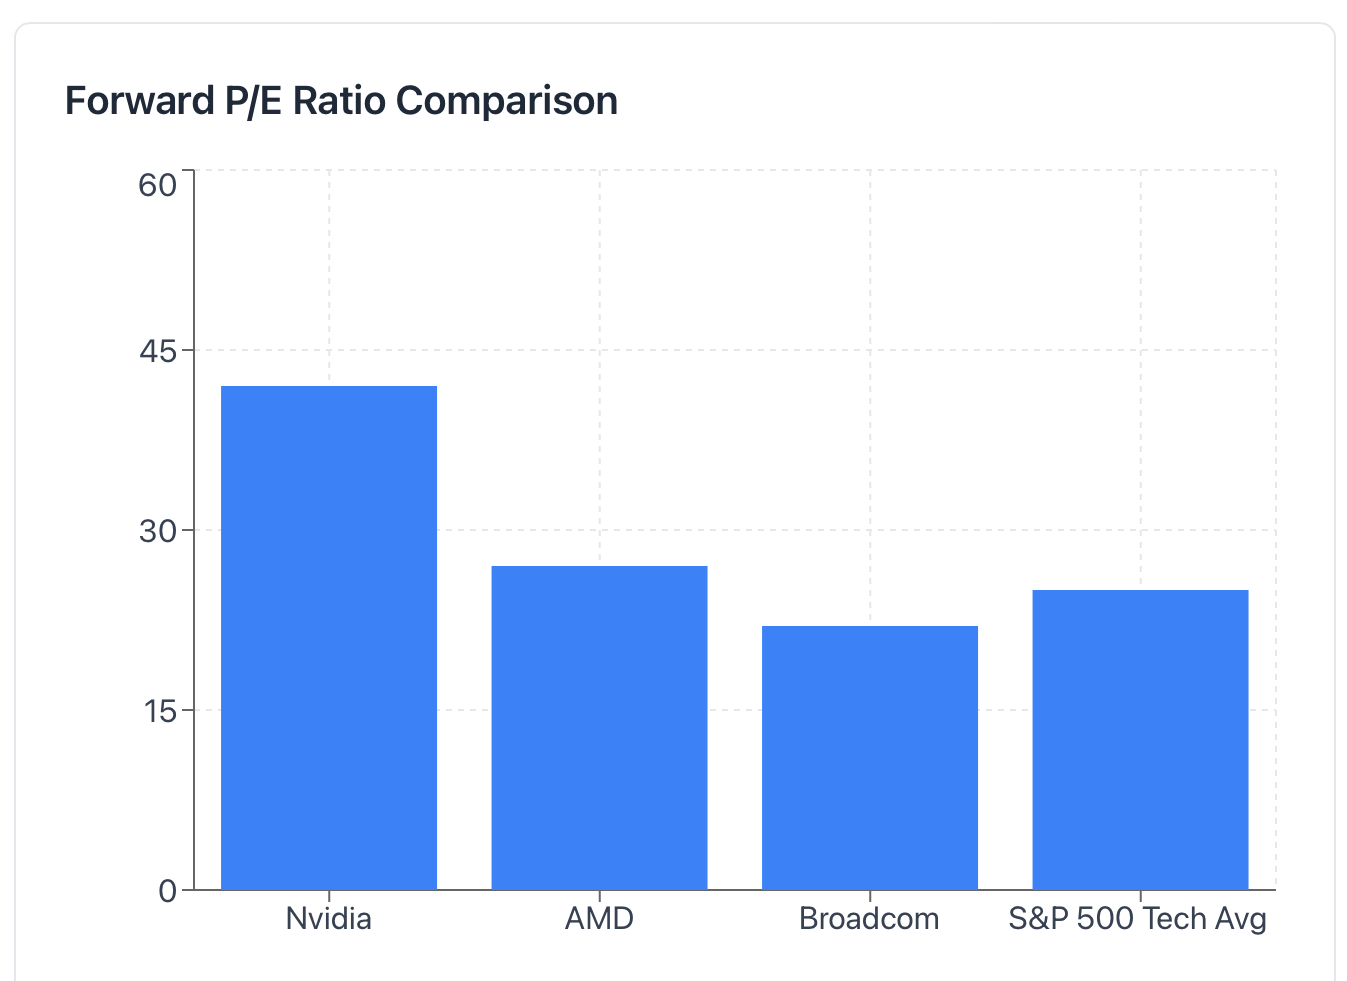
There is a lot of anxiety around valuations particularly for investors in stocks that trade at multiples that are higher than traditional valuations. For example, Nvidia's current Forward P/E ratio of more than 40 is significantly above the S&P 500 Tech Sector average which is around 25. The difference between these two numbers indicates that there are very high expectations for Nvidia. As such, whenever these high expectations fall short, it triggers a significant amount of selling activity in the market.
Think about it this way; when a concert ticket goes from $100 to $400 in just a few months, there will come a time when people ask "Is this ticket still worth $400?" This is exactly what happens with high-growth stocks. Investors who purchased shares at lower valuations and see the price of their shares increase significantly above what they paid will generally sell shares and take their profits.
Valuation comparison:
-
Nvidia Forward P/E: ~40-45
-
AMD Forward P/E: ~25-30
-
Broadcom Forward P/E: ~20-25
-
S&P 500 average tech: ~25
The addition of the PEG ratio (Price/Earnings-to-Growth) is an additional factor. Although Nvidia's growth rates justify its high valuation, if there is any decrease in projected growth rates, the high valuation will come under significant inflationary pressure. Therefore, analysts will constantly be recalibrating their models. When consensus growth expectations fall by 5 to 10 per cent, the gross calculation on a company's fair value can change dramatically.
Discounted cash flow models are utilized by professional investors and will react negatively to changes in assumed growth rates. Investors would assign a greater multiple to a company growing at a rate of 50% per annum than they would assign to a company that was growing at a rate of 20% per annum. When the investing public begins to doubt that Nvidia can continue to grow at triple-digit rates as it matures, it will create a compression of its current valuation, even if the underlying business remains solid.
The volatility that will occur is not necessarily negative; it is simply indicative of the way the market re-prices the expectations of the future. It presents a trading opportunity for short-term investors, but long-term investors must evaluate whether current multiples represent sustainable future growth or simply a period of euphoria.
Profit-Taking Explained: Why Nvidia Stock Dips After Big Gains
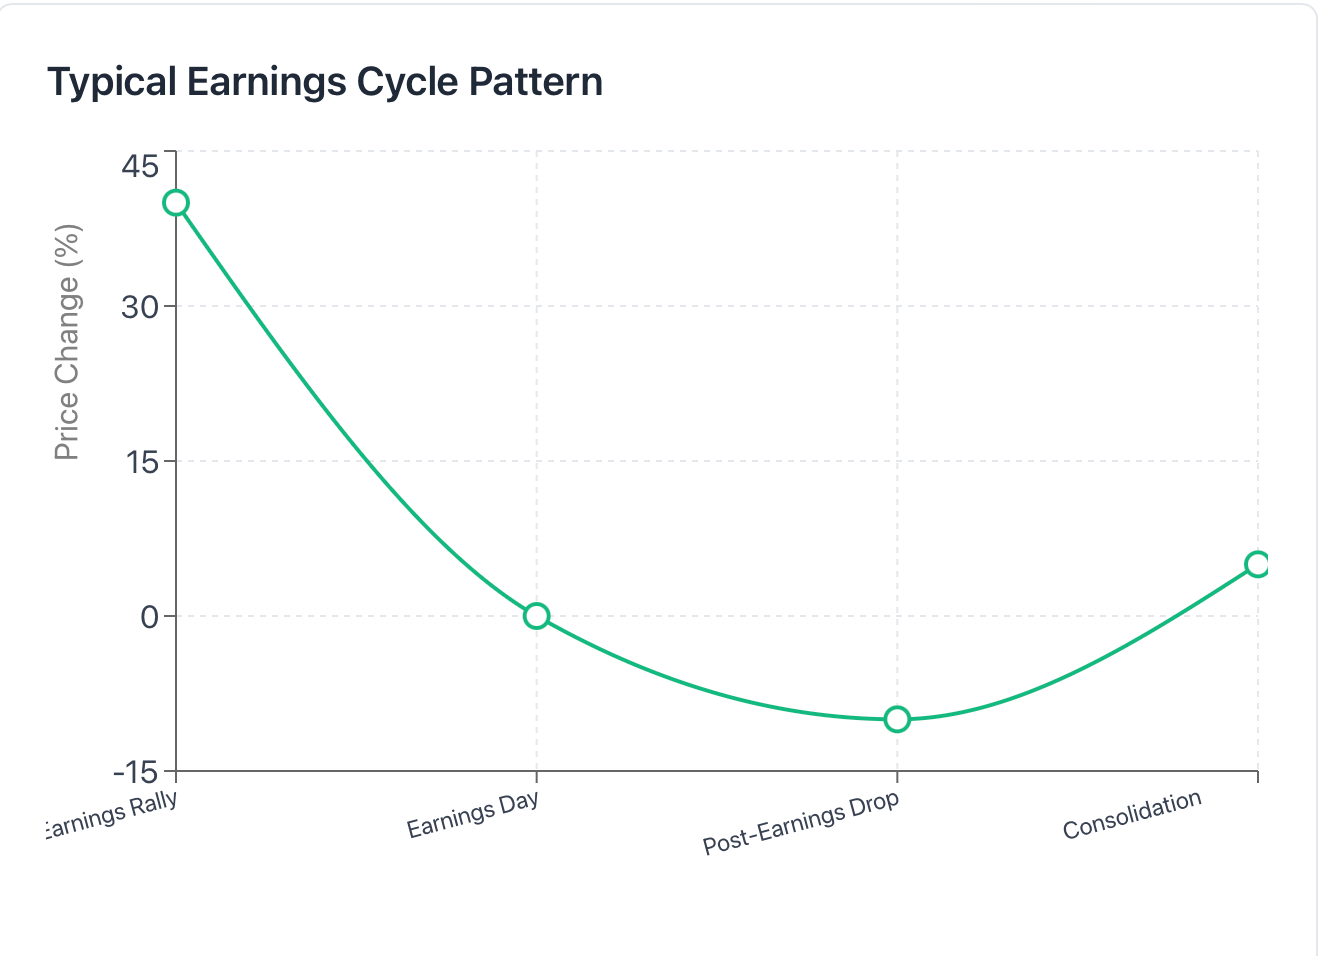
The phrase "Buy the rumor, sell the news" is not only a clever phrase; it also describes a trading behavior that has happened many times before with Nvidia. Basically, over the last several years, Nvidia stock has consistently gone up 30-50% in price leading up to their earnings reports as investors continued to factor in "perfect" earnings into the stock price. Conversely, no matter how easy it is for Nvidia to exceed their earnings estimates, the stock price eventually drops once the expected price increase has already been built into the stock price.
Consider a student who continues to receive a perfect score of 100% on all their tests. When that student gets a score of 95%, the feeling of failure is still considered real even though a score of 95% is still objectively good. Just like that, Nvidia's stock is often treated by the market with the same extreme expectations that are unnecessary, and anything less than extraordinary can create disappointment for both investors and traders alike.
The Traditional Earnings Movement:
-
Pre-Earnings Rally (4 -6 Weeks): +30 - 50%
-
Earnings Day: Beat Expectations
-
Post-Earnings Movement: -5 - 15% Correction
-
Consolidation: 2 -4 Weeks
-
Next Rally Cycle Starts
This is not only about Nvidia, but many very high-momentum stocks tend to follow the same patterns and principles; therefore, it is important for people to understand that when big runups in stock prices get sold off as taking profits by traders that had entered the market many months ago, that taking profits is normal market behaviour and does not indicate a problem with the underlying stock itself.
Institutional rebalancing is a big catalyst for this issue. A fund manager who has limits on how many shares of a stock they can hold at any given time, for example, could be forced to sell some of their shares of Nvidia following a huge rally in price as a mechanical part of keeping a balanced portfolio. The selling is not due to a negative view of Nvidia, rather it is simply part of how to keep a balanced portfolio. It does, however, create downward pressure on Nvidia's stock.
Traders who are aware of these patterns will position themselves accordingly. Traders will sell call options prior to earnings, take some profits after big price movements or use trailing stops as a way of managing the expected volatility. The big mistake is to think that every dip represents a fundamental issue with the company when it is often just a natural cycle of profit taking that is occurring.
Nvidia vs AI Competitors: How Rising Rivals Impact Stock Performance
Growing competition means AMD's MI300X chips have started to gain ground on Nvidia's H100 with some language model training workloads closer to performance metrics between the two. Additionally, there are now numerous competitors in the AI chip space like Intel's Gaudi accelerators, Google's TPU v5s, and Amazon's Trainium chips which provide lower-cost options for AI companies to become less reliant on Nvidia.
If you think of the way a neighborhood had one main milk tea shop for many years and then three new ones opened up offering comparable quality but at lower price points; the original shop may have had a strong following but it also lost market share. Similarly, this is what is currently happening in the AI chip industry.
Competitive Landscape
-
AMD MI300X: Excellent performance for LLM with aggressive pricing
-
Google TPU V5: Designed specifically for Google Cloud Workloads
-
Amazon Trainium: The best low-cost option for AWS customers
-
Intel Gaudi 3: Commercially-driven enterprise focus with competitive pricing
However, Nvidia still has several advantages over all of its competitors: Its software ecosystem includes CUDA, it has spent many years partnering with many of the biggest AI labs, and it has also achieved significant performance improvements in some of the hardest applications to work on.
However, the performance gap between Nvidia's competitors is decreasing rapidly. As soon as Microsoft, Meta, or Amazon can internally manufacture chips that are capable of handling 60-70% of their total workloads at a significantly lower cost, that will fundamentally alter the growth trajectories of all the major players in the AI chip industry.
Market prices stocks based on future expectations. If investors expect Nvidia's revenue to grow 60% next year but it grows only 40% due to competitive activity then Nvidia's stock will drop even though it achieved its own significant revenue growth over the previous year (40% compared to last year's revenue). As such, understanding the competitive forces will be critical in determining the growth expectations and thus the ultimate valuation of a stock.
For day traders to gain a competitive advantage, they need to be aware of their competitors' new product launches, benchmarking leaks and diversification announcements from their key customers.
For example, Meta announcing that it intends to increase its usage of internally made chips would give traders a clear indicator that Meta is looking to increase its total addressable market and would pose a direct threat to Nvidia's business. While this type of announcement doesn't indicate that a trader should exit from Nvidia, it gives the trader reason to reevaluate the growth projections and pricing targets associated with the stock.
How Interest Rates, Inflation & Geopolitics Are Driving Nvidia Stock Down
Growth Stocks are impacted by macroeconomic factors much more so than by Value stocks, which is evidenced by Nvidia's high-growth stock potential. An example of the way Interest Rates affect Stock Prices is that as interest rates rise, the present value of future earnings will decrease according to Discounted Cash Flow Models, and since the majority of Nvidia's earnings are expected to come from 5-10 years into the future, any change in interest rates will significantly impact Nvidia's Earnings Estimates.
For instance, a company that is planning to build an AI Data Center may have budgeted $500 Million for the GPU Infrastructure needed for the purchase of NVIDIA GPUs, and if that company's cost of borrowing were to increase from 3% to 7%, the company's projected return on investment would be drastically altered. Many companies will therefore either delay their capital expenditure projects or scale back their investments, directly affecting Nvidia's near-term Demand for their GPUs.
The causal relationship between interest rate changes and the overall Stock Market are as follows:
-
The Federal Reserve raises interest rates.
-
The cost of borrowing increases.
-
Companies will delay capital expenditure projects and therefore GPU Demand will soften.
-
Earnings Estimates for Nvidia will be reduced.
-
Valuation Multiple for Nvidia will compress.
-
The Technology Sector will sell off.
-
Nvidia will receive further downward pressure.
The addition of Geopolitical Tensions is another issue compounding the challenges exposed by interest rate changes. The U.S. Government has issued Export Controls on Advanced Chips to China and thus limits Nvidia's Addressable Market. The H800 and H20 (modified versions of the H800 and H20 for sale in China) are much lower gross margin products than their full-versions, thus providing an additional market uncertainty due to the Regulatory Environment changes. Due to escalating geopolitical tensions worldwide, both Lost Revenue and Execution Risk for Nvidia will continue to factor into Investors' Valuations of Nvidia.
Increasing inflation causes a double squeeze. It increases manufacturing input costs for companies and increases margin pressures on customers, thus lowering their spending budgets for AI (artificial intelligence). In the short term, Nvidia has pricing power, but sustained inflation will negatively impact the quantity of demand for their products due to reduced elasticity.
Professional traders monitor closely, in addition to Nvidia's announcements, the 10-year Treasury yield, the Federal Reserve's meeting minutes and geopolitical news; these global macroeconomic indicators create the environment where Nvidia will conduct its business. It is possible for the strong fundamentals of a company to be outdone by macroeconomic headwinds, which is why diversification and position sizing are so important when constructing a portfolio.
Investor Sentiment & Market Hype: Why Nvidia Stock Drops Despite Strong Fundamentals
Nvidia is more susceptible than other stocks to sentiment changes related to various narratives. During periods when the popularity surrounding AI has reached its peak, it has become a primary investment choice based on this theme. When there were rising doubts concerning AI, Nvidia experienced an increased selling pressure, even though its underlying business was performing well.
Take for example how your classmates create excitement prior to the release of a particular movie. At the time of release, many of them plan to see the movie on opening weekend; however, once a couple of them attend and report back that it was "okay" at best, a large percentage of the original moviegoers will lose interest in going to see it as a result. You see the same type of phenomenon occurring at Nvidia, but blown up to much larger proportions.
Sentiment Indicators:
-
VIX (Fear Index): Inverse correlation to Nvidia's price changes
-
Put/Call Ratio: Higher ratio indicates a bearish outlook
-
Social Media mentions: Increased negativity in social media activity prior to stock declines
-
Analyst downgrades: Downward moves amplified by herd mentality
The Fear and Greed Index serves as a valuable indicator. When the index hits "Extreme Greed," Nvidia is typically trading at excessive levels with regards to its fundamentals. The smart investor will begin moving their capital away from Nvidia while the retail investor will begin their investment frenzy. After that, a minor negative catalyst causes a disproportionate downward movement due to momentum change.
This creates a challenging environment for investors focused on the fundamentals. For example, when Nvidia announced record earnings, raised their quarterly guidance, and released new products, the stock declined by 8%. The reason for this was because investor sentiment had already priced in perfection, and although Nvidia's results were very strong, the news was not enough to exceed overly optimistic expectations.
For contrarian traders, these situations provide a unique opportunity. When the financial market sentiment has reached its peak of negativity, yet the fundamentals of the stock continue to show strength, it creates an asymmetrical opportunity for traders.
The most difficult task for a trader is to be able to differentiate between temporary fluctuations in market sentiment versus actual long-term deterioration of a stock's fundamentals. Through thorough research and identifying patterns, successful traders can distinguish themselves from traders that simply react to news stories and analyst opinions.
Nvidia Revenue Breakdown: Key Growth Drivers Behind the AI Leader
Rising revenue guidance, along with higher data centre segment revenue relative to gaming revenue, allows investors to estimate the future growth trajectory and ultimately the profit potential of Nvidia's business model.
Due to Data Center revenue dominating the overall total revenue and being the fastest growing sector in Nvidia's portfolio, it is important for investors to pay increased attention to Data Center revenue guidance when assessing Nvidia stock valuations and comparing Nvidia to other tech companies.
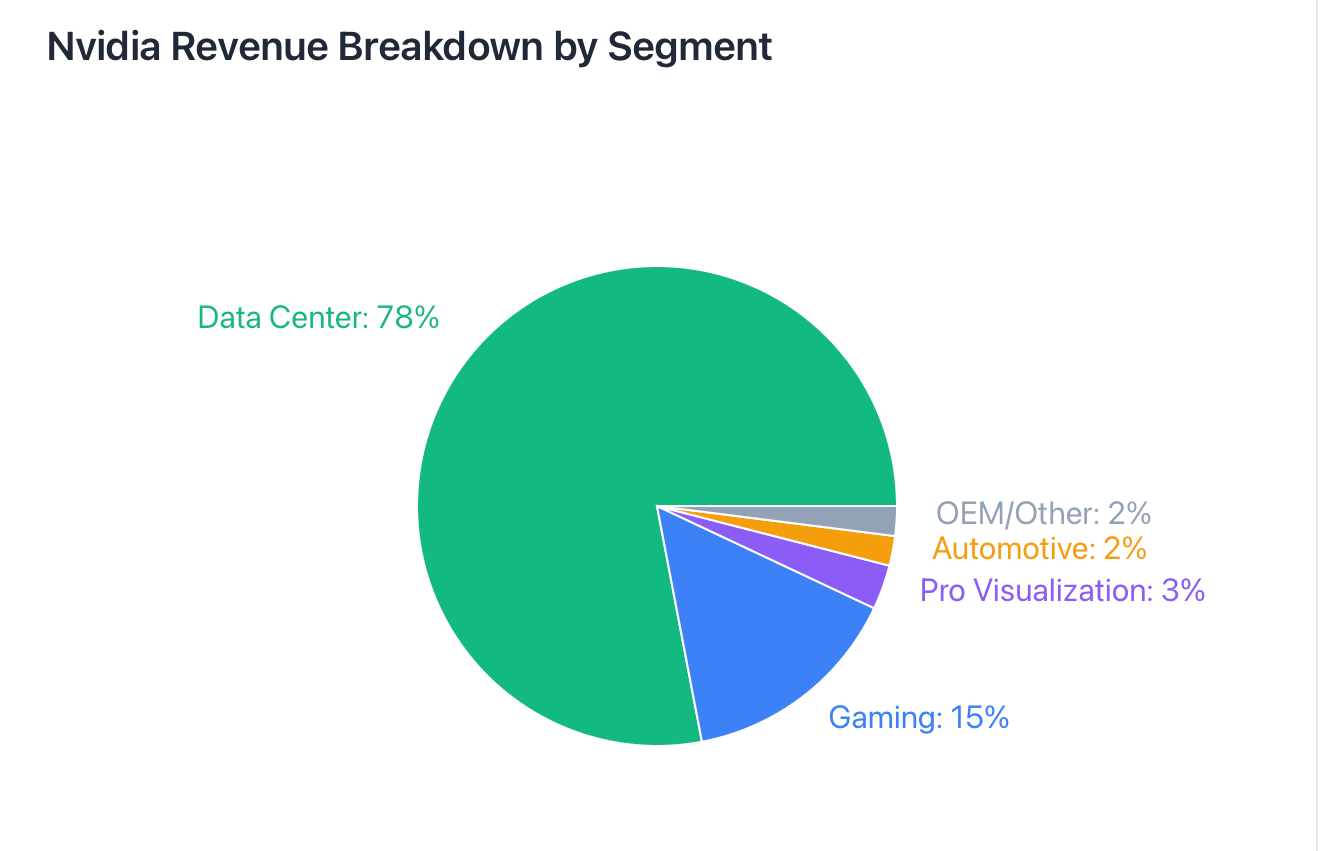
Revenue Segments (Recent Quarter):
-
Data Center: 78% (~$26 billion) – AI training & inference
-
Gaming: 15% (~$3 billion) – Consumer GPUs
-
Professional Visualization: 3% (~$400 million) – Workstations
-
Automotive: 2% (~$300 million) – Self-driving tech
-
OEM/Other: 2% (~$150 million)
If you think about it in terms of comparative industries, Nvidia is similar to a beverage business that was originally primarily a coffee business, but now is primarily selling smoothies. Each sector contributes differently to the overall revenue and, therefore, profitability.
For example, if you had a 10% decrease in smoothie sales, your overall revenue will be significantly impacted, whereas if you had a 20% decrease in cookie sales, it would be a much smaller impact on your overall revenue.
The margins on the Data Center segment (70%+) are considerably higher than those of the Gaming segment (60-65%). This large difference in margin levels has created an opportunity for the Data Center business model to increase the company's overall profitability. This is why analysts focus on Data Center guidance because it produces both revenue and margin expansion.
How Data Center can be further delineated into three segments - 60% comes from AI Training (H100 and A100), followed by 25% Inference workload (faster growth), and 15% from High-Performance Computing and Enterprise Applications. With regard to Sustainability, Inference growth is the most relevant because Inference is on continuous repeat revenue as AI Models are deployed.
Automotive Industry - Wildcard due to being in a very embryonic stage of development at this point, but partnerships with Mercedes, Tesla, and other automotive manufacturers position Nvidia for larger growth opportunities as autonomous driving enters a point of critical mass. Analysts do not currently expect significant Automotive revenue until 2026 or 2027; therefore, there is a significant upside opportunity here.
Nvidia Supply Chain Risks: How Production & Export Issues Affect Stock Price
Complexity in the supply chain causes risk in execution for Nvidia. Unlike some chipmakers, Nvidia does not produce its own chips; it contracts with TSMC to create and perform advanced CoWoS (Chip-on-Wafer-on-Substrate) packaging. Constraints at TSMC directly limit Nvidia's ability to fulfill customer orders.
Envision a well-known restaurant that relies on a single farm for one of its most critical ingredients. If something happens to the farm (drought or other supply problems), it does not matter how many people want to eat at that restaurant , without that key ingredient, the restaurant cannot serve its signature dishes. This is how Nvidia is dependent on TSMC for CoWoS.
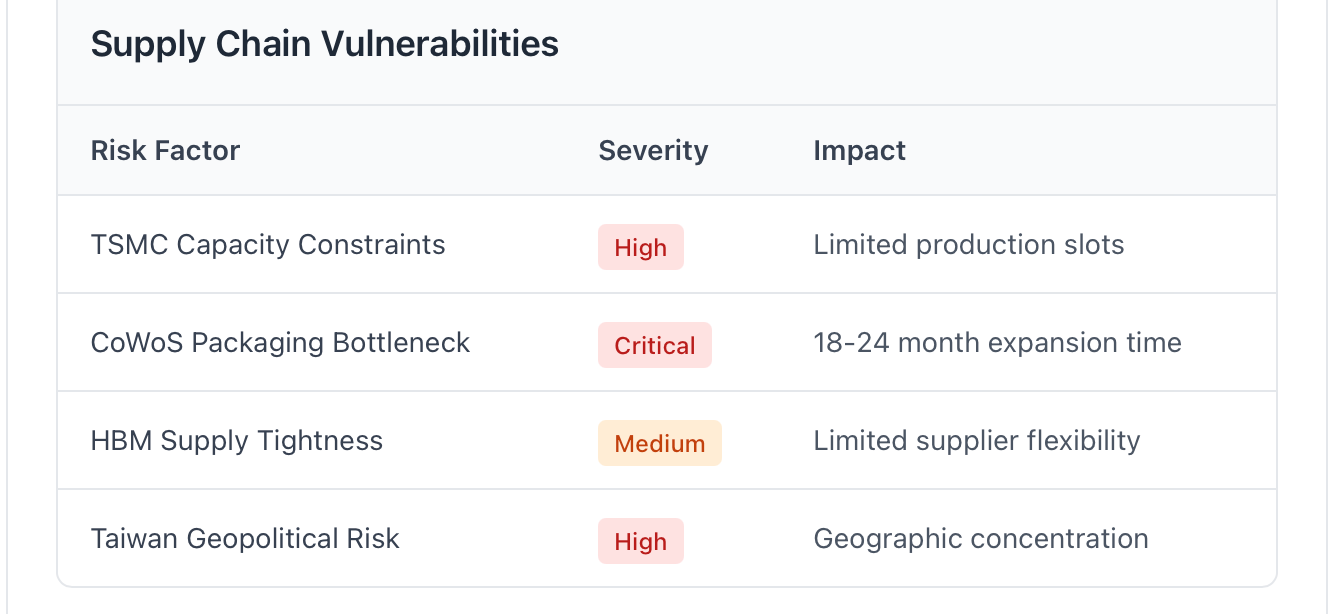
Vulnerabilities in the Supply Chain:
-
TCMC Capacity - There are a limited number of available production slots at TSMC for the newer 5nm and 4nm technology nodes.
-
CoWoS Packaging - It is a very specialized process with very few alternatives to it.
-
High Bandwidth Memory (HBM) - The flexibility of the supply chain for HBM from SK Hynix, Samsung Memory, and Micron Memory is very tight right now.
-
Taiwan Geopolitics - The concentration risk of concentrating so much of your supply chain in one geographical area.
The CoWoS packaging bottleneck is the most severe of these supply chain vulnerabilities since it provides the means to provide very high-bandwidth connections between the GPU and the memory on Nvidia's chips. However, expanding the CoWoS capacity at TSMC is very difficult since they have limited capacity today, and it takes 18-24 months to expand that capacity. Therefore, when demand spikes unexpectedly, that is a hard cap on production.
The concentration of customers also adds another layer to the risk. The combined orders from Microsoft, Meta, Amazon, and Google make up 60% of the total revenue from the Data Center segment of Nvidia. If any of these large hyperscalers cut back their orders to Nvidia, the impact would be material. More importantly, these large hyperscalers are also developing their own internal product alternatives, thus becoming less dependent on Nvidia as a supplier.
Policy risks are associated with export controls. The limitation of U.S. sales of the most advanced chips to China has drastically reduced an important market potential for U.S. manufacturers. Nvidia has attempted to address their customers in China by offering them modified versions of their products (H800, H20); however, these alternatives result in lower either total revenue or higher costs rather than the previous margins. Any new restrictions on chip sales will create similar additional challenges for other manufacturers, such as redesigning products and/or leaving the Chinese market altogether.
Traders in TSMC (Taiwan Semiconductor Manufacturing Co) need to be alert to TSMC's quarterly earnings calls and any announcements made regarding new packaging capacity for TSMC and/or TSMC's potential geopolitical issues concerning Taiwan. While both of these factors can limit the upper point of prospective stock price gains due to supply constraints, they also provide good examples for explaining why prospective demand for TSMC will exceed supply if these external influences affect TSMC's ability to sell chips to customers.
AI Market Trends & Spending: Why They Matter for Nvidia Investors
Capital expenditure cycles, rather than a smoothly growing linear trend, identify AI infrastructure spending patterns (which tend to occur in waves with breaks in between cycles), while understanding/the understanding of capital expenditure cycles is helpful in determining the potential demand for Nvidia's products.
Similar to how schools purchase computers, AI infrastructure purchases are typically not small incremental purchases made on a monthly basis (e.g., 5 laptops), but instead, occur in large bulk purchases of equipment every couple of years (e.g., in the case of schools, 150 laptops) when budgets are allocated.
Key demands driving AI infrastructure spending:
-
The demand to train AI models (e.g., when creating new AI models like GPT, Gemini, etc.).
-
Expanded use of AI applications: demands for support for an expanding number of AI applications.
-
Engagement of the corporate sector with the construction of internal/external capability to develop AI solutions.
-
Government investment in the development of national AI infrastructure capabilities.
The global capital expenditure for AI-related data centers (i.e., built and operated by third-party providers) is projected to grow at an annual rate of 35 - 40% until 2027 and exceed $300 billion globally; however, the growth will not occur uniformly over time, but rather will occur in cycles of aggressive capital expenditures followed by periods of capital expenditure optimization before continuing into cycles of aggressive capital expenditures.
The transition of the AI marketplace from the "training" phase to the "inference" phase of utilizing trained models is critically important because during the training phase of a model (such as GPT-4) using 10,000 GPU cores, that model's use of GPU resources will exponentially increase, at some point in time, as a result of utilizing the model across hundreds of deployments.
While enterprise AI adoption is slower than hyperscalers, enterprise AI will be the larger long-term growth factor. When mid-sized enterprise customers deploy AI, it expands Nvidia’s addressable market significantly beyond just the large cloud service providers. Thus, this diversification will enhance revenue visibility and decrease NVDA's concentration risk on large technology customers.
Sovereign AI initiatives such as the UAE, Saudi Arabia, France, and other countries funding and building their own national AI infrastructure has created a new growth opportunity for NVDA. These sovereign projects have typically focused on deploying NVDA's most sophisticated chips and provide NVDA with higher-margin revenues.
Tracking cloud providers' capital expenditure guidance, funding levels of AI startups, and enterprise surveys on adoption of AI gives investors early indication of future AI demand. For instance, Microsoft has stated it anticipates a 25% year-over-year increase in its Azure capex, which would equate to stronger demand for its GPUs from NVDA with a lag of approximately two to three quarters.
Nvidia Stock Correlation: Impact on AI ETFs, Tech Stocks & CFD Trading
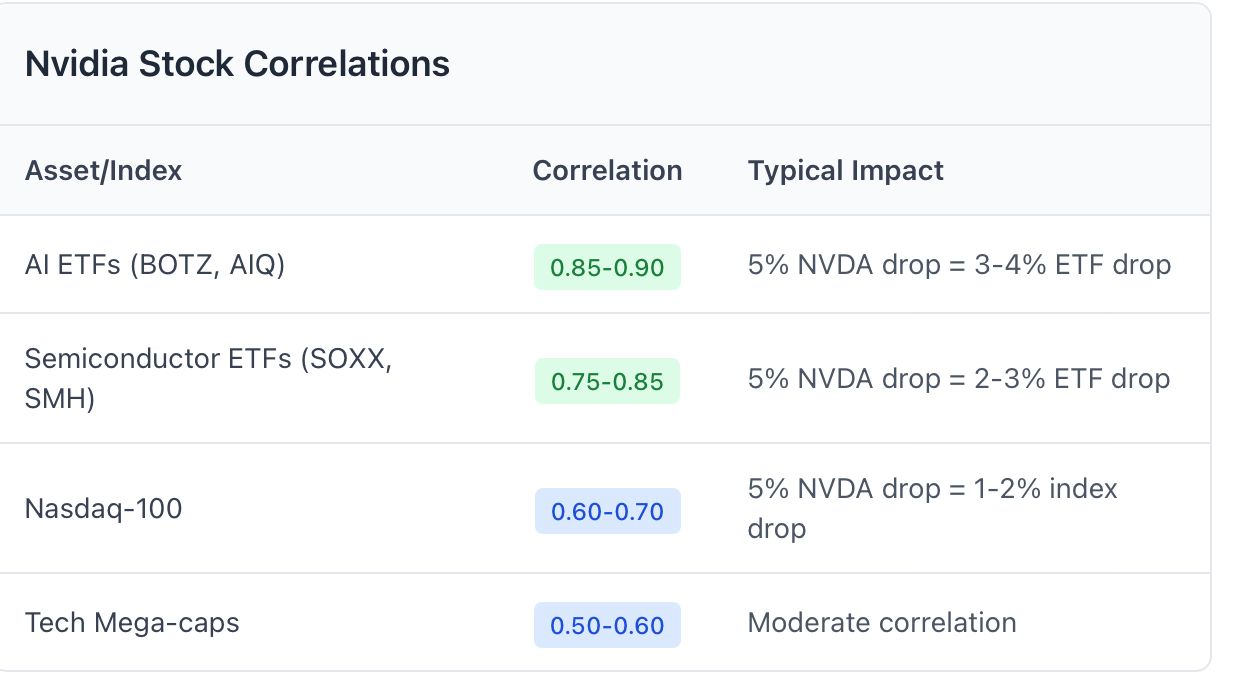
When Nvidia experiences a 5% decrease in value, correlationally, AI ETF BOTZ typically experiences a 3% decrease in value, SMTETF typically experiences a 2%–3% decline in value, and Nasdaq has shown signs of weakness. This correlation creates both the risk of investing in Nvidia and the potential for profit within it.
-
AI ETFs (BOTZ, AIQ): 0.85-0.90 correlated
-
Semiconductor ETFs (SOXX, SMH): 0.75-0.85 correlated
-
Nasdaq-100: 0.60-0.70 correlated
-
Tech Mega-caps (AAPL, MSFT, GOOGL): 0.50-0.60 correlated
CFD traders use these correlations to develop more sophisticated trading strategies. A CFD trader can short the SMH or SOXX before those ETFs reflect Nvidia's movement because the movement of an individual stock typically leads to a delay in ETF rebalancing. The time difference between individual stock price movement and ETF rebalancing creates a temporary arbitrage opportunity.
Different from Nvidia's pattern of increasing volatility, due to earnings, new product releases, and macroeconomic factors (like the Federal Reserve), Nvidia's options pricing has historically shown a spike in implied volatility prior to these three events with subsequent crashes in prices after. CFD traders can take advantage of the pattern of Nvidia equities growing in value during periods when its implied volatility is lowest and decrease their position sizes during periods of maximum uncertainty.
Nvidia is spotted as having potential for success with trend-following strategies created on Nvidia's frequent strong directional moves. With the price moving above its most important resistance levels, there is a high likelihood that momentum will push prices a further 10-15% before pulling back. Conversely, if prices fall below their most important support levels the selling pressure will be amplified through the triggering of stop losses and the exit of momentum traders.
Contract For Differences (CFD) Trading Opportunities:
-
Breakout Trading: Long (Buy) as Nvidia breaks through key technical levels.
-
Pairs Trading: Long (Buy) Nvidia and short (Sell) AMD when relative strength shifts.
-
Event Trading: Position ahead of earnings announcements based on historical volatility patterns.
-
Mean Reversion: Fade extreme moves that occur in periods of low volume.
More detailed risk management must be utilized with the inherent volatility of Nvidia. A stock that can gain or lose 8% on a single round of earnings news has a strong potential to stop out poorly positioned trades. The use of wider profit and loss stops, smaller position sizes, and defined risk parameters allows you to ride out the volatility while reaping the benefits of the overall trend.
The correlation between Bitcoin and cryptocurrency products have become increasingly stronger relative to Nvidia, as both are viewed as risk-on investments. When cryptocurrency trades have increased, Nvidia's stock price typically responds similarly. This has historically not been the case; however, there has been a notable pattern within 2023-2024.
Common Mistakes & Trader Pitfalls
Many experienced traders are susceptible to making similar errors with Nvidia's stock. The volatility of Nvidia's stock, along with its media exposure, is a psychological trap that can wipe out capital if one is not careful.
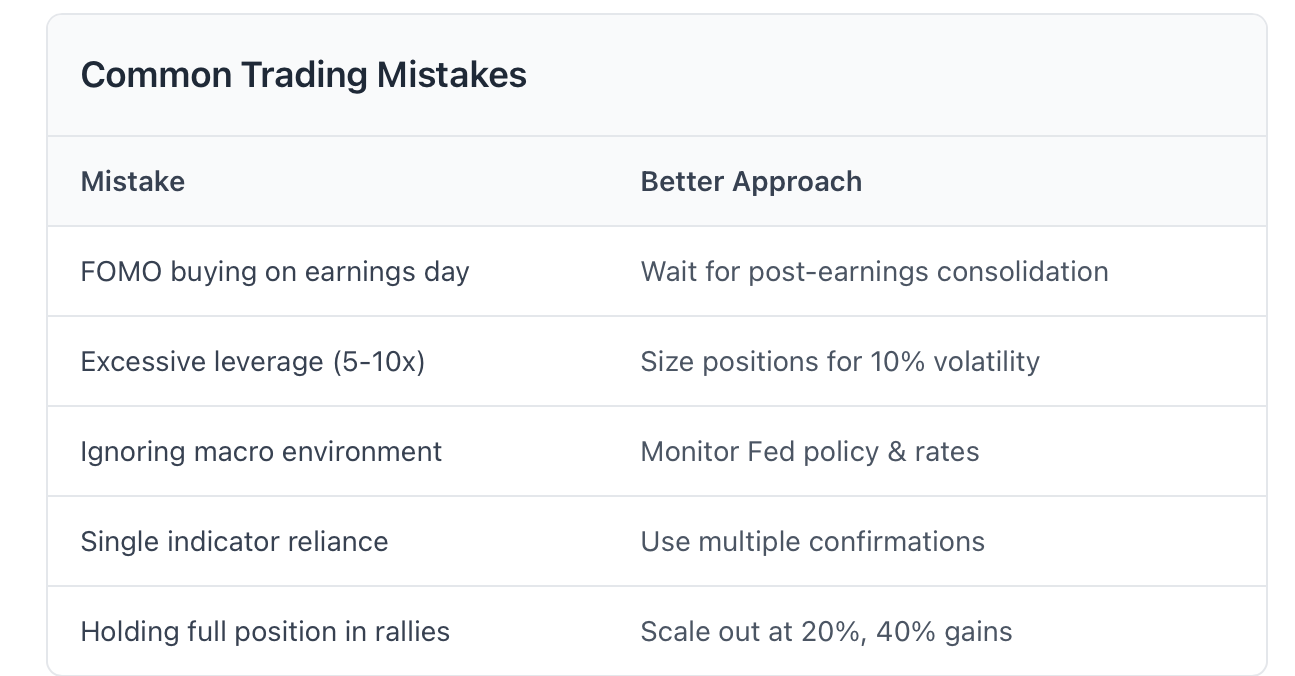
Mistake 1: FOMO trading due to the company's quarterly earnings announcements. Nvidia has a consistent history of beating analysts' earnings estimates by approximately 20%, and providing higher forward guidance, yet its stock price drops by about 6% after those announcements. Traders who purchased Nvidia's stock due to the anticipated earnings release typically panic sell at a loss. As such, traders should always expect profit-taking actions after large price runs, regardless of how positive the generated earnings are.
Mistake 2: Using too much leverage on volatile stocks, such as Nvidia. There are many days when Nvidia can have a five to 8% swing in its stock price without any news. Using excessive leverage (i.e. attempting to create a 50% return on a 5% price movement) would result in a trader getting wiped out if the stock price were to move against the position by 3%. Traders should size their positions properly to accommodate volatility in their respective stocks. For example, if the stock is capable of a 10% price movement, then the size of the trading position must allow for a 10% price movement without the necessity for liquidation of the position due to excessive loss.
Mistake 3: Ignoring the macroeconomic environment: A trader may do an excellent job of evaluating Nvidia's fundamentals but fail to recognize that the Federal Reserve is raising interest rates aggressively. In a rising-rate environment, regardless of how well a company is performing financially, growth stocks will underperform vs. value stocks. Therefore, in addition to performing a thorough analysis of a company's individual fundamentals, context should always be part of the analysis.
Mistake 4: Inability to Utilize More Than One Indicator: Many traders utilize only one indicator (i.e., the RSI or the MACD) to enter a trade's position without having confirmed it with other indicators and/or time frames. This can lead to an incorrect entry based on a signal being interpreted by only a single timeframe or indicator. Nvidia's volatility creates periodic whiplash in many technical indicators. Prior to entering any position, have confirmation from multiple indicators.
Mistake 5: Failing to Take Profits When Partial: You may hold on to a position too long after a stock has rallied up to 40% before taking down a portion of your position, and you end up losing the profits after the stock corrects back down 15%. Scaling out of positions means taking 25% off the table after a trade reaches a 20% gain, and then taking off another 25% when the stock is 40% to 50% up; this locks in your profits while allowing for upside participation.
The Case Study of Nvidia (Q4 2023 Earnings FOMO) - Nvidia announced Q4 2023 Earnings on February 21, 2024, which were significantly better than expected by the market prior to the company's announcement of its results and its guidance for future growth. In advance of these earnings, Nvidia's stock had increased in value from $450 to $720 (+60%). Once the market received the company's actual results, as indicated on the company's Q4 Earnings, it traded up to $785 in after-hours trading on February 21, 2024, and closed at $722 on February 22. A week later, the stock was trading down to $680 in value. Traders that bought into this after-hours spike found themselves down anywhere between 10% and 15% within a week due to the correction in the stock price, despite having been "correct" in regards to the fundamentals.
This case demonstrates an important distinction between being right about a company versus being able to generate a profit from that investment. Timing, position, and risk management are just as important as conducting a fundamental analysis of the underlying company.
Actionable Strategies & How to Use Tradewill
How to Use CFDs to Trade Nvidia with Risk Management in Place
Using a Multi-Timeframe Analysis
Use a Monthly Chart to find the overall trend direction of Nvidia, then a Weekly Chart for Intermediate Signals, and lastly a Daily/4-Hour Chart for more precise entry points.
For Nvidia, Long Term is Bullish on the Monthly Chart, Neutral is on the Weekly Chart, and Short Term is Oversold on the Daily Chart. Therefore, you can enter Trades during the Short Term when you are expecting a bounce back to the Long Term direction on the Monthly Chart, and use the Weekly Consolidation period to determine if it will continue to trend upwards.
Apply A Swing Trading Plan
Identify Support/Resistance Levels from past Consolidations and rebounded higher from Decreasing Volume, use the Reversal Patterns (Hammer, Morning Star) as Entry Signals. Place stops 3-5% below these Support Levels depending upon Volatility and Target previous Resistance Levels for an estimated Target Gain of 8-12%. Time of Holding is between 1-4 weeks.
Apply A Breakout Trading Plan
Observe Nvidia's price action in Consolidation Patterns and Volatility after Major Moves. When you observe a period of consolidation for 2-3 weeks within a Tight Range after a Major Move, Volatility has decreased, and the potential for a Breakout has increased. If a Breakout occurred, enter Trades on an Increase in Volume and use the Consolidation Low as your Stop-Loss Level and use the Measure of the previous as a Reference for your Target Price for the Breakout.
When trading Nvidia CFDs via Tradewill Platform, traders can take advantage of many tactical advantages including Leveraging – where you can use less money to control much larger positions. Leveraging is ideal for those times when the opportunity is there to go long (buy) during trends. However, leveraging can also cause problems if not used appropriately.
The Tradewill Platform allows traders to go long (buy) when the market is trending and short (sell) when the market pulls back to correct itself.
The Platform includes many tools to help traders adhere to trading discipline. By setting their stop-loss based on technical levels instead of emotional levels, traders will protect their capital during periods of sudden volatility. By setting Profit Targets prior to entering trades, traders can take profits off the table without having to watch prices continuously throughout the day.
Risk Management Forms:
-
Position Size: No more than two percent of your capital can be risked on any one trade
-
Stop Placement: Based on technical analysis, not random percentages
-
Profit Target: At least two times the Risk per Trade
-
Buyer Scalable Add-on: Add to winning positions when they are making profits and Remove Losing Positions from consideration as quickly as possible.
-
Journal Chart: Keep a journal of all trades you make in order to review what patterns generate winning trades and losing trades for you.
Don't put all your faith in one indicator; instead, utilize several indicators together:
-
Trend: 50-Day & 200-Day Moving Averages
-
Momentum: Relative Strength Index (RSI) (14 Period)
-
Volatility: Bollinger Bands
-
Volume: Volume used to confirm breakout and breakdowns
When the indicators align (price above the 50 MA; RSI has recovered from over-sold but not over-bought; Volumes are increasing; B.B. squeeze is breaking), there is more conviction behind the trade. If there is conflict between the indicators, wait for a clear signal.
The intent is not to predict every single price movement, but instead to find high probability setups, manage risk well, and let winners run while cutting losses. Nvidia has a great deal of volatility and thus many chances to win for disciplined and emotionally controlled traders.
Ready to Trade Nvidia with Confidence?
Open your Tradewill account today and access advanced CFD trading tools, real-time charts, and leverage options designed for serious traders. Whether you're capturing Nvidia's next breakout or hedging portfolio exposure, Tradewill gives you the platform to execute your strategy.
Disclaimer: The content of the blog does not represent any position of Trade W, does not serve as any trading-related decision advice, and does not endorse any third-party.